The Effect of Earnings Management on Debt
Maturity: an International Study
L’effet de la gestion des résultats sur la maturité de la dette
: une étude internationale
Yao MAURICE*, Yves MARD**, Éric SEVERIN***
* Maître de conférences, Université de Montpellier, Faculté d’économie, MRM ** Professeur des Universités, Université Clermont Auvergne, IAE, CleRMa *** Professeur des Universités, Université de Lille, IAE-Lille RIME lab, EA 7396 Correspondance :
Yao Maurice
Maître de conférences Université de Montpellier Faculté d’économie Espace Richter Avenue Raymond Dugrand - CS 79606 34960 Montpellier Cedex 2
yao.maurice@umontpellier.fr
Yves Mard
Professeur des Universités Université Clermont Auvergne IAE-CleRMa 11 Boulevard Charles de Gaulle 63000 Clermont-Ferrand yves.mard@uca.fr Éric Séverin
Professeur des Universités Université de Lille IAE-Lille RIME lab, EA 7396
104 Avenue du Peuple Belge 59000 Lille
eric.severin@univ-lille.fr Remerciements : Les auteurs souhaitent remercier les deux réviseurs anonymes ainsi que la co-rédactrice en chef, Isabelle Martinez, pour leurs remarques pertinentes et constructives. Ils remercient également les réviseurs et discutants des congrès de l’AFC et de l’AAIG.
Abstract
This paper examines the effect of earnings management on debt maturity and how this relation is influenced by institutional environments. The sample is from 17 European countries of STOXX Europe 600 Index over the 2006-2014 period. We find that firms with high earnings management activities, both the discretionary accruals and real earnings management, are associated with less long-term debt. More importantly, we observe that the negative link between earnings management and long-term debt holds only in countries with weak creditor rights. This suggests that high creditor protection tends to compensate the weakness of borrower’s financial reporting quality.
Key words: debt maturity, earnings management, creditor rights
Résumé
Cet article examine l’effet de la gestion des résultats sur la maturité de la dette et comment cette relation est influencée par l’environnement institutionnel. L’échantillon est issu de 17 pays européens de l’indice STOXX Europe 600 sur la période 2006-2014. Nos résultats montrent que la gestion des résultats, aussi bien par les accruals discrétionnaires que par la gestion réelle, a un effet négatif sur la dette à long terme. Plus important encore, nous observons que le lien négatif entre la gestion des résultats et la dette à long terme ne tient que dans les pays à faible protection des créanciers. Ce résultat suggère que la bonne protection des créanciers tend à compenser la faiblesse de la qualité de l’information financière des emprunteurs.
INTRODUCTION
Prior literature emphasizes the important role of high financial reporting quality to obtain better debt contracting terms (Ahmed et al. 2002; Francis et al. 2005; Bharath et al. 2008; Costello and Wittenberg-Moerman, 2011). This relationship is based on the idea that financial reporting quality and disclosure are also a means to reduce adverse selection and moral hazard problems by improving contracting and monitoring (Healy and Palepu, 2001). For example, Ahmed et al. (2002); Francis et al. (2005) show that high financial reporting quality contributes to reduce the cost of debt. Bharath et al. (2008) provides evidence that it leads to fewer requirements of collateral. Costello and Wittenberg-Moerman (2011) show that lenders decrease their use of financial covenants when earnings quality is high. Using a sample of small and medium-sized firms in Spain, García-Teruel et al. (2014a) show that firms with higher earnings quality have access to more trade credit from suppliers. García-Teruel et al. (2014b)also analyze the effect of accruals quality on the access of firms to bank debt in a sample of small and medium-sized firms in Spain. The authors find a positive association between accruals quality and bank debt.
If previous empirical research has investigated the role of financial reporting quality in debt contracting terms such as cost of debt, collateral, access to bank debt, there are still few studies on the relationship between financial reporting quality and debt maturity. Examples are Bharath et al. (2008) and García-Teruel et al. (2010) studies. Using accruals quality to measure financial reporting quality, these two authors find that high accounting quality is associated with long-term debt. Thus, in order to extend these previous studies, we examine in our paper, the effect of earnings management1 on debt maturity. We further investigate whether creditor rights influence the effect of earnings management on debt maturity.
Since financial statements are an important source of information for lenders, the quality of accounting information impacts the lenders’ estimates of future cash flows from which the debt will be repaid (Bharath et al. 2008). Therefore, stringent contract terms for low accounting quality borrowers reflect lenders’ compensation for information risk (Easley et al. 2002; Francis et al. 2005; Bharath et al. 2008). In a similar vein, El Ghoul et al. (2016) argue that since corporate misreporting widens lenders’ information asymmetry, they respond by more monitoring. For example, by refusing to grant long-term debt. Thus, a high financial reporting quality can contribute to obtain better debt contracting terms such as longer debt maturity. Moreover, Qian and Strahan (2007) and Bae and Goyal (2009) find that stronger
legal rights result in loans with longer maturities. Accordingly, we investigate whether the negative impact of earnings management on debt maturity depends on creditor rights.
To test our hypothesis, we use a European sample of 3524 observations with STOXX Europe 600 Index between 2006 and 2014. The STOXX Europe 600 Index represents large, mid and small capitalization companies across 17 countries of the European region. Earnings management is frequently used as a measure for information quality in the literature (Bhattacharya et al. 2003; Francis et al. 2005; An et al. 2016). We measure earnings management using two model-estimated earnings management proxies: discretionary accruals and real earnings management activities (Roychowdhury, 2006). We use two measures of discretionary accruals. The first measure is the model developed by Jones (1991) and modified by Dechow et al. (1995). The second measure is the model developed by Kothari et
al. (2005). In order to examine whether creditor protection affects the relation between
earnings management and debt maturity, we estimate our model for subsamples of strong creditor rights and weak creditor rights.
We find that earnings management has a negative effect on long-term debt in firms’ debt maturity structure. This suggests that high financial reporting quality by reducing asymmetry information, contribute to obtain a better debt contracting term such as longer debt maturity. We also find that the negative association between earnings management and long-term debt is attenuated by high creditor protection. This finding suggests that high creditor protection tends to compensate the weakness of borrower’s financial reporting quality.
Our main contribution is to study the impact of creditor rights on the relationship between earnings management and debt maturity. Using a European sample, we document that the negative association between earnings management and long-term debt depends on the level of creditor rights. We also extent previous studies (Bharath et al. 2008; García-Teruel et al. 2010) by showing that real management activities impact negatively long-term debt in firms’ debt maturity structure. To the best of our knowledge, the relationship between real earnings management activities and debt maturity has never been explored. This is consistent with Roychowdhury (2006) that real activities manipulation can reduce firm value because these activities affects cash flows.
The rest of the paper is organized as follows. Section 1 presents the related literature and our hypothesis. Section 2 describes the research design and the data used in this study. Section 3 presents the results. Finally, we conclude.
1
Literature and hypothesis development
1.1 The effect of earnings management on debt maturity: literature review
In this research, we study earnings management through both accruals and real activities manipulations. The link between earnings management and debt maturity has been the subject of little investigation. If we consider earnings management through accruals, this link can be explained by the important role of high financial reporting quality in reducing asymmetry of information. For example, in the context of a code law country, García-Teruel et al. (2010) use Spanish firms to study the relation between accounting quality and debt maturity. They measure accounting quality by the quality of accruals. The result of this study shows that firms with poor accruals quality have shorter debt maturity than firms with good accruals quality. This suggests for the authors that it is worthwhile for firms to improve the quality of their accounting information in order to avoid negative effects of asymmetric information on their access to long-term loans.
Using a sample of loans issued by U.S. public firms in the syndicated loan market, Fang et al. (2016) examine whether borrowing firms’ financial statement comparability affects debt contracting. They show that firms with higher comparability take loans with longer maturity, and they are less likely to pledge collateral in loan contracts as compared to firms with lower comparability. Thus, lenders are more willing to offer loans with more lenient terms, such as longer maturity and no collateral requirements.
To the best of our knowledge, the link between real earnings management activities and debt maturity has never been explored in the literature. We therefore extend our analysis to the link between financing conditions and real earnings management. According to Chen et al. (2015), corporate credit risk is higher when real earnings management uncertainty is greater. They consider that real earnings management will influence firm’s future cash flow uncertainty and asset value distributions, and therefore will increase credit risk. Kim and Sohn (2013) also consider that real earnings management activities have an impact on the expected level of future cash flows, and therefore the market demands a higher risk premium for these activities. Thus, they observe the cost of capital is positively associated with the extent of real earnings management. Franz et al. (2014) study the impact of proximity to debt covenant violation on earnings management. They find that firms close to violation or technical default of their debt covenants engage in higher levels of real earnings management than far-from-violation firms. They also show that the result is stronger after the Sarbanes-Oxley Act, and
for firms with poor credit ratings. These different studies emphasize the potential effect of real earnings management on debt maturity.
1.2 The impact of creditor rights on the link between earnings management and debt maturity
Short-maturity debt allows lenders to review their lending decisions more frequently and to restrict borrower flexibility to increase the riskiness of assets (Bae and Goyal, 2009). Thus, creditors use short-term debt to monitor borrowers when accruals quality is low. Indeed, poor accruals quality increases information asymmetry and thereby the riskiness of assets. Creditors can also use short-term debt to monitor borrowers that engage in real earnings management activities. Indeed, real earnings management will influence firm’s uncertainty of future cash flows and asset value distributions, and therefore will increase credit risk (Chen et
al. 2015; Kim and Sohn 2013).
However, property rights protection affects a lender’s incentives to monitor and its ability to recontract (Bae and Goyal, 2009). For instance, Qian and Strahan (2007) and Bae and Goyal (2009) find that strong creditor protection improves borrowers' loan contract terms such as longer loan maturities. Therefore, we argue that in case of lower accounting quality through accruals manipulation, and higher credit risk through real earnings management, strong creditor protection will substitute to short-term debt to monitor borrowers. Indeed, in case of liquidation, creditors with strong protection are more likely to recover their claim compared to creditors with weak protection. This argument is consistent with previous studies. For example, Hong et al. (2016) find that accounting-based covenants are more prevalent in countries with stronger law enforcement and weaker creditor rights. The authors suggest that creditor rights substitute for the use of covenants. Christensen et al. (2016) in the same vein argue that debt contracts are designed to compensate for weaknesses in corporate laws. An et
al. (2016) also show that institutional environments influence the effect of earnings
management on financial leverage.
Therefore, the lenders response to a poor accounting quality or real earnings management activities such as short-term debt will be less important in countries with strong creditor protection. We expect that the impact of earnings management on debt maturity is lower in the countries with strong creditor rights. Accordingly, we state our hypothesis as follows:
Hypothesis: In the European context, the negative association between earnings
2
Data and methodology
2.1 Data
To investigate the link between earnings management and debt maturity, we collect our data from FACTSET database. We use a European sample of firms with STOXX Europe 600 Index spanning the years 2006 through 2014. The STOXX Europe 600 Index represents large, mid and small capitalization companies across 17 countries of the European region. The initial sample consists of 5400 firm-year observations representing 600 unique firms. Following prior studies on debt maturity, we exclude financial firms (1400) because they have a specific activity. That is, ICB codes between 8000 and 8999. We also eliminate firms that have missing or incomplete financial data (476). Our final sample consists of 3524 observations covering 17 European countries listed firms for the period 2006–2014.
We have between 374 and 404 observations between 2005 and 2014 with a small standard deviation at 10.57. United Kingdom, France and Germany number of firm-year observations accounts for more than half of our sample. The United Kingdom represents 1,138 observations (32.29% of our sample), France 614 observations (17.42% of our sample), and Germany 465 observations (13.20 % of our sample). Finally, 9 ICB sectors represent our sample. Industrials (1,010 observations, i.e., 28.66 % of our sample), Consumer Goods (571 observations, i.e., 16.20 % of our sample) and Consumer Services (622 observations, i.e., 17.65% of our sample) accounts for more than half of our sample. The sample distribution is presented in Table 1.
Table 1– Sample distribution
Panel A: Sample distribution by country
Country Observation % Belgium 81 2.30 Denmark 131 3.72 Finland 126 3.58 France 614 17.42 Germany 465 13.20 Greece 17 0.48 Ireland 56 1.59 Italy 143 4.06 Netherlands 205 5.82 Norway 79 2.24 Austria 27 0.77 Portugal 27 0.77 Spain 165 4.68 Sweden 250 7.09 United Kingdom 1,138 32.29 Total 3,524 100.00
Panel B: Sample distribution by year
year Observation % 2006 374 10.61 2007 379 10.75 2008 385 10.93 2009 389 11.04 2010 393 11.15 2011 400 11.35 2012 398 11.29 2013 402 11.41 2014 404 11.46 Total 3,524 100.00
Panel C: Sample distribution by ICB sector
Sector Observation %
ICB 0001 (Oil & Gas) 175 4.97
ICB 1000 (Basic Materials) 338 9.59
ICB 2000 (Industrials) 1,010 28.66
ICB 3000 (Consumer Goods) 571 16.20
ICB 4000 (Health Care) 277 7.86
ICB 5000 (Consumer Services) 622 17.65
ICB 6000
(Telecommunications) 166 4.71
ICB 7000 (Utilities) 216 6.13
Total 3,524 100.00
2.2 Variables measurement
2.2.1 Measuring debt maturity
Following prior research (Demirgurc-Kunt and Maksimovic 1999; García-Teruel et al. 2010; El Ghoul et al. 2016; Ben-Nasr et al. 2015), we measure debt maturity with the ratio of long-term debt maturing in more than one year to total debt. Long-long-term debt includes private and public financial debt. Total debt includes short and long-term financial debt.
2.2.2 Measures of earnings management
We adopt from the literature two model-estimated earnings management proxies: discretionary accruals and real earnings management activities. Discretionary accruals reflect a measure of earnings management by the choices and the implementing rules of the accounting method. We use two measures of discretionary accruals. The first measure (abs_J) is the one developed by Jones (1991) and modified by Dechow et al. (1995) (1). The second measure (abs_Kot) was developed by Kothari et al. (2005) (2). The two models are defined as follows: (1) (2)
Where, for fiscal year t and firm i,
TAi,t-1 = total assets from the preceding year
∆REVi,t = change in revenues from the preceding year
∆AR i,t = change in accounts receivable from the preceding year
PPE i,t = gross value of property, plant, and equipment
ROA i,t-1 = return on asset from the preceding year
Regarding real earnings management, we use Roychowdhury (2006) model. The author suggests that earnings management can take place through three real activities: sales (3), discretionary expenses (4) and production costs (5). First, managers can manipulate sales by offering price discounts or more lenient credit terms, consequently, temporarily increase sales volumes. The result of this manipulation is a lower cash flow from operations in the current period. Second, managers can also reduce discretionary expenditures such as research and development, and advertising. The reduction of discretionary expenses leads to increase earnings. Third, to manage earnings upward, managers can produce more goods than necessary. With higher production levels, the fixed costs per unit will be reducing and thereby increase earnings. The three models used are therefore the following:
(3) (4) (5)
Where, for fiscal year t and firm i, CFOi,t-1 = cash flow from operations
DXi,t = the discretionary expenditures, defined as the sum of advertising expenses, research
and development expenses and selling, general and administrative expenses
PROD i,t = the production costs, defined as the sum of cost of goods sold and the change in
inventories
TAi,t-1 = total assets
Si,t = the sales
∆S i,t = change in sales from the preceding year
ε i,t = the error term, is an estimate of abnormal level of cash flow from operations (CFO),
discretionary expenses (DX) and production (PROD)
The model coefficients are estimated for each of the nine sectors2, as presented in Table 1. We test our hypothesis using absolute values of both discretionary accruals and real earnings management. The absolute value of these measures allows capturing the level of earnings
management, whether upward or downward. The greater absolute value of these measures and the fewer is accounting quality.
2.2.3 Measuring creditor rights
We use the creditor rights index of Djankov et al. (2007), based on La Porta et al. (1998) creditor rights index in both reorganization and liquidation. The index consists of four indicators: no automatic stay on secured assets; secured creditors first paid; restrictions for going into reorganization; and, management does not stay. Each indicator takes a value of 1 or 0. Then, the scores are aggregated to create the creditor rights index ranging from 0 (poor creditor protection) to 4 (strong creditor protection).
2.2.4 Control variables
We control for firm characteristics that may affect the choice of the debt maturity structure according to debt maturity literature. To control for the effect of credit quality (Diamond 1991), we use the firm’s size measured as the logarithm of total asset (SIZE). To capture the nonlinear relation between credit quality and debt maturity predicted by Diamond (1991), we also include size square (SIZEsq).
Following Brockman et al. (2010) we control for financial strength by using Altman’s Z score dummy variable (Z). Altman Z score dummy variable takes a value of 1 if the result of Altman Z score is more than 1.81, and zero otherwise. Diamond (1991) also posits that firms with high leverage would face a higher liquidity risk. Therefore, these firms might prefer long-term debt. We control for Leverage (LEV) using the total debt divided by total assets. Myers (1977) suggests that the underinvestment problem can be eliminated by reducing debt maturity. Indeed, if debt matures before growth options expire, the underinvestment problem will be eliminated. Thus, ceteris paribus, firms with high growth opportunities prefer short term debt. Our measure of growth opportunities is the Market-to-Book ratio (MB). It is equal to the firm value divided by total assets. Myers (1977) also argues that firms with high asset maturities are expected to have larger proportions of long-term debt in their capital structure. Following Datta et al. (2005), we define Asset Maturity (AM) as the sum of proportion of gross property, plant and equipment assets to total assets multiplied by the ratio of gross property, plant and equipment assets to depreciation expenses and proportion of current assets to total assets multiplied by ratio of current assets to cost of goods sold.
Based on the signalling hypothesis, Flannery (1986) argues that high quality firms prefer to issue short-term debt. To proxy for quality firms, we use Abnormal Earnings (AE), defined as the ratio of change in operating income over the period [t, t + 1] to the market value of equity in year t.
Johnson (2003) argues that the probability of repaying debt decreases when firms have greater volatility of cash flows. Thus, firms with highly volatile cash flows might prefer long-term debt. Since greater volatility of cash flows may be associated with greater credit risk, we control for credit risk using the Standard Deviation of Return on Assets (stdROA) over the previous five years. Return on assets is calculated as the ratio of earnings before interest, taxes, depreciation, and amortization to total assets.
Prior literature documents a link between corporate governance and debt maturity (Datta et al. 2005; García-Teruel et al. 2010; Ben-Nasr et al. 2015). Therefore, we control for corporate governance using Datastream Corporate Governance Score (CG). This score measures a company's systems and processes, which ensure that its board members and executives act in the best interests of its long-term shareholders.
2.3 Model specification
Debt maturity and leverage are jointly determined because firms likely choose a level of debt and the maturity of that debt simultaneously (Johnson 2003). Thus, ordinary least squares estimation can lead to a biased leverage coefficient. Therefore, to test our hypotheses of a negative relation between earnings management and debt maturity, we estimate a system that models leverage and debt maturity as jointly endogenous. Following Brockman et al. (2010), we use a generalized method of moments (GMM) to estimate the coefficient of our equation system because GMM models improve upon other estimation methods including two-stage least squares (2SLS) and three stage least squares (3SLS) models (El Ghoul et al. 2016). Our two-equation system is specified as follows3:
ixed ffects (7)
where equation system (6) (7) tests our hypothesis. Dependent variable in the first equation is Leverage (LEV), measured by the total debt divided by total assets. Debt Maturity (DM) is the dependent variable in the second equation. The independent variables are the Logarithm of total assets (SIZE) and its square (SIZEsq); the Market to Book ratio (MB); the Fixed Assets Ratio (FAR), measured as the ratio of net property, plant, and equipment to total assets; the Profitability (PRO), measured as the ratio of earnings before interest, taxes, depreciation, and amortization to total assets; the Abnormal Earnings (AE), defined as the ratio of change in operating income over the period [t, t + 1] to the market value of equity in year t; the Asset Return standard deviation (stdROA) is the standard deviation of return on assets over the previous five years; the dummy variable (OL) take the value of 1 for firms with operating loss and 0 otherwise; Earnings Management (EM) represent one of our five measures of earnings management (t/t-1 in equation means that we use earnings management in year t and t-1); Datastream Corporate Governance score (CG) measures a company's systems and processes, which ensure that its board members and executives act in the best interests of its long term shareholders; Altman’s Z Score (Z) dummy variable takes a value of 1 if the result of Altman Z score is more than 1.81, and zero otherwise. The Asset Maturity (AM), measured as: (gross property, plant, and equipment /total assets) × (gross property, plant, and equipment /depreciation expense) + (current assets /total assets) × (current assets /cost of goods sold). Fixed Effects control for country, industry, and year fixed effects. All variables are summarized in the Appendix.
3
Results
3.1 Descriptive statistics and bivariate analysis
Table 2 (Panel A) show that the average long-term debt proportion in our sample is 75 percent. To test if there is significant difference between long-term debt proportion and creditor rights, we carried out a test of difference of means based on Student’s t. In general, we find that the mean of long-term debt proportion is highest when creditor protection is
strong. This is consistent with Qian and Strahan (2007) and Bae and Goyal (2009) studies. For example, panel B show that this average is 78 percent for United Kingdom firms (strong creditor rights) while for countries with weak creditor rights such as France, the average long-term debt proportion is 71 percent. Panel A shows that, on average, absolute value of discretionary accruals is 3 percent of total asset. The absolute value of real earnings management varies from real activities. It represents 4 percent of total asset for sales manipulation. For discretionary expenses and production costs, the absolute value of real earnings management is around 10 percent of total asset.
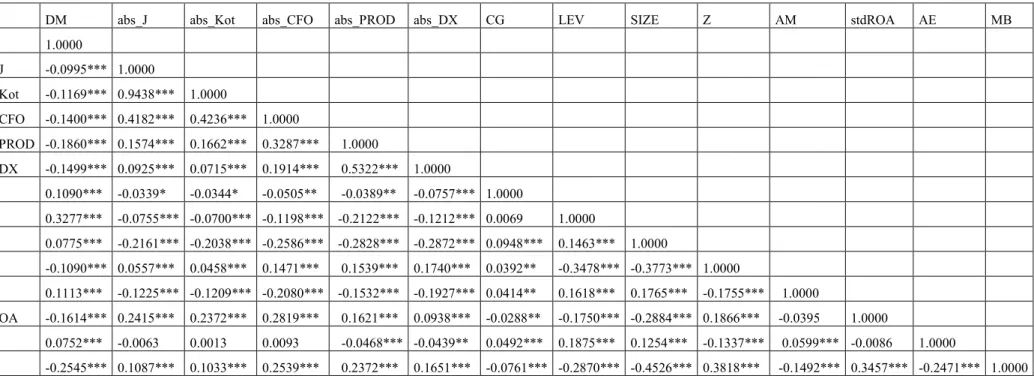
Regarding bivariate analysis, Table 3 reports the Pearson matrix correlation of the variables used in the multivariate analyses. The correlation between earnings management and debt maturity is negative and significant at the 1% level for our five measures of earnings management. In terms of control variables, Leverage, Asset Maturity, Abnormal Earnings, Size and Corporate Governance Score are positively and significantly correlated with debt maturity. While Altman’s Z Score dummy variable, Asset Return standard deviation and Market to Book ratio are negatively and significantly correlated with debt maturity. Table 2 presents the descriptive statistics and Table 3, Pearson matrix correlation of our variables.
Table 2 – Descriptive statistics
Panel A: Descriptive statistics of firm characteristics for the full sample
mean p50 max min sd p25 p75
abs_J 0.0354 0.0234 0.3822 0.0000 0.0410 0.0101 0.0447 abs_Kot 0.0354 0.0231 0.3711 0.0000 0.0410 0.0100 0.0448 abs_CFO 0.0485 0.0367 0.2964 0.0000 0.0446 0.0170 0.0655 abs_PROD 0.1165 0.0865 0.9215 0.0000 0.1122 0.0400 0.1542 abs_DX 0.1015 0.0699 0.9553 0.0000 0.1111 0.0299 0.1322 DM 0.7551 0.8305 1.0000 0.0000 0.2408 0.6772 0.9225 LEV 0.2648 0.2530 0.9853 0.0000 0.1561 0.1522 0.3627 CG 62.7228 68.9800 96.9300 1.9700 24.2812 45.7700 83.0300 SIZE 3.8321 3.7933 5.5699 1.5748 0.6371 3.3776 4.3071 Z 3.0160 2.4165 44.3683 -3.4267 2.7333 1.6561 3.4013 AM 9.8790 6.3140 66.9473 0.0458 10.0053 2.5912 13.8197 stdROA 0.0214 0.0152 0.3880 0.0000 0.0230 0.0088 0.0259 AE 0.1115 0.0937 2.8219 -0.7002 0.1130 0.0667 0.1317 MB 1.1405 0.8216 11.8404 0.0155 1.1115 0.5027 1.3603
Panel B: Descriptive statistics of creditor rights scores, earnings management measures, and long-term debt by country
Country Creditor rights DM abs_J abs_Kot abs_CFO abs_PROD abs_DX
United Kingdom 4 0.7826 0.0400 0.0398 0.0557 0.1533 0.1298 France 0 0.7172 0.0290 0.0289 0.0444 0.1063 0.1091 Germany 3 0.7322 0.0368 0.0380 0.0483 0.1136 0.0985 Belgium 2 0.8206 0.0288 0.0276 0.0424 0.0803 0.0879 Austria 3 0.7449 0.0268 0.0259 0.0287 0.0552 0.0484 Denmark 3 0.7164 0.0359 0.0362 0.0612 0.1157 0.1185 Finland 1 0.7053 0.0345 0.0355 0.0492 0.0758 0.0661 Ireland 1 0.9116 0.0308 0.0314 0.0802 0.1321 0.1521 Italy 2 0.7380 0.0304 0.0300 0.0393 0.0736 0.0752 Netherlands 3 0.7756 0.0371 0.0376 0.0423 0.0997 0.0835 Norway 2 0.7782 0.0486 0.0524 0.0544 0.1150 0.0449 Portugal 1 0.7497 0.0290 0.0278 0.0234 0.0621 0.0492 Spain 2 0.7291 0.0328 0.0332 0.0493 0.1000 0.0486 Sweden 1 0.7687 0.0369 0.0357 0.0587 0.1257 0.1017
t-test, United Kingdom versus France 0.7687*** 0.0369*** 0.0357*** 0.0587*** 0.1257*** 0.1017**
This table presents the descriptive statistics of our sample. The sample includes 3,524 observations between 2006 and 2014 collected from Factset. abs_J is the absolute value of discretionary accruals using the Jones (1991) model and modified by Dechow et al. (1995). abs_Kot is the absolute value of discretionary accruals using Kothari et al. (2005) model. abs_CFO, abs_PROD and abs_DX are respectively the absolute value of abnormal level of cash flow from operations, production costs and discretionary expenditures using Roychowdhury (2006) model. DM is the ratio of long-term debt maturing in more than one year to total debt. LEV is total debt divided by total assets. CG is Datastream Corporate Governance Score measures a company's systems and processes, which ensure that its board members and executives act in the best interests of its long-term shareholders. SIZE is the logarithm of total assets. Z is Altman’s Z score. AM is Asset Maturity equal: (gross property, plant, and equipment / total assets) × (gross property, plant, and equipment / depreciation expense) + (current assets / total assets) × (current assets / cost of goods sold). stdROA is the standard deviation of Return on Assets over the previous five years. AE is Abnormal Earnings measured as the ratio of change in operating income over the period [t, t + 1] to the market value of equity in year t. MB is the Market-to-Book ratio equal to the firm value divided by total assets. Creditor rights are the creditor rights protection index outlined in Djankov et al. (2007).
Table 3 –Pearson matrix correlation
DM abs_J abs_Kot abs_CFO abs_PROD abs_DX CG LEV SIZE Z AM stdROA AE MB DM 1.0000 abs_J -0.0995*** 1.0000 abs_Kot -0.1169*** 0.9438*** 1.0000 abs_CFO -0.1400*** 0.4182*** 0.4236*** 1.0000 abs_PROD -0.1860*** 0.1574*** 0.1662*** 0.3287*** 1.0000 abs_DX -0.1499*** 0.0925*** 0.0715*** 0.1914*** 0.5322*** 1.0000 CG 0.1090*** -0.0339* -0.0344* -0.0505** -0.0389** -0.0757*** 1.0000 LEV 0.3277*** -0.0755*** -0.0700*** -0.1198*** -0.2122*** -0.1212*** 0.0069 1.0000 Size 0.0775*** -0.2161*** -0.2038*** -0.2586*** -0.2828*** -0.2872*** 0.0948*** 0.1463*** 1.0000 Z -0.1090*** 0.0557*** 0.0458*** 0.1471*** 0.1539*** 0.1740*** 0.0392** -0.3478*** -0.3773*** 1.0000 AM 0.1113*** -0.1225*** -0.1209*** -0.2080*** -0.1532*** -0.1927*** 0.0414** 0.1618*** 0.1765*** -0.1755*** 1.0000 stdROA -0.1614*** 0.2415*** 0.2372*** 0.2819*** 0.1621*** 0.0938*** -0.0288** -0.1750*** -0.2884*** 0.1866*** -0.0395 1.0000 AE 0.0752*** -0.0063 0.0013 0.0093 -0.0468*** -0.0439** 0.0492*** 0.1875*** 0.1254*** -0.1337*** 0.0599*** -0.0086 1.0000 MB -0.2545*** 0.1087*** 0.1033*** 0.2539*** 0.2372*** 0.1651*** -0.0761*** -0.2870*** -0.4526*** 0.3818*** -0.1492*** 0.3457*** -0.2471*** 1.0000
This table provides the correlation matrix. abs_J is the absolute value of discretionary accruals using the Jones (1991) model and modified by Dechow et al. (1995). abs_Kot is the absolute value of discretionary accruals using Kothari et al. (2005) model. abs_CFO, abs_PROD and abs_DX are respectively the absolute value of abnormal level of cash flow from operations, production costs and discretionary expenditures using Roychowdhury (2006) model. DM is the ratio of long-term debt maturing in more than one year to total debt. LEV is total debt divided by total assets. CG is Datastream Corporate Governance Score that measures a company's systems and processes, which ensure that its board members and executives act in the best interests of its long-term shareholders. SIZE and SIZEsq are respectively the logarithm of total assets and its square. Z is Altman’s Z score dummy variable. It takes a value of 1 if the result of Altman Z score is more than 1.81, and zero otherwise. AM is Asset Maturity equal: (gross property, plant, and equipment / total assets) × (gross property, plant, and equipment / depreciation expense) + (current assets / total assets) × (current assets / cost of goods sold). stdROA is the standard deviation of Return on Assets over the previous five years. AE is Abnormal Earnings measured as the ratio of change in operating income over the period [t, t + 1] to the market value of equity in year t. MB is the Market-to-Book ratio equal to the firm value divided by total assets. ∗∗∗, ∗∗, and ∗ denote significance at the 1%, 5%, and 10% levels, respectively.
3.2 The relationship between earnings management and debt maturity
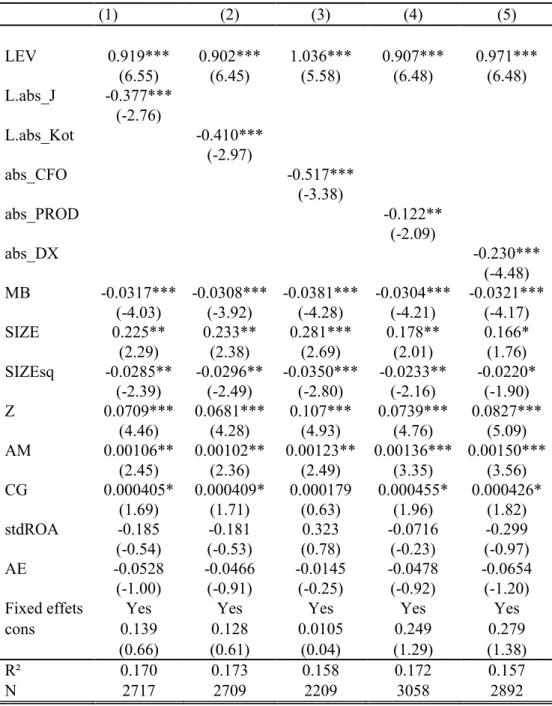
We present the results of the effect of earnings management on debt maturity structure in a multivariate analysis. Table 4 reports regressions from our model that estimates the debt maturity in the system of simultaneous equations as discussed above. We use the absolute value of each earnings management measures to capture the level of earnings management, whether upward or downward. We use the lagged accruals in our regressions to capture the impact of accruals management that only intervenes at the end of the period. We incorporate control variables that have been shown in previous studies to be important determinants of corporate debt maturity. All our regressions include country, industry, and year fixed effects. We find that the coefficients of earnings management are significantly negative across our five earnings management measures4. We obtain statistical significance at 1 % level for discretionary accruals models (abs_J and abs_Kot). We obtain also statistical significance at 5 % level for Roychowdhury (2006) production cost model (PROD), 1 % level for cash flow from operations (CFO) model, and statistical significance at 1 % level for discretionary expenses models (DX). The results are also economically significant. For instance, our result indicates that one standard deviation increase in earnings management, leads between to 1.5 % and 2.5 % decreases in long-term debt proportion to total debt5.
Hence, earnings management, both discretionary accruals and real earnings management, have a negative effect on long-term debt in firms’ debt maturity structure. This also involves the important role of financial reporting quality to obtain a better debt contracting term such as longer debt maturity. Our study extends previous research (García-Teruel et al. 2010; Bharath et al. 2008) by showing that real earnings management is also associated negatively with long-term debt. Our results suggest that creditor is able to detect real earnings management activities and penalize firms that engage in these activities.
Roychowdhury (2006) suggests that real activities manipulation can reduce firm long-term value because actions taken in the current period to increase earnings can have a negative effect on cash flows in future periods. Lenders estimate borrower’s future cash flows to assess their ability to repay. Consequently, by reducing firm value, real activities manipulation tends to decrease its credit quality and thereby impact negatively the debt maturity6. This result is consistent with Chen et al. (2015) and Kim and Sohn (2013) who document that real earnings management is associated with uncertainty about future cash flows and higher credit risk.
Even though earnings management by manipulation of accruals has no direct impact on cash flow (Roychowdhury 2006), the negative association between poor accruals quality and long-term debt reveals the ability of lenders to process and analyze accounting information potentially manipulated by discretionary accruals. Consequently, lenders compensate the risk of weakness in borrower’s financial reporting quality by short-term debt to monitor borrowers.
Most of the control variables are statistically significant. Consistent with the literature (Johnson 2003), Leverage (LEV) is positive and highly significant. The size variable (SIZE) and its square (SIZEsq) are positively and negatively related to the debt maturity. This is consistent with the non-linear relationship between debt maturity and credit quality predicted by Diamond (1991). The coefficient of Asset Maturity (AM) is positive and significant. Consistent with Myers’s (1977) argument, the coefficient of growth opportunity variable (MB) is negative. The coefficient of financial strength (Z) is positively related to the debt maturity. The coefficient of Corporate Governance score (CG) is positively but insignificant related to the debt maturity. We find that the coefficients of Abnormal Earnings (AE) and Asset Return standard deviation (stdROA) are generally insignificant. Datta et al. (2005) found similar results.
Table 4 – Long-term debt and earnings management (1) (2) (3) (4) (5) LEV 0.919*** 0.902*** 1.036*** 0.907*** 0.971*** (6.55) (6.45) (5.58) (6.48) (6.48) L.abs_J -0.377*** (-2.76) L.abs_Kot -0.410*** (-2.97) abs_CFO -0.517*** (-3.38) abs_PROD -0.122** (-2.09) abs_DX -0.230*** (-4.48) MB -0.0317*** -0.0308*** -0.0381*** -0.0304*** -0.0321*** (-4.03) (-3.92) (-4.28) (-4.21) (-4.17) SIZE 0.225** 0.233** 0.281*** 0.178** 0.166* (2.29) (2.38) (2.69) (2.01) (1.76) SIZEsq -0.0285** -0.0296** -0.0350*** -0.0233** -0.0220* (-2.39) (-2.49) (-2.80) (-2.16) (-1.90) Z 0.0709*** 0.0681*** 0.107*** 0.0739*** 0.0827*** (4.46) (4.28) (4.93) (4.76) (5.09) AM 0.00106** 0.00102** 0.00123** 0.00136*** 0.00150*** (2.45) (2.36) (2.49) (3.35) (3.56) CG 0.000405* 0.000409* 0.000179 0.000455* 0.000426* (1.69) (1.71) (0.63) (1.96) (1.82) stdROA -0.185 -0.181 0.323 -0.0716 -0.299 (-0.54) (-0.53) (0.78) (-0.23) (-0.97) AE -0.0528 -0.0466 -0.0145 -0.0478 -0.0654 (-1.00) (-0.91) (-0.25) (-0.92) (-1.20)
Fixed effets Yes Yes Yes Yes Yes
cons 0.139 0.128 0.0105 0.249 0.279
(0.66) (0.61) (0.04) (1.29) (1.38)
R² 0.170 0.173 0.158 0.172 0.157
N 2717 2709 2209 3058 2892
This table shows results for the two-equation system allowing joint determination of maturity and leverage based on GMM. The number of observations is based on available data for all variables. L.abs_J is the lagged absolute value of discretionary accruals using the Jones (1991) model and modified by Dechow et al. (1995). L.abs_Kot is thelagged absolute value of discretionary accruals using Kothari et al. (2005) model. abs_CFO, abs_PROD and abs_DX are respectively the absolute value of abnormal level of cash flow from operations, production costs and discretionary expenditures using Roychowdhury (2006) model. DM is the ratio of long-term debt maturing in more than one year to total debt. LEV is total debt divided by total assets. CG is Datastream Corporate Governance Score measures a company's systems and processes, which ensure that its board members and executives act in the best interests of its long-term shareholders. SIZE and SIZEsq are respectively the logarithm of total assets and its square. Z is Altman’s Z score dummy variable. It takes a value of 1 if the result of Altman Z score is more than 1.81, and zero otherwise. AM is Asset Maturity equal: (gross property, plant, and equipment / total assets) × (gross property, plant, and equipment / depreciation expense) + (current assets / total
assets) × (current assets / cost of goods sold). stdROA is the standard deviation of Return on Assets over the previous five years. AE is Abnormal Earnings measured as the ratio of change in operating income over the period [t, t + 1] to the market value of equity in year t. MB is the Market-to-Book ratio equal to the firm value divided by total assets. Fixed effects: All regressions include country, sector, and year fixed effects. ∗∗∗, ∗∗, and ∗ denote significance at the 1%, 5%, and 10% levels, respectively.
3.3 Do creditor rights impact the relation between earnings management and debt maturity?
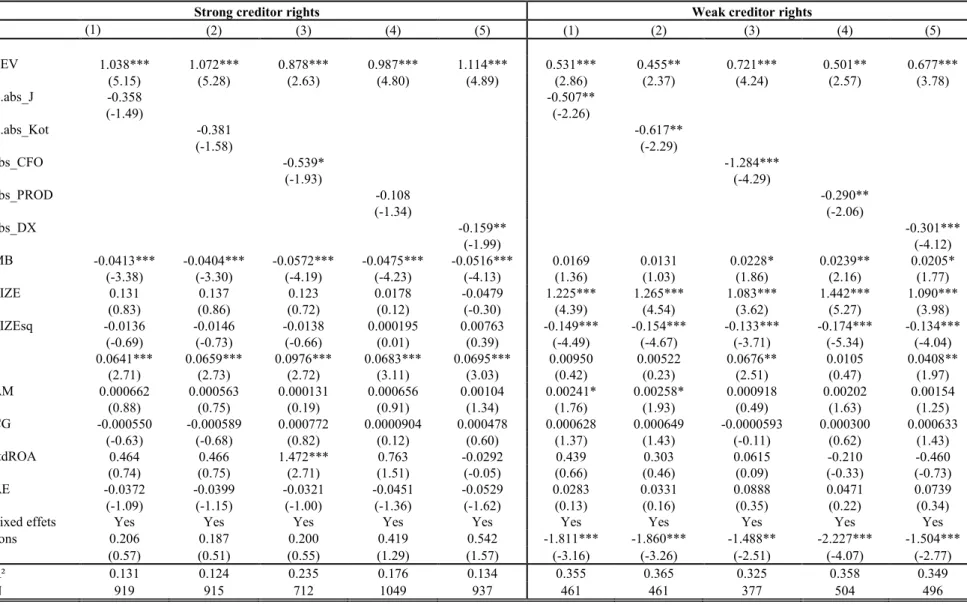
Table 5 reports the results of regression which examine whether the creditor rights influences the relation between earnings management and debt maturity. We argue that the negative association between earnings management and long-term debt holds only in countries with weak creditor rights. To capture this potential effect, we use the creditor rights index of Djankov et al. (2007), based on La Porta et al. (1998) creditor rights index in both reorganization and liquidation. We estimate our model for subsamples of strong creditor rights (score 4), weak creditor rights (score 0) and medium (score 1 to 3). This analysis contributes to prior research (Bharath et al. 2008; García-Teruel et al. 2010) by examining the impact of creditor protection on the relation between earnings management and debt maturity. We find that the coefficients of earnings management are significantly negative across our five earnings management measures in countries with weak creditor rights and not significant generally in countries with strong creditor rights. In countries with weak creditor rights, we obtain statistical significance at 5 % level for discretionary accruals models and 1 % level for real earnings management activities with cash flow from operations and discretionary expenditures model. Then, 5% level for production costs model. We also find that the coefficients of earnings management are significantly negative in countries with medium creditor rights. In general, we obtain statistical significance at 10 % level. However, this relationship is less significant than in countries with weak creditor rights. This implies that the impact of creditor protection on the relation between earnings management and debt maturity is more substantial when creditor rights are strong or weak.
The results are consistent with our hypothesis that the negative association between earnings management and long term debt holds only in countries with weak creditor rights. This implies that high creditor protection tends to attenuate the negative association between earnings management and long-term debt.
Our result suggests that better creditor protection tends to compensate the weakness of borrower’s accounting quality. Indeed, in event of default by borrower, the better creditor protection should allow their investments to be found more easily compared with countries
which provide more protection to debtors. Thus, high creditor protection provides a better confidence for lenders in firms financing.
Table 5 – Long-term debt, earnings management, and creditor rights
Strong creditor rights Weak creditor rights
(1) (2) (3) (4) (5) (1) (2) (3) (4) (5) LEV 1.038*** 1.072*** 0.878*** 0.987*** 1.114*** 0.531*** 0.455** 0.721*** 0.501** 0.677*** (5.15) (5.28) (2.63) (4.80) (4.89) (2.86) (2.37) (4.24) (2.57) (3.78) L.abs_J -0.358 -0.507** (-1.49) (-2.26) L.abs_Kot -0.381 -0.617** (-1.58) (-2.29) abs_CFO -0.539* -1.284*** (-1.93) (-4.29) abs_PROD -0.108 -0.290** (-1.34) (-2.06) abs_DX -0.159** -0.301*** (-1.99) (-4.12) MB -0.0413*** -0.0404*** -0.0572*** -0.0475*** -0.0516*** 0.0169 0.0131 0.0228* 0.0239** 0.0205* (-3.38) (-3.30) (-4.19) (-4.23) (-4.13) (1.36) (1.03) (1.86) (2.16) (1.77) SIZE 0.131 0.137 0.123 0.0178 -0.0479 1.225*** 1.265*** 1.083*** 1.442*** 1.090*** (0.83) (0.86) (0.72) (0.12) (-0.30) (4.39) (4.54) (3.62) (5.27) (3.98) SIZEsq -0.0136 -0.0146 -0.0138 0.000195 0.00763 -0.149*** -0.154*** -0.133*** -0.174*** -0.134*** (-0.69) (-0.73) (-0.66) (0.01) (0.39) (-4.49) (-4.67) (-3.71) (-5.34) (-4.04) Z 0.0641*** 0.0659*** 0.0976*** 0.0683*** 0.0695*** 0.00950 0.00522 0.0676** 0.0105 0.0408** (2.71) (2.73) (2.72) (3.11) (3.03) (0.42) (0.23) (2.51) (0.47) (1.97) AM 0.000662 0.000563 0.000131 0.000656 0.00104 0.00241* 0.00258* 0.000918 0.00202 0.00154 (0.88) (0.75) (0.19) (0.91) (1.34) (1.76) (1.93) (0.49) (1.63) (1.25) CG -0.000550 -0.000589 0.000772 0.0000904 0.000478 0.000628 0.000649 -0.0000593 0.000300 0.000633 (-0.63) (-0.68) (0.82) (0.12) (0.60) (1.37) (1.43) (-0.11) (0.62) (1.43) stdROA 0.464 0.466 1.472*** 0.763 -0.0292 0.439 0.303 0.0615 -0.210 -0.460 (0.74) (0.75) (2.71) (1.51) (-0.05) (0.66) (0.46) (0.09) (-0.33) (-0.73) AE -0.0372 -0.0399 -0.0321 -0.0451 -0.0529 0.0283 0.0331 0.0888 0.0471 0.0739 (-1.09) (-1.15) (-1.00) (-1.36) (-1.62) (0.13) (0.16) (0.35) (0.22) (0.34)
Fixed effets Yes Yes Yes Yes Yes Yes Yes Yes Yes Yes
cons 0.206 0.187 0.200 0.419 0.542 -1.811*** -1.860*** -1.488** -2.227*** -1.504*** (0.57) (0.51) (0.55) (1.29) (1.57) (-3.16) (-3.26) (-2.51) (-4.07) (-2.77) R² 0.131 0.124 0.235 0.176 0.134 0.355 0.365 0.325 0.358 0.349
Table 5 (continued)
Medium creditor rights
(1) (2) (3) (4) (5) LEV 0.842*** 0.844*** 0.820*** 0.786*** 0.787*** (5.44) (5.44) (3.95) (5.30) (4.96) L.abs_J -0.280* (-1.73) L.abs_Kot -0.313** (-2.00) abs_CFO -0.295* (-1.75) abs_PROD -0.126* (-1.95) abs_DX -0.241*** (-3.68) MB -0.0452*** -0.0435*** -0.0602*** -0.0442*** -0.0478*** (-5.32) (-5.10) (-6.72) (-5.65) (-5.80) SIZE 0.160 0.169 0.201* 0.104 0.101 (1.50) (1.58) (1.75) (1.08) (1.01) SIZEsq -0.0205 -0.0217* -0.0251* -0.0143 -0.0143 (-1.58) (-1.67) (-1.83) (-1.22) (-1.15) Z 0.0761*** 0.0752*** 0.0933*** 0.0753*** 0.0768*** (4.00) (3.93) (3.60) (4.20) (4.12) AM 0.00111** 0.00106** 0.00149*** 0.00145*** 0.00171*** (2.35) (2.25) (2.75) (3.30) (3.77) CG 0.000129 0.000114 0.0000610 0.000208 0.000174 (0.43) (0.38) (0.18) (0.74) (0.61) stdROA -0.170 -0.145 0.225 -0.0234 -0.291 (-0.45) (-0.38) (0.51) (-0.07) (-0.86) AE -0.0351 -0.0282 -0.00148 -0.0188 -0.0356 (-1.05) (-0.86) (-0.04) (-0.51) (-1.07)
Fixed effets Yes Yes Yes Yes Yes
cons 0.288 0.270 0.239 0.435** 0.470**
(1.23) (1.15) (0.92) (2.04) (2.13)
R² 0.170 0.169 0.221 0.187 0.191
N 1337 1333 1120 1505 1459
Table 5 shows results for the two-equation system allowing joint determination of maturity and leverage based on GMM. The number of observations is based on available data for all variables. L.abs_J is the lagged absolute value of discretionary accruals using the Jones (1991) model and modified by Dechow et al. (1995). L.abs_Kot is thelagged absolute value of discretionary accruals using Kothari et al. (2005) model. abs_CFO, abs_PROD and abs_DX are respectively the absolute value of abnormal level of cash flow from operations, production costs and discretionary expenditures using Roychowdhury (2006) model. DM is the ratio of long-term debt maturing in more than one year to total debt. LEV is total debt divided by total assets. CG is Datastream Corporate Governance Score measures a company's systems and processes, which ensure that its board members and executives act in the best interests of its long-term shareholders. SIZE and SIZEsq are respectively the logarithm of total assets and its square. Z is Altman’s Z score dummy variable. It takes a value of 1 if the result of Altman Z score is more than 1.81, and zero otherwise. AM is Asset Maturity equal: (gross property, plant, and equipment / total assets) × (gross property, plant, and equipment / depreciation expense) + (current assets / total assets) × (current assets / cost of goods sold). stdROA is the standard deviation of Return on Assets over the previous five years. AE is Abnormal Earnings measured as the ratio of change in operating income over the
period [t, t + 1] to the market value of equity in year t. MB is the Market-to-Book ratio equal to the firm value divided by total assets. Fixed effects: All regressions include sector and year fixed effects. ∗∗∗, ∗∗, and ∗ denote significance at the 1%, 5%, and 10% levels, respectively.
3.4 Additional test
We conduct an additional test to analyse the link between earnings management and debt maturity using the signed measures of earnings management. The signed measures of earnings management allow capturing the level of earnings management upward or downward.
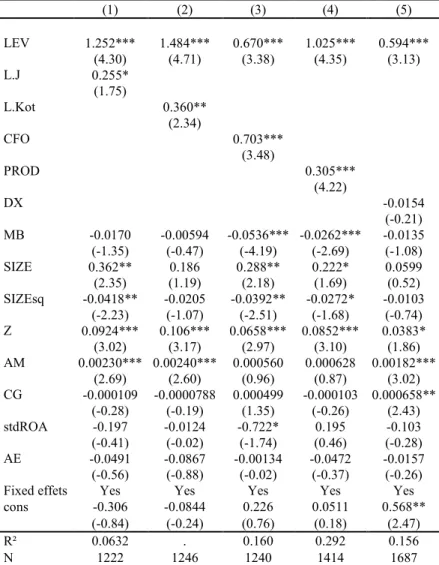
Table 6 and table 7 report regressions from our model that estimates the debt maturity in the system of simultaneous equations as discussed above. We use in table 6, the negative value of each earnings management measures to capture the level of earnings management downward. In table 7, we use the positive value of each earnings management measures to capture the level of earnings management upward. We also use the lagged accruals in our regressions to capture the impact of accruals management that only intervenes at the end of the period. We incorporate control variables that have been shown in previous studies to be important determinants of corporate debt maturity. All our regressions include country, industry, and year fixed effects.
The results show that for negative value of each earnings management measures, the coefficients of earnings management measures are positive and significant without discretionary expenditures model (table 6).
The negative value of earnings management measures by cash flow from operations (CFO) reveals upward earnings management because sales manipulation is associated with lower cash flow in the current period. We observe that earnings management through sales is positively linked to debt maturity. This result suggests that creditors will consider sales manipulation have a negative impact on cash flow.
The negative value of accruals quality (Jones 1991; Kothari 2005) and earnings management-using overproduction (PROD), reveals downward earnings management. We observe that downward earnings management is negatively linked to debt maturity. Creditors can consider that downward earnings management reveals uncertainty about future cash flows. Thus, this will impact debt maturity.
For the positive value of each earnings management measures, the coefficients are not significant without cash flow from operations model (table7). The positive value of earnings management measures by cash flow from operations (CFO) reveals downward earnings
management. This result suggest that downward earnings management is negatively linked to debt maturity.
In general, the analysis of the unsigned measure of earnings management show that downward earnings management is negatively associated with debt maturity. This result holds for four of our five measures of earnings management. The association between upward earnings management and debt maturity is only observed for the sales manipulation measure. The downward earnings management may reveal the firm's difficulties as reflected in the recording of impairments or provisions. Conversely, the upward earnings management through the accruals has no direct impact on cash flow and would thus have less consequence from the creditors' perspective. However, creditors could penalize the upward earnings management through sales manipulation if this is done at the expense of cash flows.
Table 6 – Long-term debt and earnings management, using the negative value of earnings management measures
(1) (2) (3) (4) (5) LEV 1.252*** 1.484*** 0.670*** 1.025*** 0.594*** (4.30) (4.71) (3.38) (4.35) (3.13) L.J 0.255* (1.75) L.Kot 0.360** (2.34) CFO 0.703*** (3.48) PROD 0.305*** (4.22) DX -0.0154 (-0.21) MB -0.0170 -0.00594 -0.0536*** -0.0262*** -0.0135 (-1.35) (-0.47) (-4.19) (-2.69) (-1.08) SIZE 0.362** 0.186 0.288** 0.222* 0.0599 (2.35) (1.19) (2.18) (1.69) (0.52) SIZEsq -0.0418** -0.0205 -0.0392** -0.0272* -0.0103 (-2.23) (-1.07) (-2.51) (-1.68) (-0.74) Z 0.0924*** 0.106*** 0.0658*** 0.0852*** 0.0383* (3.02) (3.17) (2.97) (3.10) (1.86) AM 0.00230*** 0.00240*** 0.000560 0.000628 0.00182*** (2.69) (2.60) (0.96) (0.87) (3.02) CG -0.000109 -0.0000788 0.000499 -0.000103 0.000658** (-0.28) (-0.19) (1.35) (-0.26) (2.43) stdROA -0.197 -0.0124 -0.722* 0.195 -0.103 (-0.41) (-0.02) (-1.74) (0.46) (-0.28) AE -0.0491 -0.0867 -0.00134 -0.0472 -0.0157 (-0.56) (-0.88) (-0.02) (-0.37) (-0.26) Fixed effets Yes Yes Yes Yes Yes cons -0.306 -0.0844 0.226 0.0511 0.568** (-0.84) (-0.24) (0.76) (0.18) (2.47) R² 0.0632 . 0.160 0.292 0.156 N 1222 1246 1240 1414 1687
L.J is the lagged negative value of discretionary accruals using the Jones (1991) model and modified by Dechow et al. (1995). L.Kot is the lagged negative value of discretionary accruals using Kothari et al. (2005) model.CFO, PROD and DX are respectively the negative value of abnormal level of cash flow from operations, production costs and discretionary expenditures using Roychowdhury (2006) model. DM is the ratio of long-term debt maturing in more than one year to total debt. LEV is total debt divided by total assets. CG is Datastream Corporate Governance Score measures a company's systems and processes, which ensure that its board members and executives act in the best interests of its long-term shareholders. SIZE and SIZEsq are respectively the logarithm of total assets and its square. Z is Altman’s Z score dummy variable. It takes a value of 1 if the result of Altman Z score is more than 1.81, and zero otherwise. AM is Asset Maturity equal: (gross property, plant, and equipment / total assets) × (gross property, plant, and equipment / depreciation expense) + (current assets / total assets) × (current assets / cost of goods sold). stdROA is the standard deviation of Return on Assets over the previous five years. AE is Abnormal Earnings measured as the ratio of change in operating income over the period [t, t + 1] to the market value of equity in year t. MB is the Market-to-Book ratio equal to the firm value divided by total assets. Fixed effects: All regressions include country, sector, and year fixed effects. ∗∗∗, ∗∗, and ∗ denote significance at the 1%, 5%, and 10% levels, respectively.
Table 7 – Long-term debt and earnings management, using the positive value of earnings management measures
(1) (2) (3) (4) (5) LEV 0.661*** 0.542*** 1.687*** 0.794*** 1.238*** (3.78) (3.24) (3.34) (4.72) (5.63) L.J 0.135 (0.81) L.Kot 0.122 (0.74) CFO -0.320* (-1.79) PROD 0.111 (1.57) DX -0.0406 (-0.53) MB -0.0390*** -0.0398*** -0.0277 0.0149 -0.0242** (-3.64) (-3.54) (-1.56) (1.23) (-1.98) SIZE 0.165 0.329*** 0.0228 0.347*** 0.336** (1.34) (2.68) (0.11) (3.02) (2.10) SIZEsq -0.0236 -0.0435*** -0.000783 -0.0437*** -0.0376* (-1.58) (-2.92) (-0.03) (-3.19) (-1.90) Z 0.0552*** 0.0473** 0.230*** 0.0363** 0.0898*** (2.72) (2.40) (3.09) (2.07) (3.73) AM 0.000530 0.000461 0.00328*** 0.00229*** 0.00129* (0.95) (0.85) (3.14) (4.25) (1.94) CG 0.000904*** 0.000956*** -0.000178 0.000692** -0.000147 (2.90) (3.02) (-0.35) (2.44) (-0.36) stdROA 0.0497 -0.124 1.773*** -0.247 -0.984** (0.09) (-0.23) (2.77) (-0.50) (-2.25) AE -0.0690 -0.0623 -0.297* -0.0177 -0.139 (-1.03) (-0.95) (-1.81) (-0.31) (-1.28) Fixed effets Yes Yes Yes Yes Yes cons 0.311 0.0259 0.0817 -0.0631 -0.194 (1.26) (0.10) (0.19) (-0.25) (-0.57) R² 0.220 0.211 0.105 0.119 0.242
N 1500 1465 984 1649 1209
L.J is the lagged the positive value of discretionary accruals using the Jones (1991) model and modified by Dechow et al. (1995). L.Kot is the lagged positive value of discretionary accruals using Kothari et al. (2005) model.CFO, PROD and DX are respectively thepositive value of abnormal level of cash flow from operations, production costs and discretionary expenditures using Roychowdhury (2006) model. DM is the ratio of long-term debt maturing in more than one year to total debt. LEV is total debt divided by total assets. CG is Datastream Corporate Governance Score measures a company's systems and processes, which ensure that its board members and executives act in the best interests of its long-term shareholders. SIZE and SIZEsq are respectively the logarithm of total assets and its square. Z is Altman’s Z score dummy variable. It takes a value of 1 if the result of Altman Z score is more than 1.81, and zero otherwise. AM is Asset Maturity equal: (gross property, plant, and equipment / total assets) × (gross property, plant, and equipment / depreciation expense) + (current assets / total assets) × (current assets / cost of goods sold). stdROA is the standard deviation of Return on Assets over the previous five years. AE is Abnormal Earnings measured as the ratio of change in operating income over the period [t, t + 1] to the market value of equity in year t. MB is the Market-to-Book ratio equal to the firm value divided by total assets. Fixed effects: All regressions include country, sector, and year fixed
CONCLUSION
This paper examines whether creditor rights influence the effect of earnings management on debt maturity. For this purpose, we use a European sample of firms representing 17 countries, with STOXX Europe 600 Index spanning the years 2006 through 2014. We measure earnings management with the model developed by Jones (1991) and modified by Dechow et al. (1995), the model developed by Kothari et al. (2005), and real earnings management by Roychowdhury (2006) model.
We find that earnings management, both discretionary accruals and real earnings management, is associated with less long-term debt consistent with Bharath et al. (2008) and Garcia-Teruel et al. (2010) studies. We also show that the negative relation between earnings management and long-term debt depends on the level of creditor rights. The association between earnings management and debt maturity is more prevalent in countries with weak creditor protection.
This paper adds to the literature by providing interesting evidence on the role of earnings management on debt maturity. The evidence suggests that less earnings management can contribute to obtain better debt contracting terms such as longer debt maturity, although the impact is attenuated by a better creditor protection. This finding suggests that high creditor protection tends to compensate the weakness of borrower’s financial information. Thus, high creditor protection provides a better confidence for lenders in firms financing.
Our study adds also to the literature on the link between earnings management and debt maturity by showing that real earnings management activities are associated with less long-term debt. This suggests that creditors are able to detect real earnings management activities and penalize firms that engage in these activities. Indeed, these activities might lead to greater uncertainty about future cash flow.
Using a U.S sample, Bharath et al. (2008) examine how accounting quality, measured by accruals quality, affects the borrower’s choice of private debt (bank loans) compared with public debt market (bonds). Their results show that borrowers with poorer accounting quality are more likely to choose private debt. They suggest that banks having superior information access and processing abilities that reduce adverse selection costs for borrowers with poorer accounting quality. In this way, for future research, it could be interesting to distinguish private debt and public debt to investigate the effect of earnings management on debt maturity. Earnings smoothing is a type of earnings management (reducing the earnings
variance). In our research we focus on the level of earnings management whatever the motivation of this reduction. Then, earnings smoothing takes place over several periods. Therefore, it could be also interesting to investigate whether earnings smoothing affects debt maturity.
Appendix : Definition of Variables
Dependent variable
Debt Maturity (DM) ratio of long-term debt maturing in more than one year to total debt Independent variables
abs_J absolute value of discretionary accruals using the Jones (1991) model and modified by Dechow et al. (1995) abs_Kot absolute value of discretionary accruals using Kothari et al. (2005) model
abs_CFO absolute value of abnormal level of cash flow from operations using Roychowdhury (2006) model abs_PROD
abs_DX
Creditor rights
absolute value of abnormal level of production costs using Roychowdhury (2006) model
absolute value of abnormal level of discretionary expenditures using Roychowdhury (2006) model
An index aggregating four powers of secured lenders in bankruptcy, following Djankov et al. (2007). No automatic stay on secured assets; secured creditors first paid; restrictions for going into reorganization; and, management does not stay. The index ranges from 0 (weak) to 4 (strong creditor rights)
Control variables LEV total debt divided by total assets
CG
Datastream Corporate Governance Score measures a company's systems and processes, which ensure that its board members and executives act in the best interests of its long term shareholders.
SIZE logarithm of total assets SIZEsq logarithm of total assets square
Z
Altman’s Z Score calculated as Z = 1.2 (X1) + 1.4 (X2) + 3.3 (X3) + 0.6 (X4) + 1.0 (X5). Where X1 = working capital/total assets, X2 = retained earnings/total assets, X3 = earnings before interest and taxes/total assets, X4 = Market Value Equity /book value of total liabilities, X5= (Sales /Total Assets).
MB Market-to-Book ratio equal to the firm value divided by total assets
AM
Asset Maturity equal: (gross property, plant, and equipment / total assets) × (gross property, plant, and equipment / depreciation expense) + (current assets / total assets) × (current assets / cost of goods sold).
AE
Abnormal Earnings measured as the ratio of change in operating income over the period [t, t + 1] to the market value of equity in year t
REFERENCES
Ahmed, A. S., Billings, B. K., Morton, R. M., Stanford-Harris, M. (2002). The Role of Accounting Conservatism in Mitigating Bondholder-Shareholder Conflicts over Dividend Policy and in Reducing Debt Costs. The Accounting Review, 77(4): 867-890. An, Z., Li, D., Yu, J. (2016). Earnings management, capital structure, and the role of
institutional environments. Journal of Banking & Finance, 68: 131-152.
Bae, K.-H., Goyal, V.K., (2009). Creditor rights, enforcement and bank loans. The Journal of
Finance, 64 (2): 823-860.
Ben-Nasr, H., Boubaker, S., Rouatbi, W. (2015). Ownership structure, control contestability, and corporate debt maturity. Journal of Corporate Finance, (35): 265-285.
Bharath, S. T., Sunder, J., Sunder, S. V. (2008). Accounting Quality and Debt Contracting.
Accounting Review, 83(1): 1-28.
Bhattacharya, U., Daouk, H., Welker, M. (2003). The World Price of Earnings Opacity. The
Accounting Review, 78(3): 641-678.
Brockman, P., Martin, X., Unlu, E. (2010). Executive Compensation and the Maturity Structure of Corporate Debt. Journal of Finance, 65(3): 1123-1161.
Chen, T.-K., Tseng, Y., & Hsieh, Y.-T. (2015). Real Earnings Management Uncertainty and Corporate Credit Risk. European Accounting Review, 24(3): 413-440.
Christensen, H. B., Nikolaev, V. V., Wittenberg-Moerman, R. (2016). Accounting Information in Financial Contracting: The Incomplete Contract Theory Perspective.
Journal of Accounting Research, 54(2): 397-435.
Costello, A. M., Wittenberg-Moerman, R. (2011). The Impact of Financial Reporting Quality on Debt Contracting: Evidence from Internal Control Weakness Reports. Journal of
Accounting Research, 49(1): 97-136.
Datta, S., Iskandar-Datta, M. A. I., Raman, K. (2005). Managerial Stock Ownership and the Maturity Structure of Corporate Debt. Journal of Finance, 60(5): 2333-2350.
Dechow, P. M., Sloan, R. G., Sweeney, A. P. (1995). Detecting Earnings Management. The
Accounting Review, 70(2): 193-225.
Demirgüç-Kunt, A., Maksimovic, V. (1999). Institutions, financial markets, and firm debt maturity. Journal of Financial Economics, 54(3): 295-336.
Diamond, D. W. (1991). Debt Maturity Structure and Liquidity Risk. The Quarterly Journal
of Economics, 106(3): 709-737.
Djankov, S., C. McLiesh, Shleifer, A. (2007). Private credit in 129 countries. Journal of
Financial Economics, 84(2): 299-329.
Easley, D., Hvidkjaer, S., O'Hara, M. (2002). Is Information Risk a Determinant of Asset Returns? The Journal of Finance, 57(5): 2185-2221.
Easley, D., O'hara, M. (2004). Information and the Cost of Capital. The Journal of Finance, 59(4): 1540-6261.