Density Limit and Cross-Field Edge Transport Scaling
in Alcator C-Mod
B. LaBombard 1), M. Greenwald 1), R.L. Boivin 2), B..A. Carreras 3), J.W. Hughes 1), B. Lipschultz 1), D. Mossessian 1), C.S. Pitcher 4), J.L. Terry 1), S.J. Zweben 5), and Alcator C-Mod Research Team
1) M.I.T. Plasma Science and Fusion Center, 175 Albany St., Cambridge, MA 02139 USA 2) General Atomics, San Diego, CA, USA
3) Oak Ridge National Laboratory, Oak Ridge, TN, USA
4) Institute for Aerospace Studies, University of Toronto, Toronto, Canada. 5) Princeton Plasma Physics Laboratory, Princeton, NJ, USA
e-mail contact of main author: [email protected]
Abstract: Recent experiments in Alcator C-Mod have uncovered a direct link between the character and scaling
of cross-field particle transport in the edge plasma and the density limit, nG. As ne/nG is increased from low
values to values approaching ~1, an ordered progression in the cross-field edge transport physics occurs: first benign cross-field heat convection, then cross-field heat convection impacting the scrape-off layer (SOL) power loss channels and reducing the separatrix electron temperature, and finally ‘bursty’ transport (normally associated with the far SOL) invading into closed flux surface regions and carrying a convective power loss that impacts the power balance of the discharge. These observations suggest that SOL transport and its scaling with plasma conditions plays a key role in setting the empirically observed density limit scaling law.
1. Introduction
The Greenwald empirical scaling law does well to predict the maximum plasma density that can be achieved in a tokamak (
n
G) over a wide range of operational parameters [1]. Although it is well accepted that the final collapse of the plasma ultimately involves a thermal instability followed by an MHD disruption [2], the underlying physics that causes the onset of this condition to precisely track the empirical law is a puzzle that is yet to be resolved [3]. This fundamental deficiency in understanding impacts fusion reactor design; extrapolation into untested regimes is uncertain.Experiments in Alcator C-Mod indicate that the level of plasma transport across the separatrix and into the scrape-of layer (SOL) is tightly linked to the edge plasma parallel collisionality which is in turn correlated with the normalized discharge density, ne
/
n
G. As the edge plasma becomes more collisional (n
e/
n
G increased), cross-field particle fluxes and associated heat convection dramatically increase. The character of SOL profiles and fluctuations change as well, suggesting that a number of important edge plasma phenomena are interrelated and connected to the density limit scaling: a two-zone SOL structure, non-diffusive (‘bursty’) transport, high level of plasma recycling on the main-chamber walls, and the onset of divertor detachment. In this paper, we review these observations made in Alcator C-Mod, paying specific attention to the way in which the edge plasma state evolves with increasingn
e/
n
G.2. Scrape-Off Layer Profiles and Fluctuations
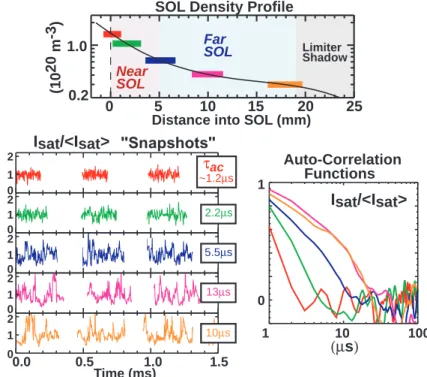
Figure 1 shows the cross-section of a typical ohmic-heated plasma equilibrium and locations of a number of key diagnostics used for these studies. Further details can be found in Ref. [4]. In low to moderate density discharges relative to
n
G, the scrape-off layer (SOL) is found to exhibit a two-layer structure [4]: a near SOL (~5 mm zone) with steep density and temperature gradients and a far SOL with flatter profiles (see top panel of Fig. 2). In the near SOL region, the normalized fluctuation amplitude is the lowest and the data exhibit a steady stream of apparently random fluctuations (see normalized ion saturation current time series data in Fig. 2). At the location where the density gradient noticeably flattens (distance into SOL,ρ,
~ 5 mm) the fluctuations also change. From this location outward the data exhibit lower-frequency, higher-amplitude fluctuations with intermittent, long-lived ‘bursts’ of ion saturation current arriving at the probe. The auto-correlation functions of Isat/<Isat> taken at different locations in the SOL reflect the longer-lasting duration and increasing contribution of the ‘bursts’ to the signal; the auto-correlation times systematically increase with distance into the SOL.A fast photo-diode array viewing a localized gas puff on the outside midplane provides an independent characterization of the edge turbulence in Alcator C-Mod [5]. The probability distribution functions (PDFs) of local visible light emission are found to be markedly different in the near and far SOL zones (see Fig.3). While the near SOL zone exhibits a near-gaussian
FIG. 1 - Alcator C-Mod Cross-section showing typical plasma equilibrium and key diagnostics.
Turbulence Imaging Fast Photo-Diode Array Horizontal Scanning Probe Edge Thomson Scattering α Viewing Tangential-Ly Array Scanning Probe Langmuir Mach Limiter-Shadow Particle Flux Probe
FIG. 2 - Top panel: Density from horizontal scanning probe. Bottom panels: snapshots of Isat/<Isat> at different locations. Auto-correlation functions are shown at right. 0.0 0.5 Time (milliseconds) 1.0 1.5 0 1 2 0.0 0.5 Time (milliseconds) 1.0 1.5 0 1 2 0.0 0.5 Time (milliseconds) 1.0 1.5 0 1 2
Isat/<Isat>
0.0 0.5 Time (milliseconds) 1.0 1.5 0 1 2 0.0 0.5 1.0 1.5 0 1 2 "Snapshots" Time (ms) τac ~1.2µs 5.5µs 13µs 10µs 2.2µs Near SOL Far SOL 25 0 5 10 15 20 1.0 0.2 (10 20 m -3)
Distance into SOL (mm) Limiter Shadow SOL Density Profile
1 10 100 (µs) 0 1 Auto-Correlation Functions
PDF, the far SOL zone is characterized by a highly skewed distribution, favoring an enhanced probability of large positive-amplitude events.
Statistical analysis of fluctuation-induced particle fluxes inferred from the horizontal scanning probe in the far SOL suggests a ‘non-diffusive’ component, similar to results obtain from the edge plasma of many other fusion experiments [6]. As shown in Fig. 3, the PDF of the fluxes exhibits a non-exponential tail for positive-flux transport events; events with greater than 4.6 times the mean flux account for 50% of the total particle transport; these events happen ~5% of the time. Although the particle flux across the SOL is found to increase sharply with increasing plasma density (see section 4), this statistical behavior in the far SOL persists over a wide range of plasma densities and is reminiscent of the behavior seen in self-organized transport systems.
3. Far SOL Transport and Main-Chamber Recycling
Associated with the bursty, non-diffusive transport character of the far SOL is a large level of cross-field particle flux. Analysis of global particle balance in Alcator C-Mod discharges clearly shows that a large fraction of the efflux from the main-chamber plasma (core plasma plus SOL) arrives onto the main-chamber walls (limiters and divertor baffle plates) via a rapid cross-field transport mechanism [7]. The total particle flow along field lines into the divertor volume is weaker in comparison. This observation has important implications for divertor design; cross-field transport physics rather than divertor geometry can be more important in setting the midplane neutral pressure [8]. Effective cross-field particle diffusivities (Deff) are seen to FIG. 3 - Probability distribution functions are shown in bottom set of panels. Left: Dα light fluctuation amplitude in the Near and Far SOL regions. Right: fluctuation-induced cross-field particle flux (from horizontal scanning probe) in Far SOL region, colored according to line-averaged density (1020 m-3). Far SOL 25 0 5 10 15 20 1.0 0.2 (10 20 m -3) Limiter Shadow
SOL Density Profile Near
SOL
-11 10 100
Light Signal (a.u.) skewness = 1.0 kurtosis = 1.1 0 1 2 3 skewness = 0.5 kurtosis = 0.5 1 10 100 Fast-Diode Signals Probability Gaussian ρ = 3 mm ρ = 9 mm 10 -4 10-2 100 -10 0 10 30 Probability * <Flux> Flux/<Flux> 1.8 1.6 1.45 1.3 0.87 ne: Fluctuation-Induced Fluxes (Γ⊥) 50 ρ= 7 mm
increase by a factor of 10 or more with distance from the separatrix, maintaining a relatively flat cross-field flux profile. In the far SOL, the value of Deff is often ill-defined (a large particle flux is driven by a near-zero density gradient), suggesting that a non-diffusive transport mechanism is at work there.
Fast photo-diode measurements and high-resolution 2-D spatial imaging of turbulence in the SOL [9] have captured underlying dynamics of a rapid transport mechanism. Visible light emission from photo-diodes viewing 3 spatial locations in the far SOL separated by 3.4 mm indicate that ‘bursts’ in visible light emission have radial correlation lengths of ~7 mm and radial phase velocities in the range of 102 to 103 m s-1. Most recently, turbulence imaging
‘movies’ obtained with an advanced CCD camera system viewing along magnetic field lines (24 consecutive frames of 4 µs exposure) clearly record ~1 cm scale ‘blobs’ of emission traveling towards the wall with velocities of up to 500 m s-1 [10]. These structures appear to ‘peel away’ from the steep-gradient, near SOL region and freely propagate to the wall. The latter observation suggests that the level of cross-field particle transport is set by conditions in the near SOL.
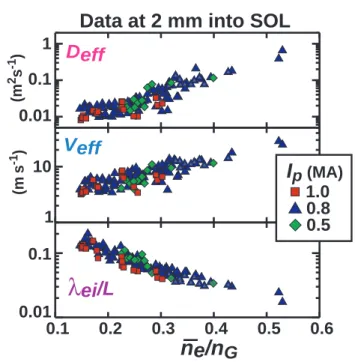
4. Scaling of Cross-field Particle Transport in the Near SOL
Simultaneous measurements of plasma flows toward the divertor (via vertical-scanning Mach-probe) and ionization profiles (via Lyα array) enable profiles of effective plasma diffusivity, Deff, to be directly inferred by a method discussed in Ref.[8]. This allows relative variations in transport to be tracked as a function of plasma conditions. Results from a regression analysis of Deff values in the near SOL region are shown in Fig. 4. The analysis includes a wide range of standard ohmic-heated discharges: 0.5 < Ip < 1.0 MA, 4 < BT < 6 tesla, 0.8x10²⁰ <
n
e< 3x10²⁰m-3, yielding 127 data points with normalized density range, 0.15 <
n
e/
n
G < 0.53. Deff is shown correlated against 2 different sets of regressors: (a) Te and n atρ
= 2 mm, Ip, and BT,and (b)
λ
ei/L atρ
= 2 mm. (Here,λ
ei is the electron-ion mean-free path and L is the local magnetic field line length in the SOL.) The regression in Fig. 4 (a) suggests a BT/Ip dependenceof Deff . One could consider this to be the result of a q (safety factor) dependence or a dependence on L. The single parameter regression in Fig. 4 (b) does almost as well as the 4 parameter regression, indicating that
λ
ei/L is a statistically relevant quantity [4]. The data set shown here contains twice as many points as that considered in Ref. [4] but yields a similar scaling, Deff ~ (λ
ei/L)-1.5. (We emphasize here that Deff does not scale like Bohm in either BTor Te, similar to conclusions drawn from earlier work on
χ
eff scalings [11].)For fixed electron temperature at the separatrix, one might expect edge plasma parallel collisionality (~L/
λ
ei) andn
e/
n
G to be nearly proportional (at fixed BT) , makingn
e/
n
G apossible scaling parameter. Deff , Veff (=particle flux/density), and
λ
ei/L are plotted versusn
e/
n
G in Fig. 5 for the same set of data shown in Fig. 4. It is apparent that all quantities do indeed track withn
e/
n
G fairly well. Thus we see thatn
e/
n
G can be used as a crude ‘proxy’ forλ
ei/L near the separatrix, with appropriate transformation. Since the density near theseparatrix increases with
n
e, it is clearly evident from the plot of Veff in Fig. 5 that the cross-field particle flux near the separatrix increases much faster thann
e, i.e., particle confinement in the edge region is degrading with increasedn
e/
n
G (decreasedλ
ei/L).5. Heat Convection
Associated with the cross-field particle transport is a significant level of cross-field heat convection [4]. At low values of
n
e/
n
G, cross-field heat convection is an important player, but only in the far SOL region where the profiles are flat, ‘bursty’ transport behavior is prominent, and due to the low electron temperatures there (< 20 eV), parallel electron heat conduction to the divertor structures is relatively weak. However, asn
e/
n
G is raised cross-field heat convection begins to compete with parallel conduction to the divertor in the near SOL region. At moderate values ofn
e/
n
G, Te at the separatrix is also reduced from the normally ‘stiff’ value (~50 eV) set by parallel electron conduction alone; the plasma transport losses in the SOL dramatically shift from parallel conduction-dominated to cross-field heat convection-dominated.Figure 6 illustrates the systematic changeover in SOL power balance that occurs with increasing
n
e/
n
G. Data were taken from a series of discharges with different line-averaged densities but all other parameters held fixed (ohmic L-mode, Ip = 0.8 MA, BT = 5.3 tesla). For values ofn
e/
n
G < ~0.3, the power into the SOL (ohmic input power minus radiation) is nearly fully accommodated by parallel conduction to the divertor. Whenn
e/
n
G is increased beyond ~0.3 a clear transition occurs: parallel conduction to the divertor drops and cross-field convection rises over the entire SOL (the value estimated near the separatrix is shown in Fig. 6); parallel0.1 0.2 0.3 0.4 0.5 0.6 0.01 0.1 1 0.1 0.2 0.3 0.4 0.5 0.6 1 10 0.1 0.2 0.3 0.4 0.5 0.6 0.01 0.1 Deff Veff
λ
ei/L (m 2 s -1 ) (m s -1 )Data at 2 mm into SOL
n
e
/n
G0.5
I
p (MA)0.8 1.0
FIG. 5 - Effective diffusion coefficient (top), convection velocity (middle) and value of λei/L (bottom) at a location 2 mm into the SOL are plotted versus normalized line-average density. FIG. 4 - Correlation of Deff with two
different sets of regressors. Regression with single parameter, λei/L, captures essential trend. 0.01 0.1 1.0 0.01 1.0 (m2 s-1) (m 2 s -1) 0.01 0.1 1.0 (m 2 s -1) 0.1 ∝(
λ
ei/L)-1.5 ∝Te-4.5 n1.1Ip-2.0 BT 2.4 Multiple Correlation Coefficient = 0.75 Multiple Correlation Coefficient = 0.64 (a) (b)conduction plus cross-field convection approximately account for the total power into the SOL. The outer divertor is seen to detach for
n
e/
n
G > ~0.35, which is consistent with the onset of a regime of reduced power flow into the divertor. This observation suggests that the threshold for divertor detachment is determined to a large degree by cross-field transport physics (leading to a reduction of parallel heat conduction into the divertor); a rapid turn-on of volumetric power and momentum loss mechanisms in the divertor region would naturally follow.6. Behavior Near Density Limit
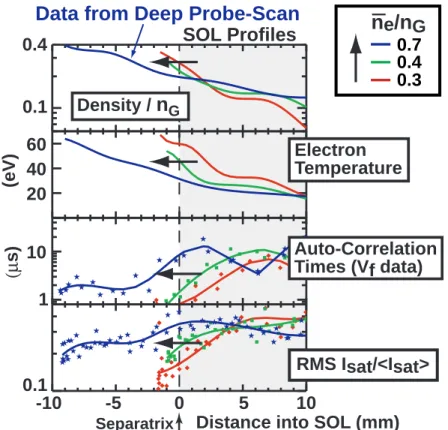
The evolution of edge plasma transport behavior as the density limit is approached has been studied in discharges similar to that shown in Fig. 7: An ohmic L-mode discharge with a continuously ramping plasma density is established by gas puffing. After a period of ~0.7 seconds, the plasma current is ramped down such that a density limit induced disruption occurs. The middle panel in Fig. 7 displays the total input power (ohmic), total radiated power (2π bolometer), and an estimate of the power convected through a magnetic flux surface in the shadow of the main-chamber limiters. These traces indicate that the sum of radiation and limiter convection losses approximately account for the input power as the density limit is approached. The density limit is reached near the time when these losses exceed the input power. The horizontal scanning probe is used to record SOL profiles at three times, indicating a rapid reduction in
λ
ei/L near the separatrix.Cross-field profiles of density (normalized to
n
G), electron temperature, and fluctuation characteristics are shown in Fig. 8. Forn
e/
n
G ~ 0.7, the probe was able to penetrate deeper inside closed flux surfaces owing to the reduced energy densities. Density and temperature profiles in the near SOL region show the familiar flattening as the core density is raised (orn
e/n
G Outer Divertor Detached 0.1 0.2 0.3 0.4 0.5 0.6 0.0 0.5 1.0 1.5 (MW)Power into SOL [Pin - Prad] Conduction to Divertor [Qdiv ] Convection Across Sep. [Qconv ] Input Power [Pin ] 90 Ohmic L-Mode Datapoints: Ip = 0.8 MA BT = 5.3 tesla
FIG. 6 - Power flow in the SOL for different values of ne/nG in otherwise similar discharges. Qconv is the power convected across the separatrix. Qdiv is the total power carried towards the divertor by electron parallel conduction.
λ
ei/L near separatrix reduced). However, forn
e/
n
G ~ 0.7 there no longer is a transitionbetween a steep-gradient region in the near SOL and a shallow gradient region in the far SOL; densities, temperatures and gradients that are typical of the far SOL at low
n
e/
n
G now appear to move inside the separatrix. As a consequence, the normalized density at the separatrix does not increase withn
e/
n
G but appears to saturate at a value near ~0.2.The fluctuation profiles show a similar evolution. At low
n
e/
n
G, the auto-correlation times of floating potential signals and the normalized ion saturation current fluctuation amplitudes show the usual behavior; they track with the density gradient, being lower in a steep-gradient near SOL region and higher in a shallow-gradient far SOL region. For the density profile atn
e/
n
G ~ 0.7 with no steep gradient region in the SOL, the auto-correlation times and the normalized ion saturation current fluctuation amplitudes are correspondingly large across the entire SOL and extend inside closed flux surfaces. In this regime, the edge plasma has apparently become so collisional and dominated by rapid cross-field transport that the change in magnetic topology between open and closed field lines no longer has a visible impact on the profiles.In summary, we see that as
n
e/
n
G is increased from low values to values approaching ~1, an ordered progression in the cross-field edge transport physics occurs, connected to the increase in edge plasma parallel collisionality: (1) benign cross-field heat convection affecting only the far SOL region, (2) cross-field heat convection impacting SOL power loss channels and reducing the separatrix electron temperature, (3) divertor detachment, due in part to a reduced power flow into the divertor, and finally (4) ‘bursty’ transport normally restricted to the far Fig. 7. Time evolution of a discharge used to study SOL transport and fluctuation behavior near the density limit. Top panel: plasma current and line-averaged density. Middle panel: input power, total radiated power, and an estimate of heat convection onto main-chamber limiter surfaces based on limiter-shadow particle flux probe. Lower panel: ne/nG and λei/L at 1 mm into SOL obtained from the three times when the horizontal scanningprobe is operated.0.0 0.2 0.4 seconds 0.6 0.8 1.0 0 0.5 1.0 (MA) Plasma Current 0 1 2 3 4 5 Line Averaged Density 0.0 0.2 0.4 seconds 0.6 0.8 1.0 0 1 2 (MW) Input Power Radiated Power 0.0 0.2 0.4 0.6 0.8 1.0 (seconds) 0.0 0.5 1.0 0.00 0.04 0.08
λ
ei/L ne/nG (10 20 m -3) ⊥ Heat Convection to Limiter/Wall based on Limiter Particle Flux Probeλ
ei/L, 1mminto SOL
Horizontal Scanning Probe records profiles at three times
SOL region invading into closed flux surface regions and carrying a convective power loss that affects the power balance of the discharge. These observations suggest that a key underlying ingredient in the empirically observed density limit scaling law is the physics of cross-field particle transport in the edge and SOL regions.
References
[1] Greenwald, M., et al., Nuclear Fusion 28 (1988) 2199. [2] Wesson, J.A., et al., Nuclear Fusion 29 (1989) 641.
[3] Greenwald, M., Plasma Physics and Controlled Fusion 44 (2002) R27. [4] LaBombard, B., et al., Physics of Plasmas 8 (2001) 2107.
[5] Terry, J.L., et al., Journal of Nuclear Materials 290 (2001) 757.
[6] Carreras, B.A., Lynch, V.E., and LaBombard, B., Physics of Plasmas 8 (2001) 3702. [7] Umansky, M.V., Krasheninnikov, S.I., LaBombard, B., and Terry, J.L., Physics of
Plasmas 5 (1998) 3373.
[8] LaBombard, B., et al., Nuclear Fusion 40 (2000) 2041. [9] Zweben, S.J., et al., Physics of Plasmas 9 (2002) 1981.
[10] Terry, J.L., Zweben, S., and Maqueda, R., et al., this conference, paper EX/P5-10 (2002).
[11] LaBombard, B., et al., Journal of Nuclear Materials 241-243 (1997) 149.
Fig. 8 - Cross-field profiles recorded by a scanning Langmuir probe (solid lines are spline fits to data points). Owing to the reduced Te for ne/nG ~ 0.7, the probe could be inserted well beyond the separatrix without overheating. Third panel: auto-correlation times of floating potential fluctuations. Bottom panel: RMS fluctuation level of ion saturation current normalized by the mean value. -10 -5 0 5 10 0.1 -10 -5 0 5 10 20 40 60 -10 -5 0 5 10 1 10 -10 -5 0 5 10 0.1 RMS Isat/<Isat> Auto-Correlation Times (Vf data) Electron Temperature (µ s) (eV) Density / nG
Distance into SOL (mm) Separatrix
Data from Deep Probe-Scan
0.4 SOL Profiles
ne/n
G0.3 0.4 0.7