HAL Id: hal-03210965
https://hal.sorbonne-universite.fr/hal-03210965
Submitted on 29 Apr 2021
HAL is a multi-disciplinary open access
archive for the deposit and dissemination of
sci-entific research documents, whether they are
pub-lished or not. The documents may come from
teaching and research institutions in France or
abroad, or from public or private research centers.
L’archive ouverte pluridisciplinaire HAL, est
destinée au dépôt et à la diffusion de documents
scientifiques de niveau recherche, publiés ou non,
émanant des établissements d’enseignement et de
recherche français ou étrangers, des laboratoires
publics ou privés.
mineralization on the effective cortical bone elastic
properties
Luc Brémaud, Xiran Cai, Renald Brenner, Quentin Grimal
To cite this version:
Luc Brémaud, Xiran Cai, Renald Brenner, Quentin Grimal. Maximum effect of the heterogeneity of
tissue mineralization on the effective cortical bone elastic properties. Biomechanics and Modeling in
Mechanobiology, Springer Verlag, In press, �10.1007/s10237-021-01459-z�. �hal-03210965�
Maximum effect of the heterogeneity of tissue
mineralization on the effective cortical bone elastic
properties
Luc Brémaud1, 2 · Xiran Cai1, 3
Renald Brenner2 · Quentin Grimal1
Abstract The mineralization level is heterogeneous in cortical bone extracellular
matrix as a consequence of remodeling. Models of the effective elastic properties at the millimeter scale have been developed based on idealizations of the vascular pore network and matrix properties. Some popular models do not take into account the heterogeneity of the matrix. However, the errors on the predicted elasticity when the difference in elastic properties between osteonal and interstitial tissues is not modeled have not been quantified. This work provides an estimation of the maximum error. We compare the effective elasticity of a representative volume element (RVE) assuming (1) different elastic properties in osteonal and interstitial tissues vs. (2) average matrix properties. In order to account for the variability of bone microstructure, we use a collection of high resolution images of the pore network to build RVEs. In each RVE we assumed a constant osteonal wall thickness and we artificially varied this thickness between 35 and 140 µm to create RVEs with different amounts of osteonal tissue. The homogenization problem was solved with a fast Fourier transform (FFT) based numerical scheme. We found that the error depends on pore volume fraction and varies on average from 1% to 7% depending on the assumed diameter of the osteons. The results suggest that matrix heterogeneity may be disregarded in cortical bone models in most practical cases.
Keywords bone mineralization · porosity · elasticity · homogenization · mesoscale
Luc Brémaud Xiran Cai [email protected] Renald Brenner [email protected] Quentin Grimal [email protected]
1 Sorbonne Université, INSERM, CNRS, Laboratoire d’Imagerie Biomédicale, F-75006, Paris,
France
2Sorbonne Université, CNRS, Institut Jean Le Rond ∂’Alembert, F-75005 Paris, France
3School of Information Science and Technology, ShanghaiTech University, Pudong District,
1 Introduction
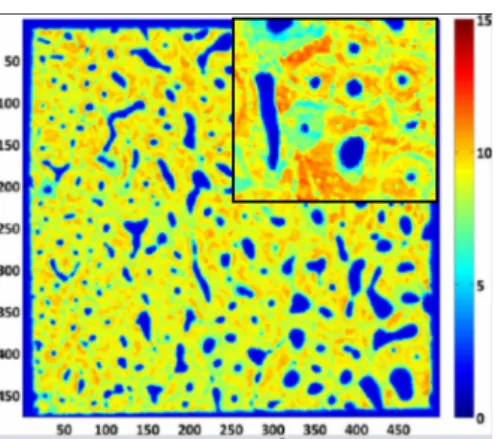
About 10% of the adult skeleton is renewed every year by the remodeling process which, in cortical bone, produces secondary osteons. Bone cells deposit a collagen matrix which is progressively mineralized resulting in an increase of the average degree of mineralization of bone (DMB) (Boivin and Meunier 2002). As a consequence of this continuous remodeling process, cortical bone mineralized extracellular matrix (or shortly, matrix) is an assembly of portions of tissue of various ages characterized by different mineralization levels. The oldest part of this tissue is found in the interstitial tissue, which is composed of remnants of old osteons which have been partially remodeled. The difference of DMB between intact osteons and interstitial tissue is directly observed in microradiographs or indireclty as differences of elasticity with nanoindentation (Zysset et al. 1999), or acoustic impedance (a proxy for tissue elasticity) with scanning acoustic microscopy (Raum 2008) as illustrated in Fig. 1. Typically, osteons with the lowest mineral density contain 70% to 75% of the mineral content of the most highly calcified tissue parts (Boivin and Meunier 2002). For instance, Lefevre et al. found that DMB measured from quantitative microradiography in elderly adults was 1.260 (± 0.029) g cm−3in interstitial tissue vs. 1.079 (± 0.037)
g cm−3in osteonal tissue (Lefèvre et al. 2019).
Fig. 1: Scanning acoustic microscopy (SAM) maps of acoustic impedance (MRayl) of human femoral cortical bone in a plane transverse to osteons. The relative differences in impedance reflect to a large extent the variations of mineralization levels in different portions of the tissue, a larger impedance (or elasticity) corresponding to more mineralized, and older, tissue (Raum et al. 2006). The main image is a region of 5 × 5mm2scanned at 50 MHz with a resolution of about 30µm. The inset is a SAM
image at 200 MHz with a resolution of about 8µm (Granke et al. 2011). The vascular porosity appears in dark blue.
The effective elastic properties of cortical bone at the mesoscale (Grimal et al. 2011a), or millimeter scale, are determined by the elastic properties of the mineralized tissue (matrix) and the properties of the pore network. Micromechanical models have been used for several decades to calculate the effective elastic properties for given representative volume elements (RVE) of bone. These models have been extensively
used to investigate the relationships between material composition, microarchitecture and elastic properties. The heterogeneity of the elastic properties of the matrix, i.e., the differences between osteonal and interstitial tissues, has been considered in some studies (Crolet et al. 1993; Dong and Guo 2006; Grimal et al. 2008; Hamed et al. 2010). However, many other authors have considered an homogeneous matrix (Hellmich and Ulm 2004; Sevostianov and Kachanov 2000; Parnell and Grimal 2009; Baumann et al. 2012; Gagliardi et al. 2017; Cai et al. 2019a). The errors on predicted mesoscale properties when the differences in elasticity between osteonal and interstitial tissues are disregarded have not been quantified. Noteworthy, these errors may strongly depend on the underlying microstructure (porosity and pore organization).
The objective of the present paper is to quantify the range of errors on predicted mesoscale effective elastic properties due to the assumption of an homogeneous mineralized matrix. We compare the effective elasticity of a RVE assuming (1) different elastic properties in osteonal and interstitial tissue and (2) average elastic properties. In order to account for the variability of bone microstructure, we use a collection of high resolution three-dimensionnal images of the pore network to build RVEs of cortical bone. For each RVE, we assume a constant osteonal wall thickness and we artificially vary this thickness between 35 and 140 µm to create RVEs with different amounts of osteonal tissue. With this parametric study, we estimate a maximum effect of the heterogeneity
This work provides data to quantitatively discuss the relevancy of important assumptions of cortical bone models. The results are helpful to guide the interpretation of effective elastic properties at the millimeter scale. These effective properties are involved in finite element models for the prediction of bone strength (van Rietbergen and Ito 2015; Engelke et al. 2016) or bone remodeling (Martínez-Reina and Pivonka 2019), and for the in vivo assessment of porosity by inverse approaches (Minonzio et al. 2019)
2 Model
2.1 Specimens and bone microstructure modelling
We have used a collection of synchrotron radiation micro-computed tomography
(SR-µCT) 3D images of volumes of interest (VOI) from a previous study (Cai et al. 2019a)
(Fig. 2). Briefly, cortical bone specimens were harvested from the mid-diaphysis of the left femur of 25 human cadavers. Among the donors, 13 were females and 12 were males (50 − 95 years old, 77 ± 11.5, mean±SD). The nominal size of the specimens was 3 × 4 × 5 mm3in radial (x
1), circumferential (x2) and axial (x3) directions of
the bone, respectively.
The femurs were provided by the Départment Universitaire d’Anatomie Rockefeller (Lyon, France) through the French program on voluntary corpse donation to science. The tissue donors or their legal guardians provided informed written consent to give their tissue for investigations, in accord with legal clauses stated in the French Code of Public Health.
Images of the specimens were obtained with isotropic voxel size of 6.5 µm per-formed at the European Synchrotron Radiation Facility (ESRF, Grenoble, France), Figure 3. The 3D volume of each specimen was slightly rotated with the image processing software Fiji (Schindelin et al. 2012) using bilinear interpolation so that
Fig. 2: A representative reconstructed cross-sectional slice from the SR-µCT data (pixel size 6.5 µm) before segmentation.
the geometric coordinates coincide with the material coordinates defined by the faces of the specimen. As perpendicularity and parallelism errors were about 1◦(Cai et al.
2017), the orientation correction was small. Thereafter, axis x3was approximately
along the direction of osteons and axes x1and x2were perpendicular to osteons. The
images were then binarized by simple thresholding to obtain two phases : pores and mineralized matrix (Cai et al. 2019a). In each specimen, a VOI of approximately 2.8 × 3.9 × 4.8 mm3 corresponding to one representative volume element (RVE) for
the homogenization was selected manually. The VOI size was much larger than the minimum RVE size for cortical bone (Grimal et al. 2011a). After a convergence study (Cai et al. 2019a), the voxel size was then increased to 35 µm to reduce the computational cost, which lead to about 1.2 million voxels per specimen.
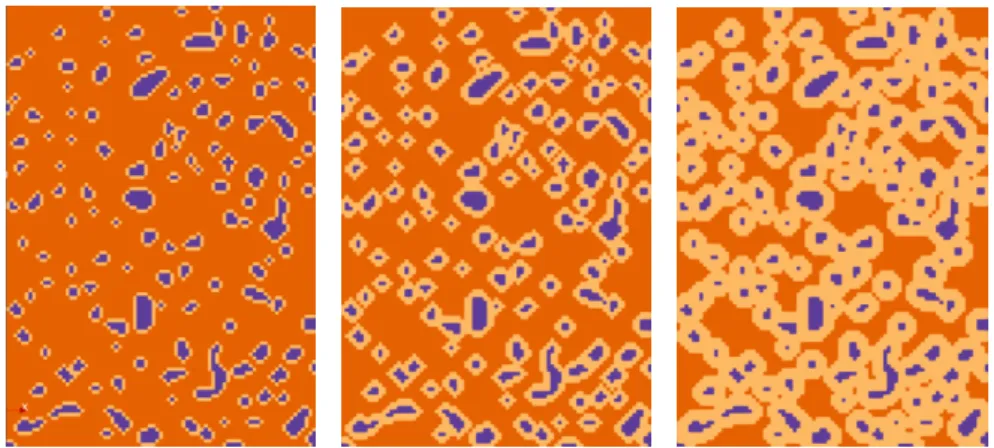
We then built RVEs made of three phases: the pores and two phases within the mineralized matrix to model its heterogeneity, that is, an assembly of osteonal (O) and interstitial (I) tissues. Images were processed to obtain segmentation masks for the osteonal and interstitial phases based on the observation that the Haversian canals run roughly along an osteon’s center line (Maggiano et al. 2016). The osteonal tissue was defined to be within a ring of a given thickness e around pores. Each slice of the 3D image stack, which was roughly perpendicular to the osteon axis, was processed independently. The ring was obtained by erosion with a disk as structuring element (Figures 3 and 4).
2.2 Notation for the elasticity tensor
We use the classical two-indices Voigt notation for the stiffness tensor components
Cij. For an orthotropic material with principal directions aligned with the frame
axes (x1, x2, x3), the stiffness tensor C has nine independent moduli : Cii(i = 1, 2, 3)
denote the longitudinal stiffnesses, Cii(i = 4, 5, 6) denote the shear moduli and only
Fig. 3: Three-dimensional representative volume element (RVE) with vascular pores in black. Left: two-phase model where the matrix (white) is considered to be a mixture of interstitial and osteonal tissue. Right: three-phase model where the matrix is made of two phases (white: osteonal tissue; dark gray: interstitial tissue). The direction of the bone diaphysis axis (and approximate osteon axis) is given by x3.
Fig. 4: A transverse cross-section of one cortical bone RVE showing the vascular pores (blue) and the two phases within the mineralized matrix (light orange: osteonal tissue; dark orange: interstitial tissue) for different values of osteon thickness: e = 35µm (left), e = 70µm (center), and e = 140µm (right)
isotropic material with symmetry axis x3, additional conditions hold: C11 = C22, C12= C11−2C66, C13= C23, and C44= C55(five independent moduli).
2.3 Mineralized matrix elasticity model
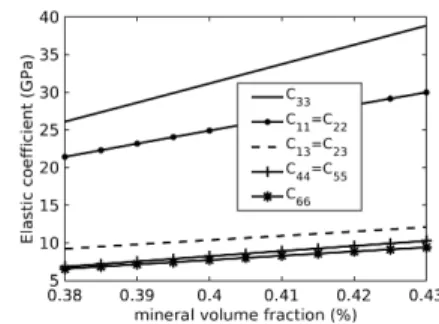
Following Grimal et al. (2008, 2011b), the mineralized matrix elastic properties are modeled in a transversely isotropic framework as functions of the mineral volume frac-tion fha. We use the “mineral foam matrix with collagen inclusions” micromechanical
Fig. 5: Elastic coefficients of the mineralized matrix as a function of mineral volume fraction fha (Grimal et al. 2008, 2011b).
model introduced by Hellmich et al. (2004) which is based on two idealizations: (1) at a length scale of 100 nm, hydroxyapatite crystals and ultrastructural water with non-collagenous organic material constitutes a mineral foam; (2) at a length scale of 5 to 10 microns, collagen fibers are embedded into the mineral foam. Volume fractions of the collagen fibers and water-filled nanoscale pores are respectively denoted fcol and
fw. The model assumes fixed elastic properties of the constituents (mineral, collagen,
and water) and uses self-consistent and Mori-Tanaka homogenization schemes to derive the effective properties. Since fha+ fcol+ fw= 1 the model has in fact only
two independent parameters. Furthermore, using an empirical relationship between
fcol/fw and fha(Raum et al. 2006; Broz et al. 1995), the mineralized matrix stiffness
tensor Cmis obtained as a function of a single parameter which we choose to be f ha.
The evolution of matrix elastic coefficients as a function of fhais plotted in Figure 5
for illustration. Different values of fhaare assumed for the osteonal and interstital
tissues as described below.
2.4 Choice of RVE parameters
Each RVE is defined by a specific microstructure θ (i.e, a 3D image of the vascular porosity), the transversely isotropic elastic properties of osteonal and interstitial tissues as well as osteon thickness e. As the elastic properties of the matrix phases are functions of fha, as explained above, the RVE effective elasticity tensor is a
function eC= f(θ, e, Cm;O, Cm;I) with Cm;O and Cm;I the elastic stiffness tensors
of osteonal and interstitial tissues, respectively.
Interstitial tissue is assumed to be fully mineralized, that is, Cm;I = Cm(fI ha=
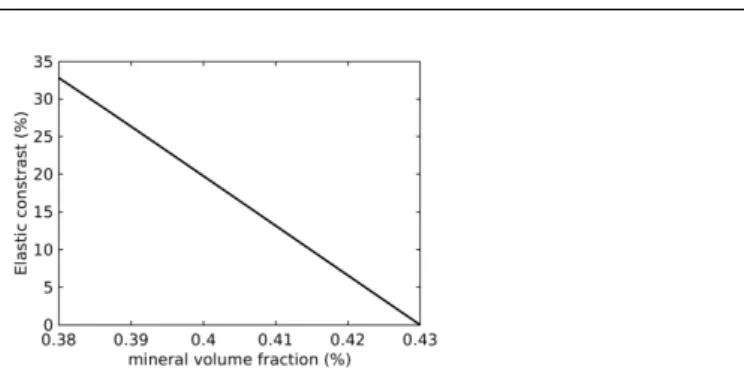
0.43) and we consider a mineral volume fraction of osteonal tissue fO
ha = 0.40, Cm;O= Cm(fhaO = 0.4). These constitutive assumptions correspond to a longitudinal
stifness Cm;O
33 which is 19.75% smaller than C
m;I
33 (Figure 6). These values were
selected based on the elasticity differences observed in nanoindentation measurements of osteonal and interstitial tissues. For instance, Rho et al. (1997) measured dehydrated tibia specimens embedded in epoxy resin and reported Young’s moduli measured along the osteon axis of 22.5 ± 1.3GPa and 25.8 ± 0.7GPa in osteonal and interstitial tissues respectively, that is, a Young’s modulus 12.8% smaller in osteonal tissue. Zysset et al. (1999) reported Young’s moduli measured along the osteon axis in diaphyseal wet femoral bone specimens of 19.1 ± 5.4GPa in osteonal and 21.2 ± 5.3GPa in interstitial
Fig. 6: Difference in elastic properties between the interstitial and osteonal tissues, calculated as 100 ×C33m;I−C
m;O 33
C33m;I
, as a function of the mineral content of the osteonal tissue fO
ha. The mineral content of the interstitial tissue is kept constant : f I
ha= 0.43
tissue, and in the femoral neck of 15.8 ± 5.3GPa in osteonal and 17.5 ± 5.3GPa in interstitial tissue, that is, a Young’s modulus about 10% smaller in osteonal tissue.
For the purpose of comparison, we also calculated the stiffness tensor Cm;hom
of an equivalent homogeneous matrix. The elasticity tensor is obtained from the mineralized matrix elasticity model by considering the average mineral content hfhai,
that is Cm;hom= Cm(hfhai), hfhai= νIfI ha+ ν OfO ha νI+ νO (1)
where νI and νO are the volume fractions of interstitial and osteonal phase,
respec-tively. Due to the quasi-linear variation of the elastic moduli in the considered range of mineral volume fraction (Figure 5), it almost coincides with the Voigt bound
Cm(hfhai) ≈ hCmi . (2)
Osteon thickness e was chosen according to literature data reporting dimensions of the Haversian canals and of the osteons. Britz et al. (2009) conducted a two-dimensional histomorphometric analysis on microradiographs of femoral diaphyseal tissue from 88 donors (male and female 17 to 97 years old from the Melbourne Fe-mur Research Collection (https://dental.unimelb.edu.au/research/melbourne-feFe-mur- (https://dental.unimelb.edu.au/research/melbourne-femur-research-collection). They reported osteon diameter in the range [155 − 325] µm with average of 220 ± 28 µm. Cooper et al. (2007) analyzed the properties of the vascular porous network in three-dimensions from Micro-CT images of 79 donors (males and females 18 to 92 years old, also from the Melbourne Femur Collection). They reported pore diameters in the range [56.0−456.3] µm with average of 117.2±89.6 µm. Gauthier et al. (2019) et al. conducted a SR-µCT study on samples from the radius of eight female donors (70.3 ± 13.7 y.o.). Osteonal canal diameter was (mean, SD) 64.7 ± 23.1µm and osteon diameter was 184.0 ± 13.3µm. Based on these mean values of osteon and pore diameters, the average thickness of the osteonal wall is between 50 and 60 µm with an expected large interval of variation which cannot be calculated from the experimental data of different sources.
We used e = 35, 70, 105 and 140µm. The smallest value corresponds to the typical (average) size of an osteon. The other values were chosen in order to model a maximum effect of the matrix heterogeneity on effective elastic properties at the mesoscale.
Pores were assumed to be filled with a fluid whose elastic properties are similar to those of water, that is a bulk modulus equal to 2.2 GPa and a null shear modulus. The parameters of the RVE are summarized in Table 1.
3 Overall elasticity inferred from numerical homogenization
To investigate the influence of the bone tissue heterogeneity on the effective elastic properties, we have performed unit-cell computations on the RVE samples with the microstructural assumptions previously described. The size of the constitutive heterogeneities (i.e pores and osteons) being much smaller than the sample volume, the Hill-Mandel macro-homogeneity condition is fulfilled. The overall properties can thus advantageously be determined by assuming periodic-boundary conditions on the microstructural unit-cell Ω. The local problem to be solved thus reads, ∀x ∈ Ω,
( curl(curlTε(x)) = 0, div σ(x) = 0,
σ(x)= C(x) : ε(x),
(3)
with periodicity conditions on the boundary ∂Ω (Suquet 1987). ε and σ are respec-tively the linearized strain and Cauchy stress. C is the tensor field of the local elastic moduli which values correspond to the elastic properties of the pores, the osteonal or the interestitial tissue (Table 1) depending on the coordinate. To solve the problem (3), we have used a fast Fourier transform (FFT) based numerical scheme (Moulinec and Suquet 1998; Moulinec and Silva 2014). The principle of this method is to solve iteratively the implicit integral equation for the strain field ε(x)
ε(x) = E + Z Ω Γ(0)(x − x0) : τ (x0)dx0, τ(x) = (C(x) − C(0)) : ε(x) (4)
with E the macroscopic strain and Γ(0) denoting the strain Green operator
corre-sponding to a reference homogeneous medium with elasticity C(0). This numerical
method, which is widely used in engineering material mechanics, has been recently used for cortical and trabecular bones (Colabella et al. 2017; Gagliardi et al. 2018; Cai et al. 2019a, 2020). It can be mentioned that it allows to perform calculations directly on the microstructure digital image. The effective elastic moduli tensor eCis
classically defined by
hσiΩ= eC:hεiΩ (5)
where h.iΩ denotes a volume average over the unit-cell. No symmetry assumptions
have been made on eCand six independent loadings were performed, for each sample,
to determine the whole set of overall elastic coefficients (21). The reader is referred to Cai et al. (2019a) for a detailed convergence analysis.
4 Results and discussion
The mineral content of the interstitial and osteonal tissues being chosen, the effective elasticity tensor eCis solely a function of the specific pore network microstructure
θ and the considered osteon thickness e. Unit-cell FFT computations have been
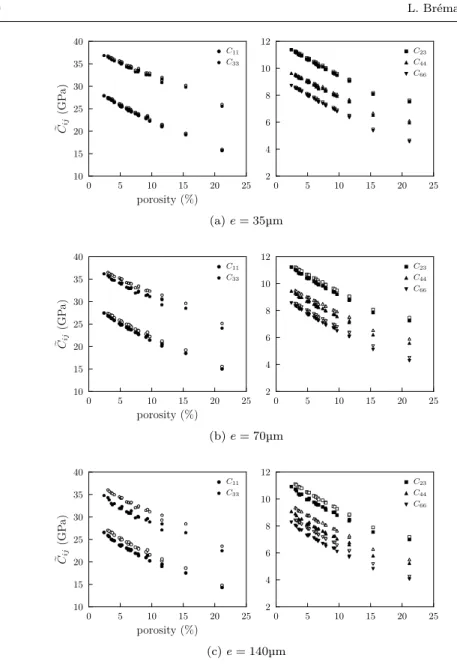
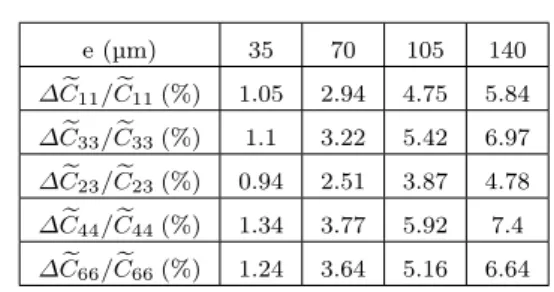
performed for each parameter pairs (θ, e) by considering either an heterogeneous matrix (pores coated with osteons) or an equivalent homogeneous matrix. Numerical results are reported in Figure 7 for the 25 different pores network microstructures with porosities ranging from about 3 to 20%. The relative errors of elastic moduli (i.e., the relative difference between effective elastic moduli of heterogenous matrix mineralization and homogeneous matrix mineralization) as a function of porosity are shown in Figure 8 for the largest osteon thickness. The average error values are given in Table 2 for each osteon thickness.
The relative error between effective elasticity coefficients using a homogeneous versus a heterogeneous matrix depends on the porosity and the osteonal thickness. The error weakly depends on the elastic modulus and varies from ∼ 1% for e = 35 µm to ∼ 7% for e = 140 µm. For e = 140 µm, it can be observed that the difference is almost constant for a porosity between 5 and 10%. Nevertheless, fluctuations of the error of about 2% are observed between samples of similar porosity but different microstructure, evidencing an influence of the distribution of pores on the error. For lower or higher porosity values, the difference decreases. More bone samples with a high porosity would be necessary for a more quantitative analysis.
The equivalent homogeneous matrix elasticity (Eq. 1) is almost defined by the Voigt upper bound because the ’homogeneous’ mineral content is calculated as the arithmetic mean. Accordingly, accounting for the matrix morphological heterogeneity in the homogenization is expected to lead to lower effective moduli, which is observed in our results. Furthermore, for a given microstructure, this softening effect consistently increases with the osteon thickness, except for high porosity values. At a larger scale, by modeling the global stiffness of a mouse femur from high-resolution CT, Blanchard et al. (2013) also observed that calculating apparent properties from the average mineral content overestimates the stiffness compared to a model incorporating the heterogeneity of the mineral distribution in the femur.
In our work, the calculated error should be considered as an upper bound because we have designed the study to model a maximum effect of the heterogeneity. We selected values of fha for the osteonal and interstitial phases leading to differences in
elastic properties in the upper range of the differences observed experimentally. We have also considered that all pores are surrounded by softer tissue (young osteon) and that the thickness of the osteons’ wall around canals is constant inside each RVE. In reality many pores are surrounded by older tissue, reducing the difference in mechanical properties with interstitial tissue.
We used an idealized model of cortical bone that incorporates the main features of the heterogeneity and that was parametrized in order to observe a range of effects. More realistic and sample-specific models could be designed using calibrated
SR-µCT data providing DMB for each voxel. The specific elastic heterogeneity could be
reconstructed after converting DMB to elasticity for each voxel. A major drawback of this approach is that the law to convert DMB to a stiffness tensor at this scale is not known and likely dependent on the location in the tissue. Another sample-specific approach would be to perform a segmentation of osteons based on the differences of gray level between osteons and interstitial tissue (Gauthier et al. 2019) and then allocate a different stiffness per tissue type. However, even with high quality acquisitions this would have required a prohibitive amount of work for the samples of the present study.
0 5 10 15 20 25 porosity (%) 10 15 20 25 30 35 40 eCij (GP a) C11 C33 0 5 10 15 20 25 2 4 6 8 10 12 C23 C44 C66 (a) e = 35µm 0 5 10 15 20 25 porosity (%) 10 15 20 25 30 35 40 eCij (GP a) C11 C33 0 5 10 15 20 25 2 4 6 8 10 12 C23 C44 C66 (b) e = 70µm 0 5 10 15 20 25 porosity (%) 10 15 20 25 30 35 40 eCij (GP a) C11 C33 0 5 10 15 20 25 2 4 6 8 10 12 C23 C44 C66 (c) e = 140µm
Fig. 7: Evolution of the effective elastic coefficients eCij with porosity for different
osteon thicknesses: (a) e = 35µm, (b) e = 70µm and (c) e = 140µm (solid symbols: two-phase bone matrix composed of interstitial tissue and osteons; open symbols: equivalent homogeneous matrix)
Considering more realistic models of tissue heterogeneity would likely lead to errors smaller than the errors we calculated. Interestingly, the error is found to be the largest in the most common porosity interval for non-pathological bone (∼5-10%). For high porosities we have observed a reduction of the error that could be due to the fact that in these cases, the osteonal tissue covers a very large fraction of the matrix volume resulting in a quasi-homogeneous matrix. However, in the case of high
0 5 10 15 20 25 porosity (%) 0.00 0.02 0.04 0.06 0.08 0.10 ∆ eCij / eCij C11 C33 0 5 10 15 20 25 C23 C44 C66
Fig. 8: Relative difference for thickness e = 140µm. Note that the denominator represents the effective elastic moduli considering homogeneous matrix mineralization
e
C= eChom. matrix and ∆ eC= | eChom. matrix− eChet. matrix|.
porosities, this error might be somewhat underestimated : some of the osteons are in reality more mineralized leading to an increased heterogeneity.
Modeling cortical bone elastic properties, as any modeling approach, is a matter of idealizations consisting in neglecting certain details of the organization of the tissue. The results of the present study complete a detailed analysis of some idealizations relevant for cortical bone mesoscale elasticity modeling conducted during the last decade. The accuracy of more or less refined models has been evaluated by comparing model predictions to experimental values of anisotropic elastic coefficients obtained from samples of human donors (Granke et al. 2011; Baumann et al. 2012; Cai et al. 2019b). The samples were typically imaged with high-resolution µCT (as for the present work) to obtain a representation of the microstructure and the matrix mineral content. Then, the question arises as to whether an accurate estimation of elastic properties can be obtained from this information, that is, whether the variability of mesoscale elastic properties can be explained from the mineral content of the matrix and an image of the microstructure.
Porosity (volume fraction of pores) alone is known to explain the largest part of elasticity variations (Granke et al. 2011; Cai et al. 2019b). Indeed, a popular simple model for cortical bone is a homogeneous transversely isotropic matrix with fixed properties pervaded by elongated pores with a single orientation (e.g., (Hellmich and Ulm 2004; Parnell et al. 2012; Baumann et al. 2012; Gagliardi et al. 2017)). This simple model, which disregards the details of the pore structure and the inter-individual variations of matrix elasticity, accounts well for the variations of elastic properties with porosity (Hellmich and Ulm 2004; Granke et al. 2015; Cai et al. 2019b), or with the average orientation of mineral crystals (Baumann et al. 2012), with errors compared to experimental data typically below 10% (average error for a collection of samples). Nevertheless this model has several potential biases and its accuracy for predicting the elasticity of a given specimen may not be as good as 10%. As shown by comparing this simple model to an FFT model accounting for the details of the pore network structure (similar to the present work), disregarding the complexity of the pore network and model it as a collection of cylindrical pores leads to an overestimation of effective elasticity of 1% to 15% depending on the elastic coefficient Cij and porosity level (Cai et al. 2019a).
Apart from the porosity, the average matrix mineral content explains a part of the experimental variation of effective mesoscale elasticity: taken together, these
two variables were found to explain 76 to 91% of the variability of the different elastic coefficients (Cai et al. 2019b). In the elderly population without specific bone pathology, the coefficient of variation of the average mineral content was found to be 2% (Cai et al. 2019b). Using inverse homogenization based on mesoscale anisotropic stiffness data for the same samples, Cai et al. (2020) calculated a coefficient of variation of matrix elastic coefficients between 3 and 7% depending on the elastic constant, which was correlated to the mineral content. (Note that above reported percentages are for coefficients of variations, and that the actual ranges of variation are somewhat larger). Accordingly, an accurate model of cortical bone at the mesoscale should also consider an accurate modeling of the anisotropic elastic properties of the matrix, which would reflect the mineral content of the bone matrix. Then, the question arises as to whether such a model of matrix elasticity should account for the heterogeneous distribution of the mineral at the scale of 10-100 µm, e.g., lower mineral content in osteons compared to interstitial tissue. This is precisely the contribution of the present work where we have shown that disregarding the heterogeneity of the matrix and assuming that its elasticity can be derived from the average matrix mineral content leads to an overestimation of effective elasticity of a maximum of about 7% in extreme cases.
The main limitation of the present study is that we have used a relatively simple micromechanical model to obtain the elasticity tensor with a single parameter fha
associated to the mineral content. Due to the coarse assumptions of the micromechan-ical model, we argue that this parameter should not be seen as the actual volume fraction of mineral content but rather a lumped parameter driving the matrix stiffness. The specific values of this parameter for osteonal and interstitial tissues in the present study were defined based on the calculated elastic parameters and corresponding experimental data. An alternative could be to use empirical relationships between each matrix elastic coefficient and mineral content (Cai et al. 2020) or more sophisti-cated models (Hellmich et al. 2004; Hamed et al. 2010). The rationale for modeling the elasticity tensor with a single parameter is that experimentally, in a population of individuals without documented bone pathology, the collagen properties or the properties of the mineral crystals (such as cristallinity) are not correlated with elastic properties contrary to the mineral content (Cai et al. 2019b).
Another potential modeling issue is the bias introduced by the scheme to calculate effective properties. This, however, can be ruled out as we have shown that for a sufficiently large RVE (typically larger than (1.5)3 mm3) the upper (kinematic
uniform boundary conditions) and lower (static uniform boundary conditions) bounds of apparent properties are very close (Grimal et al. 2011a).
5 Conclusion
For typical experimental values of osteon thickness and realistic porous microstruc-tures, the error on effective elasticity due to neglecting the mineralized matrix heterogeneity (e.g., not distinguishing osteonal and interstitial tissue) is about 7% at the maximum. This suggests that matrix heterogeneity can likely be disregarded in cortical bone models in most practical cases. In particular, it seems less important to model this heterogeneity compared to (1) the individual-specific matrix elastic properties scaled to the average matrix mineral content and (2) the effect of the complex pore architecture which is not fully captured when the porosity is modeled
as a collection of ellipsoids or cylinders. These conclusions should hold for bone tissue without a specific pathology. The effect of matrix heterogeneity may however turn out to be more important in some pathologies (Roschger et al. 2008).
This work provides data to quantitatively discuss the handling of mineralized matrix heterogeneity in cortical bone elasticity models. The results should be helpful to guide the interpretation of effective elastic properties at the millimeter scale. These are involved in finite element models for the prediction of bone response to loads for the assessment of strength (van Rietbergen and Ito 2015; Engelke et al. 2016) or remodeling (Martelli et al. 2014). Experimentally-derived effective elastic coefficients can be used to determine mineralized matrix properties by inverse approaches (Sanz-Herrera et al. 2019; Cai et al. 2020). Finally, effective elasticity can also be probed in vivo with ultrasound, from which porosity can be estimated by an inverse approach (Minonzio et al. 2019).
Acknowledgements The authors would like to thank ESRF for the access of beamline at
ID 19 and 17 and the help from Cécile Olivier and Françoise Peyrin (CREATIS, CNRS 5220, INSERM U1206, Lyon) for performing SR-µCT experiments.
This work has received financial support from Engineering Department of Sorbonne Uni-versité (UFR 919).
Conflict of interest
The authors declare that they have no conflict of interest.
References
Baumann, A.P., Deuerling, J.M., Rudy, D.J., Niebur, G.L., Roeder, R.K., 2012. The relative influence of apatite crystal orientations and intracortical
poros-ity on the elastic anisotropy of human cortical bone. Journal of
Biome-chanics 45, 2743–2749. URL: http://dx.doi.org/10.1016/j.jbiomech.2012.09.011,
doi:10.1016/j.jbiomech.2012.09.011.
Blanchard, R., Dejaco, A., Bongaers, E., Hellmich, C., 2013. Intravoxel bone
micromechanics for microCT-based finite element simulations. J Biomech
46, 2710–2721. URL: http://dx.doi.org/10.1016/j.jbiomech.2013.06.036,
doi:10.1016/j.jbiomech.2013.06.036.
Boivin, G., Meunier, P.J., 2002. Changes in bone remodeling rate influence the degree of mineralization of bone. Connect Tissue Res. 43, 535–537.
Britz, H.M., Thomas, C.D.L., Clement, J.G., Cooper, D.M., 2009. The relation of femoral osteon geometry to age, sex, height and weight. Bone doi:10.1016/j.bone.2009.03.654. Broz, J.J., Simske, S.J., Greenberg, A.R., 1995. Material and compositional properties of
selectively demineralized cortical bone. Journal of Biomechanics 28, 1357–1368.
Cai, X., Brenner, R., Peralta, L., Olivier, C., Gouttenoire, P.J., Chappard, C., Peyrin, F., Cassereau, D., Laugier, P., Grimal, Q., 2019a. Homogenization of cortical bone reveals that the organization and shape of pores marginally affect elasticity. J. R. Soc. Interface 16, 20180911.
Cai, X., Follet, H., Peralta, L., Gardegaront, M., Farlay, D., Gauthier, R., Yu, B., Gineyts, E., Olivier, C., Langer, M., Gourrier, A., Mitton, D., Peyrin, F., Grimal, Q., Laugier, P., 2019b. Anisotropic elastic properties of human femoral cortical bone and relation-ships with composition and microstructure in elderly. Acta Biomaterialia 90, 254–266. doi:10.1016/j.actbio.2019.03.043.
Cai, X., Peralta, L., Brenner, R., Iori, G., Cassereau, D., Raum, K., Laugier, P., Grimal, Q., 2020. Anisotropic elastic properties of human cortical bone tissue inferred from inverse homogeniza-tion and resonant ultrasound spectroscopy. Materialia 11. doi:10.1016/j.mtla.2020.100730.
Cai, X., Peralta, L., Gouttenoire, P.J., Olivier, C., Peyrin, F., Laugier, P., Grimal,
Q., 2017. Quantification of stiffness measurement errors in resonant ultrasound
spectroscopy of human cortical bone. The Journal of the Acoustical Society of
America 142, 2755–2765. URL: http://asa.scitation.org/doi/10.1121/1.5009453
http://www.ncbi.nlm.nih.gov/pubmed/29195417, doi:10.1121/1.5009453.
Colabella, L., Ibarra Pino, A.A., Ballarre, J., Kowalczyk, P., Cisilino, A.P., 2017. Calculation of cancellous bone elastic properties with the polarization-based fft iterative scheme. Int J Numer Method Biomed Eng 33, e2879.
Cooper, D.M.L., Thomas, C.D.L., Clement, J.G., Turinsky, A.L., Sensen, C.W., Hallgrimsson, B., 2007. Age-dependent change in the 3D structure of cortical porosity at the human femoral midshaft. Bone 40, 957–965.
Crolet, J.M., Aoubiza, B., Meunier, A., 1993. Compact bone: numerical simulation of mechanical characteristics. Journal of Biomechanics 26, 677–87.
Dong, X.N., Guo, X.E., 2006. Prediction of cortical bone elastic constants by a two-level micromechanical model using a generalized self-consistent method. Journal of Biomechanical Engineering-Transactions of the Asme 128, 309–316.
Engelke, K., van Rietbergen, B., Zysset, P., 2016. FEA to Measure Bone Strength: A Review. Clinical Reviews in Bone and Mineral Metabolism 14, 26–37. doi:10.1007/s12018-015-9201-1. Gagliardi, D., Naili, S., Desceliers, C., Sansalone, V., 2017. Tissue mineral density measured at the sub-millimetre scale can provide reliable statistics of elastic properties of bone matrix. Biomechanics and Modeling in Mechanobiology 16, 1885–1910. doi:10.1007/s10237-017-0926-2.
Gagliardi, D., Sansalone, V., Desceliers, C., Naili, S., 2018. Estimation of the effective bone-elasticity tensor based on µCT imaging by a stochastic model. A multi-method validation. European Journal of Mechanics, A/Solids doi:10.1016/j.euromechsol.2017.10.004. Gauthier, R., Follet, H., Olivier, C., Mitton, D., Peyrin, F., 2019. 3D analysis of the osteonal
and interstitial tissue in human radii cortical bone. Bone doi:10.1016/j.bone.2019.07.028. Granke, M., Grimal, Q., Parnell, W.J., Raum, K., Gerisch, A., Peyrin, F., Saïed, A., Laugier,
P., 2015. To what extent can cortical bone millimeter-scale elasticity be predicted by a two-phase composite model with variable porosity? Acta Biomaterialia 12, 207–215. URL: http://dx.doi.org/10.1016/j.actbio.2014.10.011, doi:10.1016/j.actbio.2014.10.011. Granke, M., Grimal, Q., Saïed, A., Nauleau, P., Peyrin, F., Laugier, P., 2011. Change
in porosity is the major determinant of the variation of cortical bone
elas-ticity at the millimeter scale in aged women. Bone 49, 1020–1026. URL:
http://dx.doi.org/10.1016/j.bone.2011.08.002, doi:10.1016/j.bone.2011.08.002.
Grimal, Q., Raum, K., Gerisch, A., Laugier, P., 2008. Derivation of the mesoscopic
elasticity tensor of cortical bone from quantitative impedance images at the micron scale. Computer Methods in Biomechanics and Biomedical Engineering 11, 147–157. doi:10.1080/10255840701688061.
Grimal, Q., Raum, K., Gerisch, A., Laugier, P., 2011a. A determination of the minimum sizes of representative volume elements for the prediction of cortical bone elastic properties. Biomech Model Mechanobiol 10, 925–937. URL: http://dx.doi.org/10.1007/s10237-010-0284-9, doi:10.1007/s10237-010-0284-9.
Grimal, Q., Rus, G., Parnell, W.J., Laugier, P., 2011b. A two-parameter model of the effective elastic tensor for cortical bone. J Biomech 44, 1621–1625.
Hamed, E., Lee, Y., Jasiuk, I., 2010. Multiscale modeling of elastic properties of cortical bone. Acta Mechanica 213, 131–154.
Hellmich, C., Barthélémy, J.F., Dormieux, L., 2004. Mineral-collagen interactions in elasticity of bone ultrastructure - A continuum micromechanics approach. European Journal of Mechanics, A/Solids 23, 783–810. doi:10.1016/j.euromechsol.2004.05.004.
Hellmich, C., Ulm, F.J., 2004. can the diverse elastic properties of trabecular and cortical bone be attributed to only a few tissue-independant phase properties and their interactions? Biomechanics and Modeling in Mechanobiology 2, 219–238.
Lefèvre, E., Farlay, D., Bala, Y., Subtil, F., Wolfram, U., Rizzo, S., Baron, C., Zysset, P., Pithioux, M., Follet, H., 2019. Compositional and mechanical properties of growing cortical bone tissue: a study of the human fibula. Scientific Reports doi:10.1038/s41598-019-54016-1. Maggiano, I.S., Maggiano, C.M., Clement, J.G., Thomas, C.D.L., Carter, Y., Cooper, D.M., 2016. Three-dimensional reconstruction of Haversian systems in human cortical bone using synchrotron radiation-based micro-CT: Morphology and quantification of branching and transverse connections across age. Journal of Anatomy doi:10.1111/joa.12430.
Martelli, S., Kersh, M.E., Schache, A.G., Pandy, M.G., 2014. Strain
en-ergy in the femoral neck during exercise. J Biomech 47, 1784–
1791. URL: http://dx.doi.org/10.1016/j.jbiomech.2014.03.036,
doi:10.1016/j.jbiomech.2014.03.036.
Martínez-Reina, J., Pivonka, P., 2019. Effects of long-term treatment of denosumab on bone mineral density: insights from an in-silico model of bone mineralization. Bone 125, 87–95. doi:10.1016/j.bone.2019.04.022.
Minonzio, J.G., Bochud, N., Vallet, Q., Ramiandrisoa, D., Etcheto, A., Briot, K., Kolta, S., Roux, C., Laugier, P., 2019. Ultrasound-Based Estimates of Cortical Bone Thickness and Porosity Are Associated With Nontraumatic Fractures in Postmenopausal Women: A Pilot Study. Journal of Bone and Mineral Research doi:10.1002/jbmr.3733.
Moulinec, H., Silva, F., 2014. Comparison of three accelerated FFT-based schemes for computing the mechanical response of composite materials. Int. J. Num. Meth. Engng 97, 960–985. Moulinec, H., Suquet, P., 1998. A numerical method for computing the overall response of
nonlinear composites with complex microstructure. Comput. Methods Appl. Mech. Engrg. 157, 69–94.
Parnell, W.J., Grimal, Q., 2009. The influence of mesoscale porosity on cortical bone anisotropy. investigations via asymptotic homogenization. J. R. Soc. Interface 6, 97–109.
Parnell, W.J., Vu, M.B., Grimal, Q., Naili, S., 2012. Analytical methods to determine the effective mesoscopic and macroscopic elastic properties of cortical bone. Biomechanics and Modeling in Mechanobiology doi:10.1007/s10237-011-0359-2.
Raum, K., 2008. Microelastic imaging of bone. IEEE Transactions on Ultrasonics, Ferroelectrics, and Frequency Control 55, 1417–1431. doi:10.1109/TUFFC.2008.817.
Raum, K., Cleveland, R.O., Peyrin, F., Laugier, P., 2006. Derivation of elastic stiffness from site-matched mineral density and acoustic impedance maps. Physics in Medicine and Biology 51, 747–758.
Rho, J.Y., Tsui, T.Y., Pharr, G.M., 1997. Elastic properties of human cortical and trabecular lamellar bone measured by nanoindentation. Biomaterials 18, 1325–30.
van Rietbergen, B., Ito, K., 2015. A survey of micro-finite element
analy-sis for clinical assessment of bone strength: the first decade. J Biomech
48, 832–841. URL: http://dx.doi.org/10.1016/j.jbiomech.2014.12.024,
doi:10.1016/j.jbiomech.2014.12.024.
Roschger, P., Paschalis, E.P., Fratzl, P., Klaushofer, K., 2008. Bone
mineraliza-tion density distribumineraliza-tion in health and disease. Bone 42, 456–466. URL:
http://dx.doi.org/10.1016/j.bone.2007.10.021, doi:10.1016/j.bone.2007.10.021.
Sanz-Herrera, J.A., Mora-Macías, J., Reina-Romo, E., Domínguez, J., Doblaré, M., 2019.
Multiscale characterisation of cortical bone tissue. Applied Sciences (Switzerland)
doi:10.3390/app9235228.
Schindelin, J., Arganda-Carreras, I., Frise, E., Kaynig, V., Longair, M., Pietzsch, T., Preibisch, S., Rueden, C., Saalfeld, S., Schmid, B., Tinevez, J.Y., White, D.J., Hartenstein, V., Eliceiri, K., Tomancak, P., Cardona, A., 2012. Fiji: An open-source platform for biological-image analysis. doi:10.1038/nmeth.2019, arXiv:1081-8693.
Sevostianov, I., Kachanov, M., 2000. Impact of the porous microstructure on the overall elastic properties of the osteonal cortical bone. Journal of Biomechanics 33, 881–888.
Suquet, P., 1987. Homogenization Techniques for Composite Media (Lecture notes in Physics, vol. 272). Springer-Verlag. chapter “Elements of homogenization for inelastic solid mechanics”. pp. 194–278.
Zysset, P.K., Guo, X.E., Hoffler, C.E., Moore, K.E., Goldstein, S.A., 1999. Elastic modulus and hardness of cortical and trabecular bone lamellae measured by nanoindentation in the human femur. Journal of Biomechanics 32, 1005–1012.
Microstructure (θ ) Osteon thic kness (e ,µ m ) Elastic material inside po res Elasticit y of osteonal tissue Elasticit y of in terstitial tissue A ccording to a high-resolution image (25 samples) 35 ;70 ; 10 5 ;140 Bulk mo dulus 2. 2 GP a, nul lshear mo dulus. C m ;O = C m(f O ha = 0. 4) . C m ;I= C m(f I ha = 0. 43)
Table 1: Summary of parameters of the representative volume element. Elasticity tensors of osteons Cm;Oand interstitial tissue Cm;I are calculated with a
e (µm) 35 70 105 140 ∆Ce11/Ce11(%) 1.05 2.94 4.75 5.84 ∆Ce33/Ce33(%) 1.1 3.22 5.42 6.97 ∆Ce23/Ce23(%) 0.94 2.51 3.87 4.78 ∆Ce44/Ce44(%) 1.34 3.77 5.92 7.4 ∆Ce66/Ce66(%) 1.24 3.64 5.16 6.64
Table 2: Relative difference averaged over all microstructural samples with porosities ranging from 3 to 20% for different osteon thicknesses e (See the definition of ∆ eC/ eC