HAL Id: hal-01769211
https://hal.archives-ouvertes.fr/hal-01769211
Submitted on 17 Apr 2018
HAL is a multi-disciplinary open access
archive for the deposit and dissemination of
sci-entific research documents, whether they are
pub-lished or not. The documents may come from
teaching and research institutions in France or
abroad, or from public or private research centers.
L’archive ouverte pluridisciplinaire HAL, est
destinée au dépôt et à la diffusion de documents
scientifiques de niveau recherche, publiés ou non,
émanant des établissements d’enseignement et de
recherche français ou étrangers, des laboratoires
publics ou privés.
Influence of the degree of mineralization of the cortical
bone on toughness
Marc Gardegaront, Rémy Gauthier, Delphine Farlay, Sébastien Rizzo, David
Mitton, Hélène Follet
To cite this version:
Marc Gardegaront, Rémy Gauthier, Delphine Farlay, Sébastien Rizzo, David Mitton, et al.. Influence
of the degree of mineralization of the cortical bone on toughness. 42e Congrès de la Société de
Biomécanique, Nov 2017, Reims, France. pp. 87-88, �10.1080/10255842.2017.1382874�. �hal-01769211�
Full Terms & Conditions of access and use can be found at
http://www.tandfonline.com/action/journalInformation?journalCode=gcmb20
Computer Methods in Biomechanics and Biomedical
Engineering
ISSN: 1025-5842 (Print) 1476-8259 (Online) Journal homepage: http://www.tandfonline.com/loi/gcmb20
Influence of the degree of mineralization of the
cortical bone on toughness
M. Gardegaront, R. Gauthier, D. Farlay, S. Rizzo, D. Mitton & H. Follet
To cite this article: M. Gardegaront, R. Gauthier, D. Farlay, S. Rizzo, D. Mitton & H. Follet (2017) Influence of the degree of mineralization of the cortical bone on toughness, Computer Methods in Biomechanics and Biomedical Engineering, 20:sup1, 87-88, DOI: 10.1080/10255842.2017.1382874 To link to this article: https://doi.org/10.1080/10255842.2017.1382874
© 2017 The Author(s). Published by Informa UK Limited, trading as Taylor & Francis Group
Published online: 27 Oct 2017.
Submit your article to this journal
Article views: 77
View related articles
Computer methods in BiomeChaniCs and BiomediCal engineering, 2017 Vol. 20, no. s1, s87–s88
https://doi.org/10.1080/10255842.2017.1382874
Influence of the degree of mineralization of the cortical bone on toughness
M. Gardegaronta, R. Gauthierb, D. Farlaya, S. Rizzoa, D. Mittonb and H. Folleta
auniv lyon, université Claude Bernard lyon 1, inserm, lYos umr 1033, 69008 lyon, France; buniv lyon, université Claude Bernard lyon 1, iFsttar, lBmC umr_t9406, 69622 lyon, France
KEYWORDS degree of mineralization of bone; toughness; human cortical bone
1. Introduction
Bone quality and fracture prediction are dependent topics that have long been blurry, quite unreachable links to establish. The International Osteoporosis Foundation expects an increase of nearly three times more hip fractures in the population by 2050. Regarding this expectation, the MULTIPS project aims to predict the bone fracture risk by quantifying the bone quality using differ-ent methods. One of them is the Degree of Mineralization of the Bone (DMB (g.cm−3)) analysis by X-ray scanning of a 100 ± 1 μm
thick section of embedded bone.
The aim of the present study is to assess the effect of bone mineralization (DMB) on the toughness of the bone which is the propensity to resist to fracture.
2. Methods
2.1. Samples preparation
26 independent diaphysis of human femur were extracted from 26 donors (15 females, 11 males), ranging from 50 to 95 years old (median of 78). Each diaphysis was cut in different parts serving the purpose of each analysis method in the MULTIPS project (Figure 1).
From a first cut of 4 mm height of the lateral part, a second cut of 200 μm was obtained using a diamond saw in order to be polished, resulting in a 100 ± 1 μm thick section of cortical bone used for the DMB analysis.
The toughness analysis was previously done using a 25x2x1 mm3
height parallelepiped bone sample located just above (toward the proximal part) the 4 mm cut used for the DMB analysis (Gauthier
2017a). The notched bone sample was tested in a three-point bend-ing configuration in both quasi-static and dynamic loadbend-ing rates. Two parameters were evaluated: KIc (MPa.m0.5) which is the
tough-ness based on linear fracture mechanics, and KJc (MPa.m0.5), the
non-linear fracture mechanics toughness, including both elastic and plastic contributions.
2.2. X-ray analysis
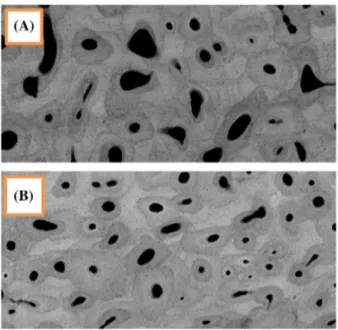
A prototype of X-ray scanner was used to digitalize grey level images of the sample representing the cartography of the DMB (Montagner et al., 2004) (Figure 2).
Each sample required around 40 pictures to be fully analysed, each picture being 3.0 mm x 2.2 mm (pixel size is 0.83 μm).
The conversion from grey level to DMB was done with an 8 step-edges aluminium standard. By assuming the intensity (grey level) is the same for hydroxyapatite and aluminium, the Beer-Lambert law (1) gives a linear function of conversion between the thickness of the aluminium (Al) and the density of apatite (ap) (2).
With: I0: Incident intensity, I: Transmitted intensity, K: ratio of linear attenuation coefficient and density, d: Thickness
If the function describing the intensity from the thickness of aluminium is known, then the function describing the density of hydroxyapatite is and gives a linear shaped function:6
With a and b, real coefficients from calibration.
One standard per day of experimentation was analysed, each resulting in a calculated conversion function with a coefficient of correlation always exceeding 0.99.
Each sample image was converted to DMB using its corre-sponding function and an average DMB level was determined for each sample.
2.3. Statistical tests
First a Mann-Whitney test was performed to assess the equiv-alence between the male and female groups. Hypothesis are verified as both groups are independent, responses are ordinal and the distribution of both groups are similar (two-sample Kolmogorov-Smirnov test). Then correlations were assessed by non parametric tests (Spearman coefficient).
3. Results and Discussion
The male and female groups are drawn from the same distri-bution as the Kolmogorov-Smirnov test gives a p-value of 0.34.
(1) I = I0⋅ e−K⋅𝜌⋅d (2) IAl =Iap ⇒ 𝜌ap=KAl∕ap⋅ 𝜌Al⋅ dAl dap DMB = 𝜌ap= a ∗ ln(GreyLevel) + b
© 2017 the author(s). published by informa uK limited, trading as taylor & Francis group.
this is an open access article distributed under the terms of the Creative Commons attribution license (http://creativecommons.org/licenses/by/4.0/), which permits unrestricted use, distribution, and reproduction in any medium, provided the original work is properly cited.
CONTACT h. Follet helene.follet@inserm.fr
S88 M. GARDEGARONT ET AL.
strength). As already proven with single trabeculae (Busse et al.,
2009), mechanical properties like toughness is influenced by the bone material composition, however the architecture of the bone also influence its apparent properties, making the differentiation of the macro-material and micro-material mandatory for any bone analysis. In the case of a bone fracture propagation study, the main scale might be the microscopic or nanoscopic one, implying there is a need to use the properties of the bone at the same scale.
4. Conclusions
The DMB is characteristic of the bone material, thus globally describing the material’s mechanical properties. However, the bone is highly heterogeneous and is the result of smooth and abrupt variation in its composition and geometry (interstitial bone, osteon, Haversian canals, porosity). As shown in our study, a global analysis of the bone material is not appropriate to determine a link between DMB and fracture behavior. Thus the localization of the fractures in a microscopic level should be known, in order to extract the correspondent DMB of the fracture’s environment.
Our current study of crack propagation using μCT, by imag-ing in high resolution (0.7 × 0.7 × 0.7 μm3 voxel size) the
frac-tured cortical bone, should fill this lack of information and allow a valid correlation study between DMB and fracture behavior (Gauthier 2017b).
Acknowledgements
This study was partly funded by the Région Auvergne-Rhône-Alpes and by the ANR project Multips (ANR-13-BS09-0006-01)
References
Busse B, et al. 2009. Increased calcium content and inhomogeneity of mineralization render bone toughness in osteoporosis: Mineralization, morphology and biomechanics of human single trabeculae. Bone. 45:1034–1043.
Follet H, et al. 2004. The degree of mineralization is a determinant of bone. Bone. 34:783–9.
Gauthier R, et al. 2017a. Strain rate influence on human cortical bone toughness: A comparative study of four paired anatomical sites. J. of the Mechanical Behavior of Biomedical Materials. 71:223–230.
Montagner F, et al. 2004. Validation of a novel microradiography device for characterization of bone mineralization. J. of X-ray Science and Technology. 23:201–211.
Gauthier R, et al. 2017b. Three-dimensional imaging of crack propagation mechanisms in human cortical bone on three paired anatomical locations. IBDW congress, oral presentation, Banz.
No difference was found between male and female for all parameters (s = 0.05, p = 0.08).
There is a negative trend between age and DMB (ρ spear-man = –0.39 (p = 0.052)).
No correlation was found between DMB and mechanical parameters (Table 1):
As it is not possible to follow the DMB evolution in function of age for a same patient, one way could be to compare the aver-age DMB of large enough same aver-age groups of donors.
Finally, no correlation was found between the toughness’ parameters indicating the behavior of fractures is not directly related to the DMB. These results could partially be in disagree-ment with our previous work on human trabecular bone (Follet et al., 2004), with correlation between the DMB and the maximal strength which is not quantifying the same property compared to toughness. However, the studies are based on two different archi-tectural bones (trabecular and cortical), in particular, the porosity of a material is of great importance in its mechanical apparent properties (i.e. the apparent Young’s modulus and maximal Figure 1. Cutting procedure for toughness and dmB analysis.
Figure 2. grey level images of two thick sections of cortical bone used for dmB analysis. (a) female 91 y.o. (B) male 67 y.o. same scale, contrast and luminosity parameters.
Table 1. Correlations between dmB and toughness’ parameters. p-value in brackets.
KIc,static KIc,dynamic KJc,static KJc,dynamic ρspear. −0.33 (0.12) 0.04 (0.84) −0.18 (0.41) −0.20 (0.33)