Development of a high-speed
profilometer for manufacturing inspection
The MIT Faculty has made this article openly available.
Please share
how this access benefits you. Your story matters.
Citation
Dean M. Ljubicic and Brian Anthony, "Development of a high-speed
profilometer for manufacturing inspection", Proc. SPIE 7767, 776705
(2010); doi:10.1117/12.860166 © 2010 COPYRIGHT SPIE
As Published
http://dx.doi.org/10.1117/12.860166
Publisher
SPIE
Version
Final published version
Citable link
http://hdl.handle.net/1721.1/60936
Terms of Use
Article is made available in accordance with the publisher's
policy and may be subject to US copyright law. Please refer to the
publisher's site for terms of use.
Development of a high-speed profilometer for manufacturing
inspection
Dean M. Ljubicic, Brian Anthony
Massachusetts Institute of Technology, 77 Massachusetts Ave., Cambridge, MA USA 02139
ABSTRACT
Optical digital-imaging techniques offer a fast, high-resolution, and wide-range metrology capability for measuring semi-transparent and transparent polymer-based devices during manufacture. This work presents novel instrumentation for in-process statistical control and metrology capable of measuring a complete macroscale part (~25 mm) down to its microscale features (~50 μm). The high speed 2.5D profilometer has generated contour plots with 0.4 μm lateral and 1 μm vertical resolution. The instrument has an estimated data rate of 8 million 3D data points per second, approximately 270 times faster than conventional white light interferometry.
Keywords: High speed profilometer, 3D imaging, microfluidic devices, depth from focus
1. INTRODUCTION
The use of optical detection to rapidly acquire 3D surface profiles allows for high-speed, non-contact metrology. This ability is critical to manufacturing lines that desire in-process profilometery for both quality and statistical process control. A new research effort at MIT requires this functionality to produce polymer-based microfluidic devices in an automated manufacturing line [1]. The metrology instrument needed to fulfill this task must scan large areas at high speeds with submicron resolution.
Although many commercial products and research have demonstrated instruments that obtain two of these aims, arguably none have attained all three. Profilometers that use structured light to measure a sample provide high speed scanning, but bottom out at five micron resolution [2]. Conversely white light interferometers provide submicron resolution at low speeds [3]. Lan and Jin-Liang proposed using a white light interferometer in a tilted orientation; the ultimate speed of the instrument was inconclusive [4]. The notion of 3D reconstruction via SEM has also been explored but is slow speed and the need for vacuum make it inappropriate for a manufacturing environment [5]. A new profilometer designed for high acquisition rates is required to meet the needs of the microfluidic device manufacturing. The instrument detailed in this paper combines high speed photography, depth from focus image processing [6], and a novel geometrical configuration to rapidly generate 3D surface profiles.
2. SPECIFICATIONS
The high speed profilometer was designed and built to provide the metrology needs of a novel manufacturing process dubbed “MicroFactory” or “muFac.” The goal of the process is to make a manufacturing line for microfluidic devices out of PMMA plastic. The devices are roughly 25mm x 25mm and have a cycle time of two minutes. The entire face of each part needs to be captured in a 3D contour plot with submicron lateral resolution. This translates to a data rate of 25 million measured 3D data points per second. Table 1 compares the requirements of muFac versus state of the art metrology equipment including the high speed profilometer.
Table 1. Performance of the high speed profilometer versus commercial products. Min Lateral Resolution (μm) Min Vertical Resolution (μm) Data Rate (points/sec) Requirements 0.5 0.5 25,000,000 Structured Light 5.0 0.1 11,000,000 White Light Interferometer 0.5 0.01 30,000 High Speed Profilometer 0.5 1.0 8,000,000*
* Indicates estimated value
3. EXPERIMENTAL SETUP
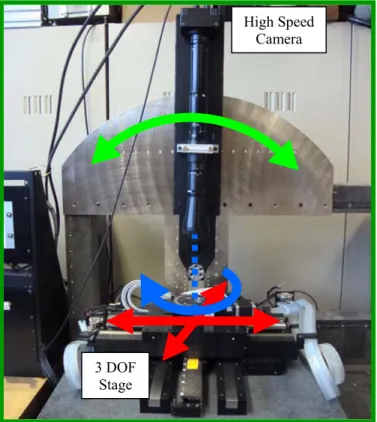
The high speed profilometer requires precision mechanical motion with submicron repeatability over macroscale distances. The motions of the camera and the part are illustrated in Figure 1. In order to obtain measurements over a large area, the camera and polymer device must move relative to each other. We choose to keep the camera and lens apparatus stationary during scans given its large mass. Two stacked air bearing stages indicated in red were used to move the part in the X, Y plane which allowed for large displacement, submicron repeatability, and 40 MHz bandwidth feedback on X, Y position. A rotational stepper-motor stage sits on top of the linear air-bearing stages, shown in blue, allows for automated movement of the part in all in-plane degrees of freedom. Lastly, the camera is secured to a rotational arm which allows for adjustment of the incidence angle of the camera upon the part along the green arrow.
Figure 1. The automated motions of the part are illustrated in blue and red while the manual adjustment of the camera is illustrated in green.
High Speed Camera
3 DOF Stage
4. SIMULTANEOUS CAPTURE OF DEPTH PLANES
In many ways, the high speed profilometer and white light interferometer work upon similar principles. Both instruments resolve submicron features by using of high powered microscope. These objectives are constrained to a shallow depth of field which is ultimately exploited to measure depth. Scans in the X-Y plane are taken at various depths in order to capture the 3D contour of a given volume. Conventional white light interferometers must mechanically scan through all Z depths in series before relocating their X,Y position to scan the adjacent volume. The high speed profilometer is able to capture all Z depths in parallel while scanning the X, Y field in one continuous motion. This parallel and continuous imaging strategy coupled with high speed photography allows our instrument to attain data points at an estimated 270 times faster than conventional white light interferometery.
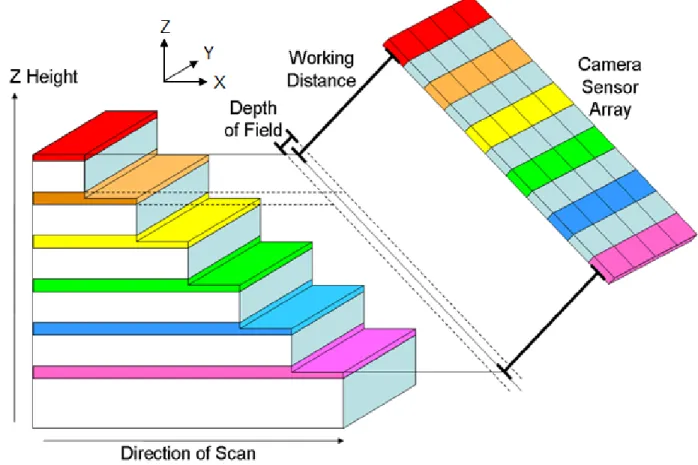
The high speed profilometer is able to capture multiple Z depths in parallel by use of an area camera positioned in a tilted orientation with respect to the part. As shown in Figure 2, each row of pixels in the camera sensor is located at a discretely spaced Z height. Similarly, each row of pixels comes into focus at a discretely spaced Z height at a working distance away from the final lens in the microscope objective. If only one row of pixels was programmed to collect data, this instrument would work similarly to a line scanner whereby one line of the object is photographed at programmed intervals. An image is formed by the compiling a sequence of lines into one picture. By recording from multiple rows on a tilted sensor, we have the ability to take multiple line scans in parallel, all of which are focused at a different depth. Each line of colored blocks in Figure 3 represents a line of pixels that extend into the Y dimension that all focus at the same Z depth.
Figure 2. The rows on camera sensor shown in the schematic on the right focuses on an independent Z height. Movement of the part in the scan direction allows multiple line scans to be taken in parallel.
5. SAMPLE PART
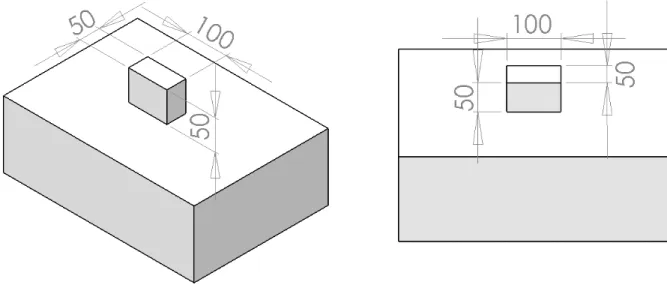
In order to illustrate the capability of the high speed profilometer, we chose to image a fairly basic part. The sample was micromilled out of an aluminum plate. We focus on a plateau that stands 50 μm tall, 100 μm wide, and 50 μm deep. The feature is oriented normal to the camera such that its side walls are eclipsed with only its front and top faces visible. The machining marks made by the micromill makes the surface textured and leaves an entire field of fiducials which helps the profilometer identify the height of the part. Figure 2a shows an orthogonal view of the part while Figure 2b shows the part as viewed by the camera.
Figure 3. The figure on the left shows an isometric view of the sample part that was measured. The figure on the right shows the same part from the angle it was captured.
6. MEASUREMENT OF HEIGHT
A 3D contour plot of the part is developed by combining the information from scans that focus at different heights. Figure 4 shows six selected Z-plane images corresponding with the rows selected in Figure 3. Each row of pixels comes into focus at a specific Z-plane, or a narrow volume that extends along the X,Y axis. When the object intersects this plane, the features on that object will become in focus. By determining which Z-plane is most in focus, we can determine the height of the object for each X, Y coordinate.
An algorithm was used to determine which Z-plane scan was most in focus. In focus images will have high contrast compared to images that are out of focus and blurred. For each point in the image, the focus algorithm first selects the neighboring in-plane values. Then, the standard deviation of these neighboring values is calculated. A high standard deviation translates into high contrast which is used as a measure of how in focus the images are at that specific point. The height of any specific X, Y point was selected to be at the Z-plane with the highest standard deviation. Figure 4 shows local standard deviation of the selected Z-plane scans.
7. HEIGHT MAP AND EXTENDED DEPTH OF FIELD
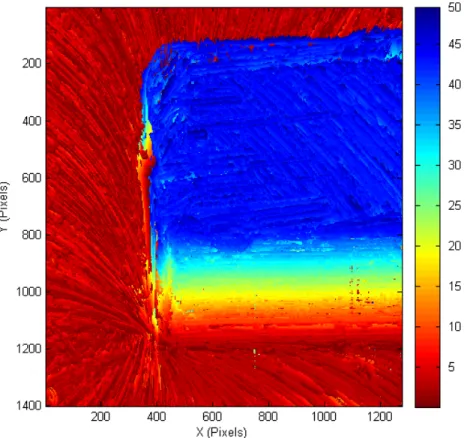
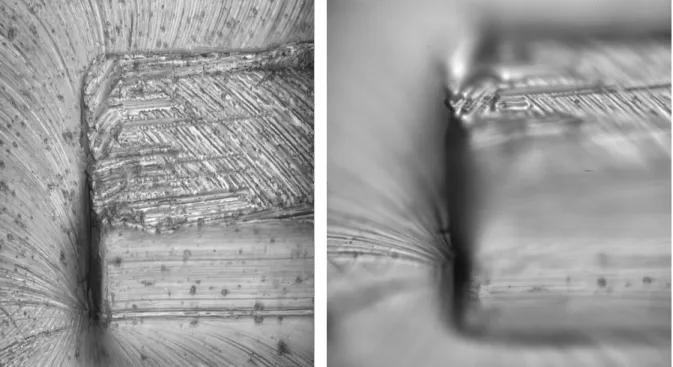
The high speed profilometer uses the results from the standard deviation algorithm to both create a contour map as well as provide extended depth of field imagery. We first show in Figure 5 the contour map of our sample where color has been assigned to represent height. Our contour map also indicates for each pixel which Z-plane was most in focus. Using this information we compile an image where the value of each pixel was chosen from the most in focus Z-plane. In Figure 6, this compiled image is compared against a raw data image taken from the area camera to illustrate the extended depth of field.
Figure 4. Each height slice shows is a line scan taken at an independent Z height. A high pass filter detects high contrast within the image. The “focus detection” plots are used to measure the topography of the part.
Figure 6. Extended depth of field picture (left) juxtaposed against a raw image frame taken from the high speed camera. Many of the parts we are interested in scanning can contain channels or extrusions, as seen in the sample part above. When imaging these samples, there can be large portions that are eclipsed from the camera’s sight. By taking images from multiple angles, we can capture the complete topology of the features. We used three different camera angles create the contour map seen in Figure 7. Each camera angle is denoted by its red, green, or blue color.
8. SIDE WALL IMAGING
Another benefit of the high speed profilometer is its unique ability to measure vertical sidewalls. We chose the sample object in part to demonstrate this capability. To more clearly depict this measurement, we selected one horizontal line from each contour map in Figure 7 and plotted it in Figure 8. As seen in the figure, no one scan can detail the complete contour of the extrusion because its view becomes eclipsed by the part. The Z resolution is approximately 1 μm.
Figure 8. One slice of the 3D plot shown in Figure 7. The three different colors denote three different viewing angles.
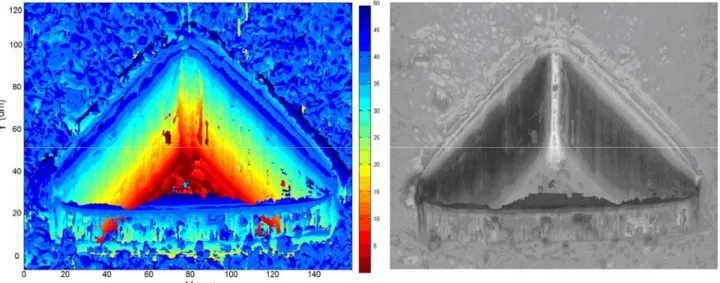
9. TRANSPARENT PARTS
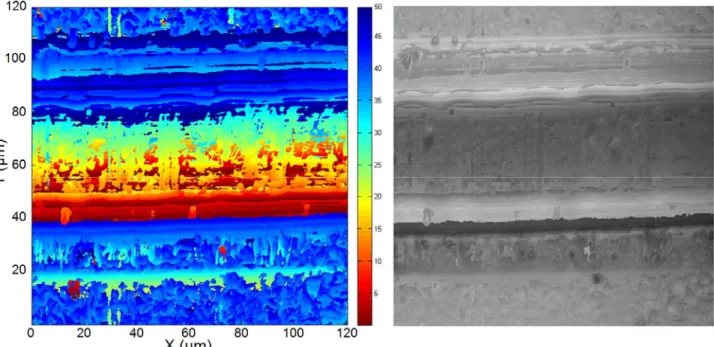
The final goal of the muFac project is to measure transparent microfluidic devices. We began by measuring the sample part because its surface is rich in features and contrast. Also, the metal’s opacity eliminates strange shadow effects exhibited when looking through the transparent parts. Although preliminary images have been taken on PMMA plastic, the data is too noisy to represent in a 3D reconstruction. We found the Z resolution while measuring transparent parts to be 2.5 microns which is substantially larger than the 1 micron resolution measured on the metallic part. Figure 9 and 10 show the height map and extended depth of focus view of a triangular recess and channel in PMMA plastic.
Figure 10. Height map and extended depth of focus image of channel in transparent PMMA plastic.
10. CONCLUSION
We have demonstrated imaging capability from a novel profilometer that has comparable resolution to a white light interferometer at 270 times the data rate. The instrument is also capable of forming a grayscale image of an object with an extended depth of field. Furthermore, the high speed profilometer has the unique capability of measuring vertical sidewalls on the parts being measured.
REFERENCES
[1] Anthony, Brian W.; Hardt, David E.; Hale, Melinda; Zarrouati, Nadege. "A research factory for polymer microdevices: muFac.” Microfluidics, BioMEMS, and Medical Microsystems VIII. Proceedings of the SPIE, Volume 7593, pp. 75930A-75930A-12 (2010).
[2] “Prime." 2009. <kohyoung.com>.
[3] Caber, Paul J. "Interferometric Profiler for Rough Surfaces." Applied Optics 32.19 (1993): 3438-41.
[4] Lan, Yu-Ying; Jin-Liang Chen; Wei-Cheng Wang. "Large-Scale 3-D Profilometer." Conference on Applications of Digital Image Processing XXXI. San Diego, CA, AUG 11-14, 2008.
[5] Marinello, F.; P. Bariani; E. Savio. "Critical Factors in SEM 3D Stereo Microscopy." Measurement Science and Technology 19.6 (2008): 1-12.