DEVELOPING A FRAMEWORK FOR DEPENDABLE DEMAND FORECASTS IN THE
CONSUMER PACKAGED GOODS INDUSTRY
By
MASSACHUSOF TEC
Daniel Antonio Uriarte
JUN
0
B.S. Chemical Engineering
LIB
University of Florida, 2000
Submitted to the MIT Sloan School of Management and the Department of Engineering
Systems in Partial Fulfillment of the Requirements for the Degrees of
Master of Business Administration
AND
Master of Science in Engineering Systems
in conjunction with the Leaders for Global Operations Program at the
Massachusetts Institute of Technology
June 2010
© 2010 Massachusetts Institute of Technology
All rights reserved
Signature of Author
Certified by
Certified by
Accepted by
ARCHMVS
May 21, 2010
Engineering Systems DivisiopflT Slopn Sphpl oflanagement
Cgri
aplice Thesis Supervisor
Principal Research Associate, Engineering Systems Division
' Donald B. Rosenfield, Thesis Supervisor
Director, Leaders
Global Operations Program
Senior Lerger,
SJoa School of Management
Nancy Leveson
Education Committee Chair, Engineering Systems Division
Professor, Aeronautgs and Astronaut',
REngineering Systems Division
07
Accepted by
Debbie Berechman
Executive Director, MIT Sloan MBA Program
ETTS INSTIftVTE HNOLOGY
8
2010
ARIES
DEVELOPING A FRAMEWORK FOR DEPENDABLE DEMAND FORECASTS IN THE
CONSUMER PACKAGED GOODS INDUSTRY
By
Daniel Antonio Uriarte
Submitted to the MIT Sloan School of Management and the Department of Engineering Systems on May 7, 2010 in Partial Fulfillment of the Requirements for the Degrees of
Master of Business Administration and Master of Science in Engineering Systems
ABSTRACT
As a consumer packaged goods company, "Company X" manufactures products "make-to-stock"; therefore, having reliable demand forecasts is fundamental for successful planning and execution. Not isolated to "Company X" or to the CPG industry, current global economic conditions have forced companies to seek increased cash flows as a method for weathering this financially difficult period. As a result, many organizations are pursuing improvements in demand forecasting and planning methodologies as a precursor to inventory optimization and to further liquidity positions. This thesis attempts to improve forecasting and planning processes by developing a framework that focuses on four general components indentified as key for success by experts and practitioners. In addition, this thesis explores these components while utilizing "Company X" as the case study for improvement. The four forecasting and planning components explored at "Company X" include Data Treatment, Forecast Models, Planning Process, and Organizational Behavior.
In the Data Treatment section, we present implications of data aggregation in forecasting and planning activities, as well as provide a methodology to segment SKU's for prioritization during forecasting and planning. While in the Forecast Models section, we explore various forecasting models applied during different stages of the product lifecycle, and utilize these models under "least error" selection with sales data at different levels of aggregation to determine which combination results in the most accurate forecast.
Moreover, in the Planning Process section, we explore the Sales and Operations Planning methodology, and provide a set of best practices to design a planning process that meets the requirements of "Company X". Lastly, in the Organizational Behavior section, we depict the "Company X's" planning process and organization, and highlight some of the behaviors typically observed during forecasting and planning activities.
Although most of the proposed components provided forecasting and planning improvements over the legacy method, not all of these were implemented at "Company X". Nevertheless, the
implemented improvements provided a forecast error reduction from 17% to 10% over the life of the project. However, these improvements were not equal for all SKU segments, as B segment SKU's, or medium criticality products, benefited the most from the execution of this project.
Thesis Supervisor: Chris Caplice
Title: Principal Research Associate, Engineering Systems Division Thesis Supervisor: Donald B. Rosenfield
Title: Senior Lecturer, MIT Sloan School of Management
ACKNOWLEDGEMENTS
I would like to begin by thanking the staff of "Company X" for their support during the research and
analysis stage of this project. Without your support, it would have been impossible to gain an extensive understanding of the organization, as well as its practices and competitive landscape. From the MIT Community, I want to express my sincere gratitude to my thesis advisors, Chris Caplice and Don Rosenfield, for fostering my curiosity and enabling ideas for the development of the "Company X" solution. I also want to recognize Roy Welch and Roberto Fernandez for providing key insights before and during the internship period. Moreover, I would like to thank my classmates in the LGO Class of 2010 for making the last two years most memorable.
Lastly, I would like to thank my parents, Carlos and Grace, and most importantly, my spouse
Valeria, for the unconditional love and support they have provided throughout my life, and specially during the last few years, thus making this opportunity possible. For this, I am eternally indebted to
you.
TABLE OF CONTENTS
Abstract ...
3
Acknow ledgem ents ...
5
Table of Contents ...
7
List of Figures ...
9
List of Tables...11
List of Equations...12
1
Introduction ...
13
1.1 Thesis M otivation...131.2 Problem Statem ent ... 15
1.3 Chapter Outline ... 16
2
Background...17
2.1 Com pany Background: "Com pany X" ... 17
2.2 M arket Landscape ... 18
2.3 Supply Chain Overview ... 22
2.4 Dem and Forecasting and the "Bullw hip" Effect ... 25
3 Legacy Planning Process ...
28
3.1 Planning M ethodology by Function... 28
3.2 Market Oriented Organization Planning Meeting -Sales Quota Negotiation...33
3.3 M etrics and Feedback... 35
4 Forecasting & Planning Problem ...
36
4.1 Assessm ent of Current State... 36
4.2 Proposed Solution ... 42
5 Data Treatm ent ...
44
5.1 Aggregation and Disaggregation...44
5.2 Portfolio Segm entation ... 46
6 Forecast M odeling ...
53
6.1 Product Life Cycle...53
6.2 Product Introduction - Qualitative Methods and Forecast Error Estimation Model...54
6.3 Product Grow th and M aturity - Sm oothing M odels... 56
6.4 Product Prom otions - M ultivariate Regression M odels... 62
6.5 Product Decline - Geometric Model and All-Time Future Requirement...64
6.6 Forecasting M odel Selection ... 66
6.7 Com bining Forecasts...69
6.8 Forecast M ethod Com parison ... 72
7 Sales & Operations Planning...
73
7.1 Process Fram ew ork...73
7.2 Building the Foundation...74
7.3 Where should the S&OP process reside and who should participate... 76
7.4 Design of a Sales and Operations Planning Process at "Company X"...77
8 Organizational Behavior Observations and Considerations...
85
8.1 Three Lens Analysis...85
8.2 Organizational Behavior look into Forecast Bias ... 90
9 Process Im provem ent Results...
95
10
Recom m endations for Future Activities ...
98
10.1 Inventory M anagem ent ... 98
10.2 M arket Gam e Theory for the M odern Channel ... 98
11
Conclusion ...
100
11.1 Sum m ary... 100
11.2 Could w e have foreseen this drop in sales?... ... .... ... ... .... .... ... .... ... . 100
Glossary...
103
LIST OF FIGURES
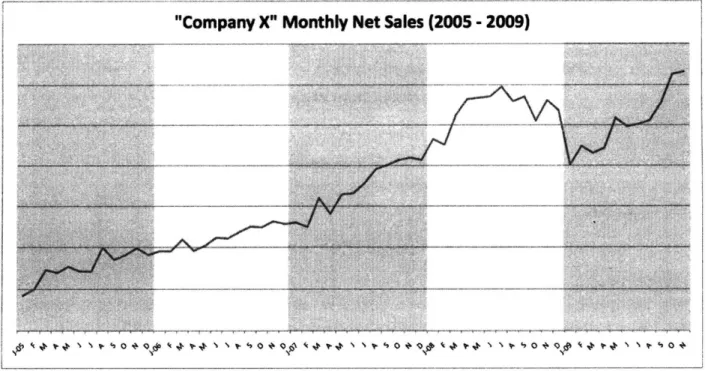
Figure 1 -"Com pany X" M onthly N et Sales ... 13
Figure 2 -Top 10 Supply Chain Projects due to Economic Crisis (Haarman et al., 2009)... 14
Figure 3 -"Com pany X" Product H ierarchy ... 19
Figure 4 - Production of Type A Products ... 22
Figure 5 - Production of Type B Products ... 23
Figure 6 -SKU1 "Bullwhip" Effect at "Company X" ... 26
Figure 7 -Model of Make-to-Stock inventory management system (Sterman, 2006)...27
Figure 8 - "Com pany X" Planning Cycle ... 28
Figure 9 -Sales Quota Development Process: Sales Traditional Trade... 29
Figure 10 -Sales Quota Development Process: Sales Modern Trade ... 30
Figure 11 -Sales Quota Development Process: Marketing Traditional Trade ... 31
Figure 12 -Sales Quota Development Process: Marketing Modern Trade ... 31
Figure 13 -Sales Quota to Demand Forecast Resolution Process: Supply Chain...32
Figure 14 -Commercial Sales Quota Negotiation Structure... 33
Figure 15 -Historical Sales Cases Signal for SKU2 at Country Level and Channel Levels... 45
Figure 16 -Product Segment 1 ABC Classification ... 47
Figure 17 -Product Segment 1 Volume-Variability Segmentation ... 48
Figure 18 -Representation of Product Life Cycle (Levitt, 1965)... 54
Figure 19 -"Company X" Category 1 Average Demand-Standard Deviation Correlation ... 55
Figure 20 -Seasonal Product 1 Demand Pattern ... 60
Figure 21 -SKU3 Multivariate Regression Model Results... 64
Figure 22 -Sales and Operations Planning Process (Wallace and Stahl, 2008) ... 73
Figure 23 -Consumer Goods Industry S&OP Participation by Function ... 77
Figure 24 -Proposed S&OP Calendar for "Company X" ... 79
Figure 25 -"Company X" Forecast Error (Jan-Aug 2009)... 83
Figure 26 -"Company X" Forecast Hit Rate (Jan -Aug 2009)... 84
Figure 27 -"Company X" Forecast Bias (Jan -Aug 2009)... 84
Figure 28 -"Company X" Functional Organization... 86
Figure 29 -"Com pany X" M O Organization...87
Figure 30 -Country Level Sales vs. Forecast (Jan 2008 -Nov 2009)... 92
Figure 31 -Product Segment 1 Sales vs. Forecast (Jan 2008 - Nov 2009) ... 93
Figure 32 -Product Segment 4 Sales vs. Forecast (Jan 2008 - Nov 2009) ... 93
Figure 33 -"Company X" Forecast Error (Jan - Nov 2009) ... 95
Figure 34 -"Company X" Forecast Hit Rate (Jan - Nov 2009)... 96
Figure 35 -"Company X" Forecast Error by Portfolio Segment (Jan - Nov 2009)...96
Figure 36 -"Company X" Forecast Hit Rate by Portfolio Segment (Jan - Nov 2009)...97
Figure 37 -"Company X" Forecast Bias (Jan - Nov 2009)... 97
LIST OF TABLES
Table 1 -Representation of Country Sales Quota ... 34
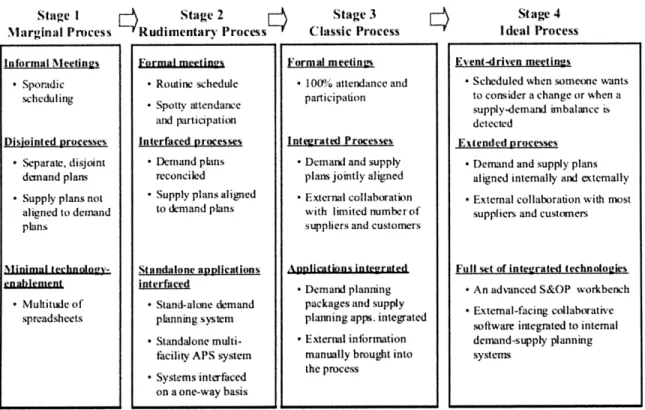
Table 2 -Four-Stage S&OP Process Maturity Model (Lapide, 2005, Spring)...37
Table 3 -S&OP Integration Framework (Grimson and Pyke, 2007) ... 38
Table 4 -Product Segment 1 Business Weighted Segmentation... 50
Table 5 -Planning Strategy per Segmentation Quadrant ... 51
Table 6 -Product Segment 1 Segmentation Classification...52
Table 7 - Independent Variable Time Series for Product Segment 1 SKU Cluster in MGR Chain1...63
Table 8 -Monthly Country Forecast Error ("Company X" WAPE) using various Error Metrics...68
Table 9 -Product Segment 1 Forecast Errors for Country Level, Channel Level, and Weighted C o m b in ed F o reca sts...7 1 Table 10 -Results of Forecast M ethod Com parison ... 72
Table 11 -Pros and Cons of Forecast Process Residence by Function ... 76
Table 12 -Proposed S&OP Process Planning Tool for "Company X"... 80
Table 13 -Forecast Bias by Product Segment and Market Channel (2009)... 94
LIST OF EQUATIONS
Equation 1 -Inventory Equation...15
Equation 2 -"Company X" W eighted Absolute Percentage Error Metric ... 35
Equation 3 -Forecast Period vs. Replenishment Lead Time Standard Deviation Relationship...50
Equation 4 -Generalized Power Rule...55
Equation 5 -Generalized Power Rule (Logarithmic form) ... 55
Equation 6 -Horizontal Model ... 56
Equation 7 - Simple Moving Average...56
Equation 8 -SMA Update Formulation...57
Equation 9 -Average Demand Estimate and Forecast... 57
Equation 10 -W eighted Moving Average...57
Equation 11 -Simple Exponential Smoothing...58
E q u atio n 1 2 -T ren d M o d el...5 8 Equation 13 -Two-Parameter (Holt) Exponential Smoothing... 59
Equation 14 -Holt Model Initialization Values ... 59
Equation 15 -Brown Smoothing Constants ... 59
Equation 16 -Seasonal M odel ... 61
Equation 17 -Holt-W inters Smoothing Constants ... 61
Equation 18 -SKU3 Multivariate Regression Expression ... 64
Equation 19 -Terminal Demand Geometric Model ... 65
Equation 20 -Terminal Demand Geometric Model (Logarithmic form)... 65
Equation 21 -Terminal Demand All-Time Future Requirement... 65
Equation 22 -Mean Absolute Deviation...66
Equation 23 -Mean Square Error ... 67
Equation 24 -Mean Absolute Percentage Error ... 67
Equation 25 -Durbin-W atson Test Statistic...69
Equation 26 -Proposed Forecast Hit Rate Metric ... 81
1 INTRODUCTION
1.1
Thesis Motivation
The first quarter of 2009 was a very difficult period for "Company X", as the organization
experienced a significant drop in sales never observed before in its recent history. During this
period, quarter-to-quarter sales from 4Q 2008 to 1Q 2009 were reduced by a double-digit
percentage. For an operation accustomed to year-to-year double-digit percentage growth, this sales
adjustment was both significant and unexpected.
To cope with this new sales environment, believed to be the result of global economic conditions by
local managers, "Company X" took drastic measures. The planning team, whose responsibilities
include the sourcing of imported raw materials and finished goods from other "Company X" sites,
cancelled purchase orders with future delivery dates to mitigate excess stock. However, since many
of these goods were ordered months in advance due to their extended lead times, a medium-term
overstock position was inevitable. Concurrently, "Company X's" manufacturing team, whose plants
operate under 24-7 schedule, lowered production output by executing weekly partial shutdowns.
As a result of this sudden drop in demand, as well as the significant operational adjustments
undertaken by the organization, many employees began to ask themselves: "Could we have
foreseen this?"
"Company X" Monthly Net Sales (2005 - 2009)
Figure 1 - "Company X" Monthly Net Sales
Just like "Company X', many manufacturing organizations today are rethinking their supply chains in order to gain further efficiencies from their enterprise. More importantly, organizations see these supply chain efficiency projects as cornerstone to weathering current global economic conditions, as indicated by a Capgemini Consulting survey of 300 multinational companies. (Haarman, den Exter, van der Schaar, & van Heijst, 2009) Some of most popular projects undertaken by the
surveyed organizations include Supply Chain Strategy, Improvements of Long-Term Forecasting & Planning, and Network Redesign. (Haarman et al., 2009) Although long-term projects are still considered important, current economic conditions have shifted the focus of organizations to projects such as Inventory Optimization and Sales and Operations Planning, as these can provide rapid short-term cost reductions and free working capital. (Haarman et al., 2009) Central to the success of both Inventory Optimization and Sales & Operations Planning initiatives is Demand Forecasting.
Top 10 Supply Chain Projects
1. lnventory Optimization 2.Supply chain strategy project 3.Improve long term forecasting /planning 4.Network redesign 5.lmprove supply chain visibility
45
144%
6. Sales and Operation Planning
7. Contract renewal strategic logistic prtner(s) 8 Warehouse centralisatloi or decentralisation
9.
Sustainability
program
1
10, Outsourcing of logistic services 2(Multiple answers per participant allowed) 0% 10% 20% 303 40% 50% 60%
Shift
in
Top 10 Supply
Chain Projects
due to crisis
1. Inentory Optimization ggiiggi
2. Supply chain strategy project -14 W 3 Improve long term forecasting /planning 4
4. Network redesign
5J mprove supply chain visibility dgll6
6.Sales and Operation Planning 5%S
7.Contract renewal strategic Lgiic p rtner(s) 11%
8. Warehouse centralisation or decentalisation
9.Sustainabilit program
10. Outsourcing of gstc srvice
-20% -5% 410% -5 0% 5% 10% 15% 20%
For Inventory Optimization, Demand Forecasting has a dual role. First, it establishes "Cycle Stock" requirements in any given period, by taking into consideration both historical demand (i.e. trends and seasonality), and changing market conditions (i.e. promotional activities) for its calculation. Second, the demand forecast "Forecast Error" is key a component for determining the appropriate level of "Safety Stock" needed to meet customer required Service Level targets.
Cycl ock Safety Stock
Average Inventory
=
+ zod
2
yt = average demand
L = lead time z = service level factor o- = forecast error (RMSE)
Equation 1 -Inventory Equation
For Sales & Operations Planning, Demand Forecasting serves as the backbone of the process, providing "Baseline Forecasts" that are unbiased and central for collaborative planning discussions. Therefore, any initiative to reduce costs and working capital utilizing Inventory Optimization and
Sales & Operations Planning must start with the development of a sound Demand Forecasting process and methodology.
1.2 Problem Statement
As a consumer packaged goods company, "Company X" manufactures products "make-to-stock"; therefore, having reliable demand forecasts is fundamental for successful planning and execution.
Not isolated to "Company X" or to the CPG industry, current global economic conditions have forced companies to seek increased cash flows as a method for weathering this financially difficult period. As a result, many organizations, including "Company X", are pursuing improvements in demand forecasting and planning methodologies as a precursor to inventory optimization and to further liquidity positions.
1.3
Chapter Outline
The document is organized as described below:
Chapter 1 outlines the general motivation of the thesis and defines the problem experienced by the host organization.
Chapter 2 provides background information of the host organization, including history, market landscape, and a supply chain overview.
Chapter 3 delineates the legacy planning process found at "Company X", including functional responsibilities, interactions, results, and metrics.
Chapter 4 frames the forecasting and planning problem at "Company X" by assessing current practices, processes, and systems using best practices and process maturity frameworks.
Chapter 5 describes various methods for assessing and categorizing time series data, to establish the appropriate level of aggregation of data for forecasting exercises, as well as to prioritize products during planning activities.
Chapter 6 explores forecasting models utilized at various stages of the product life cycle, as well as the measurements and test statistics utilized for best model selection.
Chapter 7 introduces the Sales and Operations Planning framework, delineates the activities required to initiate this methodology, and presents the solution designed for "Company X". Chapter 8 depicts the organizational forces found at "Company X" that apply to forecasting and planning activities, as well as explores behaviors resulting from policies that affect these processes. Chapter 9 presents the results obtained from the implementation of the proposed forecasting and planning solution provided to "Company X".
Chapter 10 delineates recommendations for future research activities to extend the reach of this project.
Chapter 11 summarizes the activities and results of the project, as well as provides a view of the utility of this project for future forecasting and planning decisions.
2 BACKGROUND
2.1 Company Background: "Company X"
With over 50 years of history, "Company X" is a leading manufacturer and marketer of consumer packaged goods. Headquartered in North America, and with operations in various countries, "Company X's" brands are sold in multiple countries, and as a result, billions of people use "Company X's" products every day. To better serve the needs of its customers, "Company X" is organized from aggregate operating segments based on product groupings into four lines of business.
Seeking predictable earnings growth, during early 2000's and with the guidance of their newly appointed CEO, "Company X" developed and published its New Strategic Plan (NSP). According to the CEO, the key for the success of this plan is a balance between growth and profitability to drive improved returns. To achieve improved returns, "Company X" would generate top line growth from higher sales volumes driven by product segment growth and market share gains, and bottom line growth from cost management and improvements in underperforming operations and
products, while meeting customer needs through brand management, customer partnerships, and product innovation.
Following the release of the NSP, "Company X" restructured its business regions into a Developed Nations Market (DNM) unit and an Emerging Markets (EM) unit. The goal for this new EM business unit was to maximize growth opportunities in Asia, Latin America, and Eastern Europe, by
assigning dedicated resources to these growth businesses. Moreover, further increases in total ownership of joint ventures in these markets signaled the criticality of EM regions for attaining the sales growth targets delineated in the NSP.
Although profitable, "Company X's" growth in a "Key EM" country had begun to stagnate in mid 2000's due to its large market share. Seeking improved performance in-line with the NSP, a new General Manager (GM) was appointed to run the operations of this "Key EM" region. The GM identified three business challenges in the region. First, different functions had different goals and metrics, resulting in a lack of coordination among them. Second, higher levels of aspiration and achievement were required from staff to meet NSP goals. Third, a greater degree of staff
involvement was needed to increase their commitment in the organization. As a result, this GM and his staff then began the organizational and cultural transformation that led to year-to-year
digit sales and operating income growth. Central to the success experienced by this "Key EM" was the development of "market-oriented" (MO) organizations and a "high-performance" culture.
MO's are multifunctional organizations, led by sales managers, and designed to improve top line growth by capitalizing on specific country region or market channel business opportunities, such as promotions targeting different ethnic groups within a country. To ensure coordination among functions, the participating members of the MO are measured using the same metrics and all are eligible to receive monthly incentive bonuses. Functions participating in MO organizations include Sales, Marketing, Customer Service, Distribution, Finance, and Human Resources.
A salient characteristic of this "Key EM" country transformation is the "high-performance" culture,
which focuses on generating a higher level of engagement and collaboration from the workforce through empowerment, communication, human capital investment, and public recognition of achievements. This higher level of engagement is most notable in the development of "Stretch" goals, where employees commit to reach targets that typically far exceed budget. One of the most notable representations of this "high-performance" culture can be found in the MO Planning process, during the development of sales quotas by representatives from Sales and Trade Marketing functions, also known as the Commercial organization.
2.2
Market Landscape
2.2.1 Market Segments, Products Categories, Brands, Tiers, and SKU's
"Company X" organizes its product families by end user. These product families, referred to as "segments", represent a portion of the product portfolio targeted to a market segment, and are the highest level in "Company X's" product hierarchy. As result of this structure, the Marketing
organization is also arranged by market segment to facilitate product and brand management responsibilities. Segments are further subdivided into "categories". Categories include all products that serve the same use to the end customer.
The next hierarchy levels below category in "Company X's" product hierarchy are "brand" and "sub-brand", which positions products into different tiers and price points, for different consumers' willingness to pay. Further product differentiation is achieved through product size, package count, package type, and product features to achieve a Stock Keeping Unit (SKU). Figure 3 provides a representation of the product hierarchy found at "Company X".
Product Hierarchy
Segment
Category
Brand
Suhkrand
SKU
Figure 3
-
"Company X" Product Hierarchy
2.2.2
Market Competition
Competitors operating in this "Key EM" country include multinational and regional companies,
whose parent corporations are based in North America, Europe, or within the same region as the
"Key EM" country. These competitors participate in the same product segments and market
channels as "Company X", with brands targeted at the same end consumers.
2.2.3
Sales Channels
Traditional Trade
The Traditional Trade sales channel is the largest distribution channel for "Company X", as well as
for many other consumer packaged good (CPG) companies operating in this "Key EM" country. This
sales channel constitutes of hundreds of distributors and wholesalers, whose customers are
typically located within the same district, city, or province. Distributors and Wholesalers provide
thousands of "Mom & Pop" shops and retail market stands located throughout the country with
products from multiple CPG companies.
The main difference between distributors and wholesalers is that distributors have their own sales force, which travel their sales area by foot or motorbike, visiting and taking orders from their customers. In comparison, wholesalers mostly operate in or in the vicinity of a wholesale or combination wholesale/retail market; therefore, their customers must visit them for product replenishment
Operating within or in the vicinity of a wholesale market creates intense price and availability competition among wholesalers, since switching costs from one to another wholesaler are very low for "Mom and Pop" storeowners visiting the market. Because of this intense competition, both distributors and wholesalers typically enjoy low margins per unit and carry multiple weeks, or even months, of inventory. Inventory for distributors and wholesalers in good standing is typically sold with future date payment terms; however, current economic conditions have forced CPG
manufacturers to reduce their Days Receivable. This combination of margin, inventory, and liquidity make this market sensitive to heavy price discounting whenever IOU's are due to CPG companies at the end of the month. A practice locally referred to as "burning", this deep discounting of inventory initiates a hockey stick sales pattern downstream in the supply chain between
wholesalers/distributors and "Mom and Pop" storeowners, as these parties engage in a game of postponing purchases until the end of the month; thus enabling storeowners to attain lower purchase prices. (Singer, Donoso, & Konstantinidis, 2009)
Modern Trade
The economic growth experienced by this "Key EM" country over the last decade has led to the expansion of Mass Grocery Retailers (MGR), as well as the development of Retail Pharmacy chains. MGR's and Pharma chains operate retail outlets throughout the country, and constitute the Modern Trade channel. Currently, the Modern Trade channel is a significantly smaller distribution channel than the one found in Traditional Trade. However, only about a dozen retail chains participate the Modern Trade channel; therefore, these retailers typically sell larger volumes than their Traditional Trade channel counterparts. In theory, these retailers' large sales volumes and access to regional or national retail network, as well as point-of-sale demand information, gives MGR's and Retail
Pharma chains significant negotiating power over CPG manufacturers. (Ailawadi, Farris, & Shames,
1999)
Due to the competitive environment of the Modern Trade Channel, retailers engage in Trade Promotions, where the cost of the product discount or the bundled item is split between both the
retailer and the CPG company. In addition, product placement and shelf replenishment is vital in this sales channel; therefore, CPG companies spend a significant amount of resources obtaining and safeguarding product display and availability at each of the retailer's points of service.
Two key characteristics that differ MGR from Pharma chains is the size of their retail space and their inventory management policies. While MGR's typically have large footprint retail locations, these also maintain most of their inventory on store shelves; thus, only keeping a few days of inventory at the stores' warehouse and distribution center for high turnover items. Therefore, to prevent stock-outs, MGR's request multiple fulfillments per week from the CPG companies, as well as transfer inventory within their retail network. Additionally, retailers do not typically share POS sales information with their CPG suppliers, as this information asymmetry can create a pricing competitive advantage in favor of the retailers. (Singer et al., 2009)
In contrast, Pharma chains have smaller footprint, but more numerous retail locations, as compared to MGR's, resulting in a highly complex network that is increasingly difficult to safeguard from stock-outs with inventory transfers. To prevent stock-outs, Pharma chain retail locations maintain a small warehouse within premises capable of storing a few weeks of inventory.
2.2.4 Trade Promotions
Modern Trade channel trade promotions present an attractive opportunity for CPG manufacturers, as these can result in surge demand that is multiple times the observed value during regular sales periods. Retailers in this "Key EM" country typically publish one or two flyers every month, resulting in CPG manufacturers constantly pitching trade promotion ideas, as well as the level of investment, to retailers in order to gain their approval to participate. Other times, the retailer will approach the CPG company with a trade promotion idea and request their participation.
During the planning of a trade promotion, the retailer makes the final decision on the promotional timing (e.g. start date and length), the method of mass communication (e.g. mass mailing, radio and TV ads), and the CPG company and product that will participate. The retailer also makes the rules of the "promotion game" by allowing, or not, competing CPG companies from placing products of equal tier in the same flyer. The control over the demand surge, as well the extent of their
distribution network, give retailers significant power over CPG companies. And although the CPG company can refuse to participate in a promotion, the retailer can also respond to the refusal by inviting a competitor. Therefore, an invited CPG company seldom refuses to participate in promotions.
To encourage CPG company participation in promotional activity, Modern Trade retailers typically
include only one product/tier combination from only one manufacturer in the flyer, creating a
virtual monopoly within the retailer during the period of the promotion. In addition, CPG
companies that participate in trade promotion are assigned shelf space near the entrance of the
retailer's stores, furthering the exposure of the product to end customers.
More recently, economic condition has led to an increased frequency of trade promotional activity
by retailers, in the hope to continue growth through the capture of market share from competitors.
This increase in competition has also led retailers to finalize promotional plans later in the planning
calendar and with shorter horizons, allowing these organizations to observe and react to the
behavior of competitors, as well as to prevent promotion information leaks prior to launch.
Moreover, retailers are also requesting trade promotion changes within the planning cycle, further
complicating the planning activities of "Company X".
2.3
Supply Chain Overview
2.3.1 Manufacturing - Type A Products
The manufacture of Type A products consists of two distinct stages. In the first stage, "Bulk
Production", sourced bulk raw materials are turned into bulk semi-manufactured materials. While
in the second stage, "Finishing", bulk semi-manufactured materials are turned into finished goods
for commercialization.
Packaging
Mars
Raw Mfterials WIP WIP FAned Goods
Bulk
P ucto
Buffer
Finishing
Production
rek
Hours
"Bulk Production" cycle times range from days to weeks, while "Finishing" cycle times lasts only a
few hours. As result of this difference in cycle times, a buffer of semi-manufactured work in process
(WIP) is maintained to align these manufacturing processes closely to market demand. Product
differentiation for Type A finished goods is achieved through machine setpoints, as well as by the
type of semi-manufactured material used during "Finishing" operations. Moreover, as packaging
operations is the last step of the "Finishing" manufacturing operation, it serves as the final
differentiation step to produce one SKU of Type A products.
2.3.2 Manufacturing - Type B Products
Unlike the Type A products, whose raw materials are mostly sourced within the "Key EM" country,
Type B products are manufactured only with semi-manufactured materials sourced from various
regional and global suppliers. As a result of the long lead times associated with the use of suppliers
located outside of the "Key EM" country, a buffer of semi-manufactured materials is maintained at
all times.
Packaging
Materials
Raw Finished
Materials Goods
Raw
Materials
Finished
Goods
Buffer
Buffer
Figure 5 - Production of Type B Products
Just as in Type A products, Type B products are differentiated through machine setpoints and by
the type of semi-manufactured raw materials used during "Finishing" process operations. However,
unlike Type A products "Finishing" equipment, manufacturing equipment for Type B products
requires extensive machine changeover times to accommodate different product configurations.
Moreover, Type B product equipment is also sequenced in series with packaging equipment;
therefore, any changes for finished goods with the same product features require production stops
for changeovers on the packaging end. The extended machine setpoint changeovers required to
accommodate different product features, in combination with shorter packaging end changeovers
to accommodate different packaging configurations, result in cycle times for Type B products equal to multiple days. Due to this characteristic, finished goods buffers are typically maintained after the "Finishing Manufacturing" operation as well.
2.3.3 Sourcing, Warehousing and Distribution
Sourcing
Although many products commercialized by the "Key EM" country are made in one of its two facilities on the outskirts of the capital city, and from raw materials sourced within the country, other commercialized products are either made from imported raw materials, or imported as finished goods from "Company X" facilities and external supplier located around the world. Following this model of global sourcing, many of the products that are manufactured within the "Key EM" country, including work-in-progress (WIP) and finished goods, are also exported to neighboring "Company X" operations for completion and commercialization.
Due to shipping times, customs processing times, sourcing manufacturer policies (make-to-order vs. make-to-forecast vs. make-to-stock), production schedules, equipment limitations and other network inefficiencies, product lead-times can vary from a few days to multiple months. As observed in the examples provided in the previous sections, Type A products have lead times of a few days, while Type B products can have lead times of weeks. Therefore, after accounting shipping and custom processing times in addition to standard cycle time, products sourced from neighboring countries can easily have lead times measured in months.
Warehousing and Distribution
All products commercialized by "Company X", whether manufactured internally or imported from
other sites, are housed in one of two warehouses co-located with the manufacturing facilities. These warehouses serve as the central distribution hub for all of "Company X's" customers, including Distributors, Wholesalers, MGR's, Pharma Chains, and other "Company X" operations in neighboring countries.
During the fulfillment process, orders are either taken by "Company X" sales reps during their sales route or placed by customers directly to "Company X". Before an order is accepted, "Company X" verifies the customer line of credit and credit standing (e.g. no overdue payments). If the customer has reached its line of credit limit, "Company X" will request cash payments for the new order to continue processing. On the other hand, if the customer is overdue on payments, "Company X" will
request payment of the overdue amount prior to executing the new order. Failure to meet any of the listed requirements results in a void sale.
Accepted orders are forwarded to the distribution team for fulfillment, who executes product shipments on the fulfillment date indicated on the customer order. Any order that is shipped incomplete or not shipped on the requested date counts against "Company X's" OTIF (On-time, In-Full) metric. Shipments are handled by third party transportation companies, which have volume contracts pre-negotiated with "Company X". For less-than-truckload (LTL) customer orders, typically made by wholesalers, small distributors, and retail chains lacking central distribution, shipments are typically combined and delivered using a "Milk Run" route. Trucks servicing LTL customer orders are loaded using "Load Builder" software to optimize both utilization and load sequence. In contrast, full truckload orders made by retailers with central distribution capabilities are shipped "point-to-point".
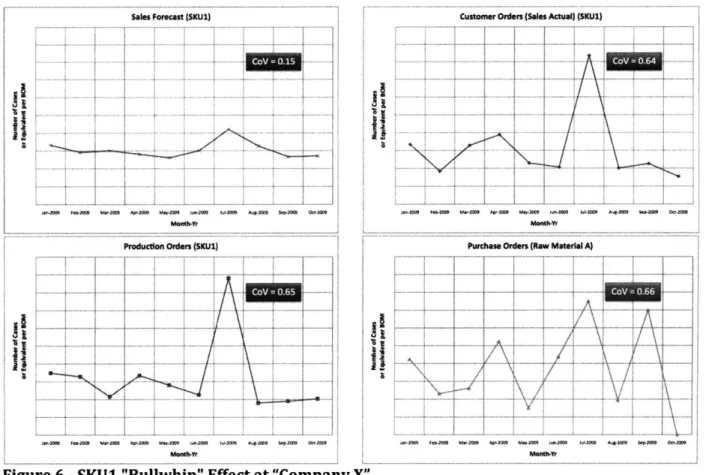
2.4 Demand Forecasting and the "Bullwhip" Effect
In July of 2009, a large supermarket chain extended by a few days their bi-weekly flyer promotion, which featured a highly discounted "Company X" product. As a competing supermarket chain was scheduled to initiate their flyer advertised promotion period during these dates, featuring a similar
"Company X" product (referred to as SKU1), the promotion extension executed by the one retailer resulted in a promotion overlap with the second competing retailer. In response to this competitive environment among retailers, "Company X" extended the second retailer a deeper promotional discount on the featured item.
Although the promotional adjustment with the competing supermarket chain occurred a few days after determining the promotion overlap, Supply Chain planning was not notified of this change
until almost a week later, on the day the revised promotion started. According to a representative from the Trade Marketing group, Supply Chain was not informed of the promotion change since "...the ERP system was still showing inventory for that SKU in the warehouse..." Upon
communicating the promotional change, the Supply Chain team determined that the supply plans developed the previous month would not provide sufficient inventory to cover the increased demand generated by this new promotion. This realization initiated several mitigation actions within the Supply Chain organization, including expedited orders for additional raw materials from suppliers, modifications to the production schedule to accommodate the new demand requirement, and sourcing additional transportation capacity to accommodate the shipping of additional product.
Sales Forecast: (SICUl)
...
. . .. . ....
Production Orders (SKUI)
...
.
...-....-.---...
d
11
a.1
a 4ii
ii
aCustoese Orders (Sales Actual) (SKUl).
.... .... . . .
... ....
....74...
Ifudae
nlr (aw
tipalA
\ / --- I
~ 2~t ap~2~ m..zt, .4~ Mama ~.4U mm,,
Monte-Yr
Figure 6 - SKU1 "Bullwhip" Effect at "Company X"
Although overlap promotions are rare events, gaming in the Traditional Channel and promotion
changes during the planning cycle in the Modern Channel are not. (Refer to sections 2.2.2 & 2.2.3)
As a result, the "Bullwhip" effect, or the increase of demand variability up the supply chain from
retailer to manufacturer to supplier, is an eventual occurrence at "Company X". As described earlier,
these supply chain fluctuation are not just economically costly, but more importantly, the
characteristic inventory stock out and overstock cycle "...can breed blame and mistrust within and
between firms in a supply chain." (Sterman, 2006)
According to John Sterman, (2006), the causes of "Bullwhip" effect fall into two elements:
Operational and Behavioral. Operational causes are associated with the structure of the
organization, and are segmented into "physical" and "institutional". "Physical" structure causes
encompass inventory placement along the supply chain (including suppliers and customers), as
well as time delays in production, fulfillment, and transportation. Conversely, "institutional"
structure causes include coordination and competition among (e.g. between retailers) and within
(e.g. between functional organizations) firms, availability of information across the organization,
and the incentives faced by the members of the organization.
In contrast, behavioral causes are associated with the mental models utilized by individuals, including attitudes, attributes and heuristics, when making decisions regarding production, capacity, and pricing. (Sterman, 2006)
Work In
Process
Inventory
-I
Production
Inventory
Production
Shipment
Start Rate Rate Rate
Stockout
WIP Control ory Order
Fulfillment Customer Order Rate
Production
Scheduling
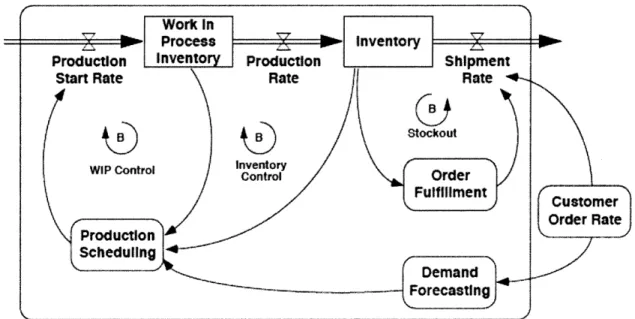
Demand ForecastingFigure 7
-
Model of Make-to-Stock inventory management system (Sterman, 2006)
Represented in a systems dynamics model (refer to Figure 7), demand forecasting is a key component of a make-to-stock inventory system, interpreting customer order data into a "future need" prediction to ultimately develop a production schedule for inventory replenishment. As part of the inventory system, demand forecasting is sensitive to both operational and behavioral causes of the "Bullwhip" effect, both directly affecting the process and indirectly affecting the inputs of the process, such as customer order rate. Moreover, demand forecasting itself perpetuates the"Bullwhip" effect, since current period demand surges can be interpreted as sustainable in the future. (Lee, Padmanabhan, & Whang, 1997)
For the reasons described, design of an improved forecasting methodology must not only include robust demand signal processing techniques (i.e. demand forecasting) to reduce forecast errors, but also an understanding of drivers of demand (i.e. customer order rate) to reduce variability.
(Rosenfield, 2005) In cases where mitigation of variation is not achievable, then more advanced modeling techniques can be used to mitigate forecast errors. More importantly, the methodology must also highlight supply chain system delays in order to communicate to all stakeholders the response restrictions within the system.
3
LEGACY PLANNING PROCESS
3.1
Planning Methodology by Function
For "Company X", the Sales Planning processes starts every month with pre-planning meetings
between Sales and Marketing, where customer issues and promotional plans are discussed. Upon
completion of these pre-planning meetings, Sales and Marketing staff supporting their respective
market channel gather in a MO Planning meeting, where sales agreements are negotiated between
the mentioned parties, and finalized in currency by product segment. The sales planning process is
complete once the country General Manager grants final approval of the sales quota, which occurs
on the final days of the planning cycle.
Monthly Planning Cycle
4' week 142' week:
Plan approval
VM week:
Planning
Figure 8 - "Company X" Planning Cycle
Parallel to the sales quota generation activities, the Demand Planner develops a Forecast (in cases)
based on historical demand by SKU that is monetized and compared with the sales quota developed
by the Commercial organization. Since deviations between the supply chain's forecast and the
commercial's sales quota are not resolved in totality until final approval of the latter by the Country
GM, supply planning activities such as sourcing and production scheduling are typically completed
in the first week of the following planning cycle.
3.1.1
Sales
For the sales organization, the sales quota (or demand forecast) process differs between the
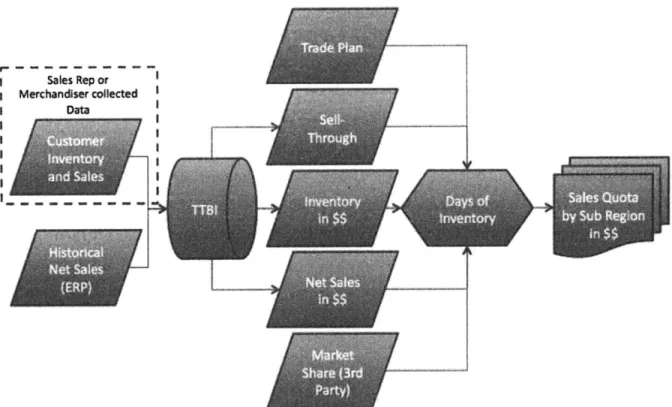
Traditional Trade and Modern Trade channels. In the Traditional Trade channel, sales reps develop
sales quotas by analyzing and managing inventory coverage at the customer level. As discussed in
section 2.2.2, inventory is managed for Traditional Trade customers due to their warehouse
capacity and market competitive landscape. Monthly customer inventory data, in cases by SKU, is
either collected manually through informal audits performed by sales reps or by "Company X"
subcontracted merchandisers, or submitted online by Traditional Trade customers. In addition to
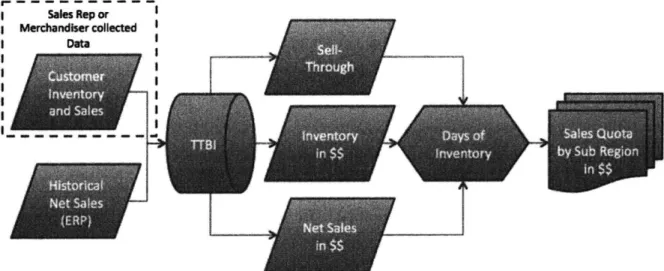
inventory positions, monthly customer sales data, or sell-through, is also collected. The collected
data, as well as net sales data from the ERP system, is entered into an internal database called
Traditional Trade Business Information or TTBI. In this database, sales and inventory data is
monetized and manipulated to calculate days-of-inventory at each customer. Days-of-inventory
targets are established based on the replenishment time to the customer, as well as the customer's
credit worthiness and available line of credit. With the information available in TTBI, plus a simple
prediction of monthly customer sales and the flow and stock balance equation (Purchases
+
Last
Period Inventory
=
Sales
+
Current Month Inventory), sales reps calculate Net Sales (Purchases)
predictions for their customers. Customer specific issues such as utilization of credit limit and
liquidity, as well as Regional issues such as holidays and promotions, are also taken into account to
predict Net Sales.
Salestp or Merchandsercollected
IDote
r
Figure 9 - Sales Quota Development Process: Sales Traditional Trade
In comparison to Traditional Trade, where quotas are developed using manually collected data,
Modern Trade channel sales quotas are developed strictly using ERP system Net Sales data. Due to
the limited warehouse capacity found in modern trade customers, as well as the asymmetries of
information between the retailer and the CPG company, sell through in this channels is assumed at
100 percent. In addition to Net Sales data, sales reps take into consideration the finalized
promotional activities at each retailer to develop the sales quota. To determine the sales uplift
Page 29 of 106
generated by future promotions, sales reps evaluate the performance of similar past promotions at the retail chain, and adjust it according to current conditions, such as promotions from competitors. This analysis performed by sales rep to determine sales uplift is partially based on historical
performance data, such as sales and market share goals, and partially based on judgment.
Q uant +QalAnalysis
Sell Through 100% due to limited customer warehouse space
Figure 10 - Sales Quota Development Process: Sales Modern Trade
3.1.2
Marketing
Just as in the sales organization, the sales quota development processes for the marketing organization differs for representatives supporting Traditional Trade versus Modern Trade
channels. For marketing representatives, the sales quota development process is very similar to the process utilized by their sales counterpart, with two exceptions. Market Share attainment and Promotional Budget management are two of the responsibilities assigned to the marketing team. Therefore, aside from using the same sources of data and making the same considerations as the sales team to develop their sales quota, marketing representatives also account for monthly market share and utilization of promotional budget in their calculation. Promotional budgets are defined for each product segment as a percentage of sales; thus, marketing representatives typically seek promotions that improve utilization of their assigned budget. Although section 2.2.3 focuses on trade promotions in the Modern Trade Channel, these are also done in the Traditional Trade channel, but at a lesser extent. While promotions for Modern Trade retailers take shape as BOGO's, end customer price discounts and combo packs, promotions for Traditional Trade customers take shape as discounts, bonuses, and free merchandise for achieving specific purchasing targets. Ultimately, these promotional activities are designed to drive market demand by transferring
Sales Rep or Merchandiser collected
Data
Figure 11 - Sales Quota Development Process: Marketing Traditional Trade
Quant + Qual Analysis
Sell Through 100% due to limited customer warehouse space
Figure 12
-
Sales Quota Development Process: Marketing Modern Trade
3.1.3
Supply Chain
Unlike the commercial organization, which utilize historical sales data and promotional activities to
determine a sales quota in currency units, supply chain planning utilizes historical sales in "case
Page 31 of 106
units" to determine their demand forecast. According to the supply chain process, the demand
planner begins by obtaining country aggregate historical sales data in cases by SKU from "Company
X's" ERP system. After cleaning the data from discontinued SKU's and matching SKU's in transition,
the demand planner calculates a one-month forecast utilizing a 3-month moving average. Longer
horizon forecasts are not pursued due to the promotion planning behavior of Modern Trade
retailers. A revision of this process occurred upon the availability of Forecasting SW, expanding the
calculation of future demand to utilizing various time series formulas. The resulting demand
forecast in cases by SKU is monetized using current product portfolio price per unit, and aggregated
to a product segment total and a country total sales quota equivalent. These totals are then
compared to the values generated by the Commercial organization. Large deviations between the
Supply Chain forecast and the Commercial forecast trigger a revision, where quantities assigned to
specific SKU's, in particular promotional and large volume, are adjusted until currency values
between forecasts match.
Input from marketing includes
promotions, new products, phaseouts, and transitions
Figure 13
-
Sales Quota to Demand Forecast Resolution Process: Supply Chain
Upon completion of this process, the resulting demand forecast is loaded into the ERP for use by the
organization. Unfortunately, this forecast can only fully utilized by the Commercial organization for
tracking monthly sales attainment. To deal with the shortcomings of the legacy forecasting and
planning process, production planners pad forecasts when developing production schedules, and
buyers make their own longer horizon forecasts by assuming a growth adjusted straight-line
demand for subsequent months when purchasing materials with lead times in excess of 30 days.
3.2
Market Oriented Organization Planning Meeting -
Sales Quota Negotiation
Starting the third week of every month, representatives from the Sales and Marketing organizations
supporting a market channel, or MO, meet to finalize their sales quota. Planning meetings begin
with a brief presentation from the Finance group, which highlight monthly P&L and year-to-year
comparisons of the MO and of product segments within the MO.
Upon completion of finance segment, marketing representatives supporting the each of the product
segments commercialized by "Company X" present their promotional plans and proposed sales
quota for each sub-region (Traditional Trade) or retail chain (Modern Trade) to their sales
counterparts, as well as to the MO Sales Manager. As mentioned earlier, both sales and marketing
staff utilize historical performance data and judgment to devise a sale quota that accurately
represents the promotional activities exercised in the channel. Information sharing during
pre-planning meetings suggests symmetric information between sales and marketing, and thus a rapid
resolution of a sales quota; however, execution of planning meetings can take from a few hours to a
couple of days. Due to the different interests found in each of these functions, planning meetings
possess characteristically extensive negotiations between sales and marketing reps, with a MO
Sales Manager acting as the mediator.
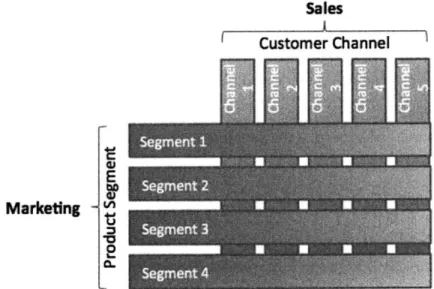
Sales
Customer Channel
Marketing
Figure 14 - Commercial Sales Quota Negotiation Structure
Once all Trade Marketing representatives from each of the product segments successfully reach a sales quota agreement with their Sales counterparts, quotas are summed into a MO sales quota proposal. Participation during planning meetings by the MO Sales Managers helps expedite this process, as he guides the negotiation toward sales quota that meets the expectations of both the MO and the Country General Manager. The completion of all MO planning meetings, including the
approval of its corresponding quota, results in a Country Sales Quota (as depicted in Table 1), as well as a commitment from the Commercial organization. However, sales quotas that do not meet the expectations of the country GM can potentially send the proposal back to a promotional plan redesign. When these situations arise, production and sourcing plans might not be completed until the planning month has expired.
Table 1 -
Representation of Country Sales Quota
Product Segment 1
493,380
467,916
374,014
257,831
13,846
1,606,987
Product Segment 2
461,732
423,352
359,181
289,643
422,721
1,956,629
Product
Segment
3
429,718
493,380
485,423
213,268
97,615
1,719,403
Product Segment
4
238,732
186402
131,780
74,485
496,659
1,128,058
TOTAL
1,623,563
1,571,050
1,350,398
835,226
1,030,841
6,411,078
*Values modified to protect "Company X" confidential information
During the execution of these planning meetings, Supply Chain function participation is passive. Although the demand planner attends planning meetings, he provides little to no information before or during the negotiation. Furthering participation roadblocks during meetings is the forecast units difference between Commercial organization and Supply Chain functions. While Commercial develops and tracks sales attainment in currency by MO and product sector, Supply Chain does so in cases by product sector. This difference results in a lack of shared information between functions. Aggravating the demand planners passive participation is his role within the planning process, where the function of the demand planner is viewed as a strictly supporting role. Therefore, under the current process, the Demand Planner's sole responsibility is to interpret the sales quota into a demand requirement in cases.
3.3 Metrics and Feedback
Upon completion and closure of the sales cycle, the Demand Planner retrieves sales data from the ERP system for comparison with the demand predictions made during the planning cycle executed the previous calendar month. The result of this comparison is a Forecast Error calculation by SKU,
by Product Sector aggregate, and by Country aggregate. At the SKU level, the Forecast Error metric
of choice by "Company X" is Absolute Percentage Error. While for higher levels of aggregation, "Company X" utilizes an internally defined Weighted Absolute Percentage Error (WAPE) metric.
I
actual sales,
-
forecast,
1
|
WAPE
=
x=1x
100%
I forecastt
a
1.
x=1
Equation 2 -"Company X" Weighted Absolute Percentage Error Metric
Reports including Forecast Error metrics are shared every month with the entire organization. These reports not only include the different aggregation level Forecast Error metrics discussed, but also note the SKU's in each product segment that most significantly contributed to the Forecast Error. Although multiple functions participate, whether directly or indirectly, in the development of the demand forecast, only the Supply Chain functions routinely utilizes this metric as part of its performance measurements. Moreover, Forecast Error metrics are delivered though the internal email system, limiting visibility of these metrics across the organization. In comparison, Sales Goal attainment metrics are updated and published on the internal website real-time, as sales are registered in the ERP system.
4 FORECASTING & PLANNING PROBLEM
4.1 Assessment of Current State
4.1.1 Best Practices and Assessment Models
To determine the effectiveness of "Company X's" current forecasting and planning practices, best practices and assessment frameworks provided a methodology for identifying areas of opportunity for improvement. Best practices identified during literature review include Segmentation, Sales and Operations Planning, and Collaborative Forecasting and Planning, while frameworks utilized to assess planning practices included the Four Stage S&OP Process Maturity Model developed by Larry Lapide (2005, Spring), and the S&OP Integration Framework developed by Andrew Grimson and David Pyke (2007).
Best Practices
Segmentation: In forecasting, segmentation refers to the practice of separating the product line into groups. The most common segmentation process is ABC segmentation, where product items are separated into three separate groups based on their historical sales. The goal of a segmentation exercise is to manage the forecasting process for items in each segmentation group differently in order to make the forecasting process more efficient. (Lapide, 2005/2006, Winter) In other words, while an automated system performs the bulk of the forecasting work, stakeholders only adjust items prioritized by the segmentation exercise (Lawrie, Leaver, & Gaynor, 2007, September) Sales and Operations Planning: Sales and Operations Planning is a planning process used at a tactical or operational level to balance demand and supply over time in order to meet customer orders, optimize production and operations, and minimize waste. Under S&OP, sales and marketing plans are reconciled with operations, distribution, production, and procurement plans; thus,
resulting in the development of both "unconstrained" and "constrained" demand forecasts to drive operations (Lapide, 2005/2006, Winter) Moreover, Advanced S&OP methods include an
understanding of lead time variability in the supply network (Lawrie et al., 2007, September) Collaborative Forecasting and Planning: Collaborative Forecasting and Planning refers to the practice of integrating required stakeholders into the development of demand forecasts and
planning activities in order to build consensus regarding expected level, timing, mix, and location of demand. Some of the most important aspects to build consensus through forecast accuracy