HAL Id: hal-02978260
https://hal.archives-ouvertes.fr/hal-02978260
Submitted on 28 Oct 2020
HAL is a multi-disciplinary open access
archive for the deposit and dissemination of
sci-entific research documents, whether they are
pub-lished or not. The documents may come from
teaching and research institutions in France or
abroad, or from public or private research centers.
L’archive ouverte pluridisciplinaire HAL, est
destinée au dépôt et à la diffusion de documents
scientifiques de niveau recherche, publiés ou non,
émanant des établissements d’enseignement et de
recherche français ou étrangers, des laboratoires
publics ou privés.
A Gibbs Sampling Method to Detect Overrepresented
Motifs in the Upstream Regions of Coexpressed Genes
Gert Thijs, Kathleen Marchal, Magali Lescot, Stephane Rombauts, Bart de
Moor, Pierre Rouzé, Yves Moreau
To cite this version:
Gert Thijs, Kathleen Marchal, Magali Lescot, Stephane Rombauts, Bart de Moor, et al..
A
Gibbs Sampling Method to Detect Overrepresented Motifs in the Upstream Regions of
Coex-pressed Genes.
Journal of Computational Biology, Mary Ann Liebert, 2002, 9 (2), pp.447-464.
�10.1089/10665270252935566�. �hal-02978260�
A
Gibbs Sampling Method to Detect
Overrepresented
Motifs in the Upstream
Regions
of Coexpressed Genes
GERT THIJS,1 KATHLEEN MARCHAL,1 MAGALI LESCOT,1 STEPHANE ROMBAUTS,2
BART DE MOOR,1 PIERRE ROUZÉ,3 and YVES MOREAU1
ABSTRACT
Microarray
experiments can reveal important information about transcriptional regulation.
In
our case, we look for potential promoter regulatory elements in the upstream region of
coexpressed
genes. Here we present two modi cations of the original Gibbs sampling
algo-rithm
for motif nding (Lawrence et al., 1993). First, we introduce the use of a probability
distribution
to estimate the number of copies of the motif in a sequence. Second, we describe
the
technical aspects of the incorporation of a higher-order background model whose
ap-plication
we discussed in Thijs et al. (2001). Our implementation is referred to as the Motif
Sampler.
We successfully validate our algorithm on several data sets. First, we show results
for
three sets of upstream sequences containing known motifs: 1) the G-box light-response
element
in plants, 2) elements involved in methionine response in Saccharomyces cerevisiae,
and
3) the FNR O
2-responsiveelement in bacteria. We use these data sets to explain the
in
uence of the parameters on the performance of our algorithm. Second, we show results
for
upstream sequences from four clusters of coexpressed genes identi ed in a
microar-ray
experiment on wounding in Arabidopsis thaliana. Several motifs could be matched to
regulatory
elements from plant defence pathways in our database of plant cis-acting
regu-latory
elements (PlantCARE). Some other strong motifs do not have corresponding motifs
in
PlantCARE but are promising candidates for further analysis.
Key
words: motif nding, Cribbs sampling, regulatory elements, gene expression, microarray.
1.
INTRODUCTION
M
icroarrays let biologists monitor the mRNA expression levels of several thousands of genes in one experiment (for a review, see Lockhart and Winzeler [2000]). An interesting application of this microarray technology is to measure the evolution of mRNA levels at consecutive time points during1ESAT-SCD, KULeuven, Kasteelpark Arenberg 10, 3001 Leuven, Belgium. 2Plant Genetics, VIB, University Gent, Ledeganckstraat 35, 9000 Gent, Belgium.
a biological experiment. This way, we can construct a temporal expression pro le for the thousands of genes present on the array. Such large-scale microarray experiments have opened new research directions in transcript pro ling (Sherlock, 2000; Szallasi, 1999; Wen et al., 1998; Zhang, 1999). For instance, a primary goal in the analysis of such large data sets is to nd genes that have similar behavior under the same experimental conditions. Several clustering algorithms are available to group genes that have a similar expression pro le (Altman and Raychaudhuri, 2001; De Smet et al., 2002; Eisen et al., 1998; Heyer et al., 1999; Mjolsness et al., 2000; Tavazoie et al., 1999). Given a cluster of genes with highly similar expression pro les, we can search for the mechanism that is responsible for their coordinated behavior. We basically assume that coexpression frequently arises from transcriptional coregulation. As coregulated genes are known to share some similarities in their regulatory mechanism, possibly at transcriptional level, their promoter regions might contain some common motifs that are binding sites for transcription regulators. A sensible approach to detect these regulatory elements is to search for statistically overrepresented motifs in the promoter region of such a set of coexpressed genes (Bucher, 1999; Ohler and Niemann, 2001; Roth et al., 1998; Tavazoie et al., 1999; Zhu and Zhang, 2000).
Algorithms to nd regulatory elements can be divided into two major classes: 1) methods based on word counting (Jensen and Knudsen, 2000; van Helden et al., 1998, 2000a; Sinha and Tompa, 2000; Tompa, 1999; Vanet et al., 2000) and 2) methods based on probabilistic sequence models (Bailey and Elkan, 1995; Hughes et al., 2000; Lawrence et al., 1993; Liu et al., 2002; Roth et al., 1998; Workman and Stormo, 2000). The word-counting methods analyze the frequency of oligonucleotides in the upstream region and use intelligent strategies to speed up counting and to detect signi cantly overrepresented motifs. These methods then compile a common motif by grouping similar words. Word counting methods lead to a global solution as compared to the probabilistic methods. The probabilistic methods represent the motif by a position probability matrix and the remainder of the sequence is modeled by a background model. To nd the parameters of this model, these methods use maximum likelihood estimation in the form of Expectation Maximization (EM) and Gibbs sampling—EM is a deterministic algorithm and Gibbs Sampling is a stochastic equivalent of EM.
In this paper, we present two modi cations of the original Gibbs sampling algorithm by Lawrence et al. (1993). First, a probabilistic framework is used to estimate the expected number of copies of a motif in a sequence. The proposed method resembles the method used in MEME (Bailey and Elkan, 1995). While Bailey and Elkan use a global variable to estimate the number of copies of the motif in the whole data set, we propose to estimate the number of copies of the motif in each sequence individually. For instance, when using AlignACE (Roth et al., 1998) the user should estimate the total number of motif occurrences in the complete data set, while in our approach there is only a maximum number per sequence to be set. Second, we introduce the use of a higher-order background model based on an Markov chain. Here we comment on the technical details of the incorporation of the background model in the algorithm. The construction and in uence of the background on the performance of the Motif Sampler has been described elsewhere (Thijs et al., 2001). We showed that the use of a higher-order background model has a profound impact on the performance of the motif nding algorithm. In this manuscript, we focus on the details of the incorporation of these modi cations in the Gibbs sampling algorithm to nd the parameters of the extended probabilistic sequence model.
Our implementation of the Gibbs sampler was successfully tested on different data sets of inter-genic sequences. We used data sets of upstream regions with known regulatory elements in Arabidop-sis thaliana, in Saccharomyces cerevisiae, and in bacteria to demonstrate the performance of the Motif Sampler. In this manuscript, we discuss these results in detail and show how the different parameter settings in uence the detection performance of the motif nding. Finally, we show some results for the upstream sequences of coexpressed genes identi ed in a microarray experiment on wounding in A. thaliana (Reymond et al., 2000).
2. MODEL DESCRIPTION
In this section, we start with the basic description of the sequence model. Then we discuss the higher-order background model, and we introduce the probabilistic framework to estimate the number of copies of the motif in the sequence.
2.1.
Basic sequence model
To start, we introduce the basic model that we use to represent a DNA sequence. The basic model assumes that one or more motifs are hidden in a noisy background sequence. On the one hand, the motif model is based on a frequency residue model (Lawrence et al., 1993; Bailey and Elkan, 1995) and is represented by a position probability matrix µW:
Motif µW D 0 B B B B @ qA 1 q2A ¢ ¢ ¢ qWA q1C q2C ¢ ¢ ¢ qWC q1G q2G ¢ ¢ ¢ qWG q1T q2T ¢ ¢ ¢ qWT 1 C C C C A;
with W the xed length of the motif. Each entry qb
i in the matrix µW gives the probability of nding
nucleotide b at position i in the motif. On the other hand, the background model is represented by a transition matrix Bm, with m the order of the model (see Section 2.2). The probability P0 that the
sequence S is generated by the background model Bm is given by
P0D P .SjBm/D P .b1/ L
Y
lD1
P .bljbl¡1: : : b1; Bm/;
where bl is the nucleotide at position l in the sequence S and P .bljbl¡1: : : b1; Bm/ is the probability of
nding the nucleotide bl at that position l in the sequence according to the background model and the
sequence content. If the order of the background model is set to zero, the background model is represented by the single nucleotide model Psnf or the residue frequencies in the data set:
PsnfD [q0A q0C q0G q0T]T:
Now that we have de ned the parameters of the models, we can use these parameters to compute the probability of the sequence when the position of the motif is known. If the start position a of a motif µW
is known, then the probability that the sequence is generated given the model parameters is P .Sja; µW; B0/D a¡1Y lD1 qbl 0 aCW ¡1Y lDa qbl l¡aC1 L Y lDaCW qbl 0 ; (1) where qbl
l¡aC1is the corresponding entry .bl; l¡ a C 1/ in the motif model µW.
2.2. Higher-order background model
The rst extension to the original Gibbs sampling algorithm for motif nding (Lawrence et al., 1993) we implemented is the use of a higher-order background model. An elaborate evaluation and discussion on the in uence of a higher-order background model on motif detection has been described elsewhere (Thijs et al., 2001). Here we will only summarize the issues relevant to the remainder of the article.
The most frequently cited algorithms using the probabilistic motif model, AlignACE (Hughes et al., 2000) and MEME (Bailey and Elkan, 1995), use the single nucleotide frequency distribution of the input sequences to describe the background model. However, if we look more closely at state-of-the-art gene de-tection software, Glimmer (Delcher et al., 1999), HMMgene (Krogh, 1997), and GeneMark.hmm (Lukashin and Borodowsky, 1998), all of them use higher-order Markov processes to model coding and noncoding se-quences. Markov models have been introduced to predict eukaryotic promoter regions (Audic and Claverie, 1997) and recently this method was re ned to interpolated Markov chains (Ohler et al., 1999). Recently, higher-order background models have also been introduced in word-counting methods (Sinha and Tompa, 2000). In parallel with our research, others (Liu et al., 2001; McCue et al., 2001; Workman and Stormo, 2000) have suggested the use of related higher-order background models to improve their motif-detection algorithms.
Starting from the ideas incorporated in these gene and promoter prediction algorithms, we developed a background model based on a Markov process of order m. This means that the probability of the nucleotide blat position l in the sequence depends on the m previous bases in the sequence, and the factor
P .bl¡1: : : b1; bljBm/ simpli es to P .bljbl¡1: : : bl¡m; Bm/. Such a model is described by a transition
matrix. Given a background model of order m, we write the probability of the sequence S being generated by the background model as
P .SjBm/D P .b1; : : : ; bmjBm/ L
Y
lDmC1
P .bljbl¡1; : : : ; bl¡m; Bm/:
The probability P .b1; : : : ; bmjBm/ accounts for the rst m bases in the sequences, while P .bljbl¡1; : : : ;
bl¡m; Bm/ corresponds to an entry in the transition matrix that comes with the background model Bm.
Important to know is that the background model can be constructed either from the original sequence data or from an independent data set. The latter approach is more sensible if the independent data set is carefully created, which means that the sequences in the training set come from only the intergenic region and thus do not overlap with coding sequences. Currently, we have constructed an independent background model for Arabidopsis thaliana (based on the sequences in Araset [Pavy et al., 1999] and PlantGene [Thijs et al., 2001]) and also for Saccharomyces cerevisiae (www.ucmb.ulb.ac.be/bioinformatics/rsa-tools/). Background models for other organism are under construction. Nevertheless, the algorithm can also be used for other organisms by building the background model from the input sequences.
2.3. Finding the number of occurrences of a motif
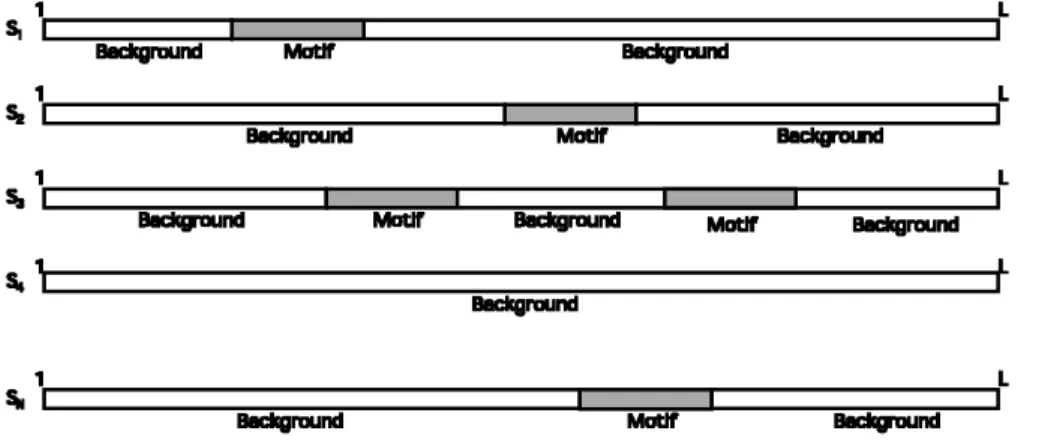
The clustering of gene expression pro les of a microarray experiment gives several groups of coexpressed genes. The basic assumption states that coexpression indicates coregulation, but we expect that only a subset of the coexpressed genes are actually coregulated. When searching for possible regulatory elements in such a set of sequences, we should take into account that the motif will appear only in a subset of the original data set. We therefore want to develop an algorithm that distinguishes between the sequences in which the motif is present and those in which it is absent. Furthermore, in higher organisms, regulatory elements can have several copies to increase the effect of the transcriptional binding factor in the transcriptional regulation. Figure 1 gives a schematic representation of this kind of data set. To incorporate these facts, we reformulate the probabilistic sequence model in such a way that we can estimate the number of copies of the motif in each sequence.
First we introduce a new variable Qk, which is the number of copies of the motif µW in the sequence
Sk and which is missing from our observations. Together with this variable Qk, we also introduce the
probability °k.c/ of nding c copies of the motif µW in the sequence Sk, with
°k.c/D P .QkD cjSk; µW; Bm/: (2)
Equation 2 can be further expanded by applying Bayes’ theorem:
°k.c/D P .SkjQk D c; µW; Bm/P .Qk D cjµW; Bm/
P .SkjµW; Bm/
: (3)
We can distinguish three different parts in Equation 3. The rst part P .SkjQk D c; µW; Bm/ is the
prob-ability that the sequence is generated by the motif model µW, the background model Bm, and the given
number of copies c. This probability can be calculated by summing over all possible combinations of c motifs, P .SkjQkD c; µW; Bm/ DX a1 ¢ ¢ ¢X ac P .Skja1; : : : ; ac; Qk D c; µW; Bm/P .a1; : : : ; acjQk D c; µW; Bm/; (4)
where a1; : : : ; ac are the start positions of the different copies of the motif. We assume that the prior
P .a1; : : : ; acjQkD c; µW; Bm/ is independent of the motif model and of the background model and that it
is therefore a constant inverse proportional to the total number of possible combinations. The probability P .Skja1; : : : ; ac; Qk D c; µW; Bm/ can be easily calculated with Equation 1. Note, however, that the
complexity of the computations depends on the number of copies c, since all possible combinations of c motifs in the sequence have to be taken into account.
The second part in Equation 3 is the prior P .Qk D cjµW; Bm/, the probability of nding c copies
given the motif model and the background model. For simplicity reasons, we assume that this probability is independent of µW and Bm and therefore it can be estimated as P .Qk D c/. To ef ciently calculate
Equation 4, an adapted version of the forward algorithm can be used.
The nal part is the probability P .SkjµW; Bm/. This probability can be calculated by taking the sum
over all possible numbers of copies P .SkjµW; Bm/D
1
X
cD0
P .SkjQk D c; µW; Bm/P .Qk D cjµW; Bm/: (5)
From a more practical point of view, this equation is not workable. Taking the sum over all possible numbers of copies is impractical. Therefore, we introduced a new parameter Cmax to set the maximal
number of copies expected in each sequence. The sum in Equation 5 is substituted with a sum going from 0 to Cmax. The in uence of this parameter Cmax on the performance of the algorithm will be discussed
in detail in Section 5. If we have computed °k.c/, for c D 1; : : : ; Cmax, this probability can be used to
estimate the expected number of copies Qk of the motif in the given sequence Sk,
E.Sk;µW;Bm/.Qk/D CXmax cD0 cP .Qk D cjSk; µW; Bm/ D CXmax cD1 c°k.c/: (6)
3. ALGORITHM AND IMPLEMENTATION
In the previous section, we discussed the technicalities of the higher-order background model and the estimation of the number of copies of a motif in the sequences. In this section, we describe the incorporation of the presented modi cations in the iterative procedure of the Gibbs sampling algorithm. First we describe the algorithm in detail. We do not give a general description of the Gibbs sampling methodology, as it is available elsewhere (Lawrence et al., 1993; Liu et al., 2002) but we focus on the description of our implementation.
In the following paragraph, we brie y address the problem of nding different motifs. Then we give an overview of the output returned by the Motif Sampler and the different motif scores. Finally, we discuss the web interface to the Motif Sampler, and we give a brief description of all the parameters that the user has to de ne.
3.1. Algorithm
The input of the Motif Sampler is a set of upstream sequences. In the rst step of the algorithm, the higher-order background model is chosen. The background model can be pre-compiled or it can be calculated from the input sequences. The algorithm then uses this background model Bm to compute, for
each segment x D fbl; blC1; : : : ; blCW ¡1g of length W in every sequence, the probability
Pbg.x/D P .xjS; Bm/D W
Y
iD0
P .blCijblCi¡1: : : blCi¡m; Bm/
that the segment was generated by the background model. These values are stored and there is no need to update them during the rest of the algorithm.
In the second step, for each sequence Sk, kD 1; : : : ; N, the alignment vector Ak D fak;cjc D 1; : : : ;
Cmaxg is initialized from a uniform distribution. The number of copies Qk is sampled according to the
initial distribution 0k, with
0k D f°k.c/jc D 0; : : : ; Cmaxg:
In the next step, the algorithm loops over all sequences, and the alignment vector for each sequence is updated. First, the motif model QµW is calculated based on the current alignment vector. This estimated
motif model is used to compute the probability distribution Wz.x/ over the possible motif positions in
sequence Sz. The calculation of Wz.x/ is similar to the predictive update formula as described by Liu
et al. (1995), but we substituted the single nucleotide background model with a higher-order background model, which leads to the following equation
Wz.x/D P .xj QµW/ P .xjS; Bm/D WY¡1 iD0 QµW.iC 1; blCi/ P .blCijblCi¡1: : : blCi¡m; Bm/ : (7)
Next, a new alignment vector is selected by taking Cmaxsamples from the normalized distribution Wz.x/.
Given the estimated motif model QµW, the algorithm reestimates the distribution 0. Although we sampled
Cmaxpositions, only the rst Qk positions will be selected to form the nal motif. This procedure is ended
when there is no more improvement in the motif model or we exceed a maximum number of iterations. 1. Select or compute the background model Bm.
2. Compute the probability Pbg.x/ for all segments x of length W in every sequence.
3. Initialize of the alignment vectors A D fAkjk D 1 : : : Ng and the weighting factors 0 D f0kjk D
1 : : : Ng.
4. Sample Qk, for each sequence Sk, from the corresponding distribution 0k.
5. For each sequence Sz, zD 1; : : : ; N:
a. Create subsets QSD fSiji 6D zg and QAD f QAiji 6D zg, with QAi D fai;1; : : : ; ai;Qig.
b. Calculate QµW from the segments indicated by the alignment vectors QA.
c. Assign to each segment x in Sz the weight Wz.x/ conforming to Equation 7.
d. Sample Cmaxalignment positions to create the new vector Az from the normalized distribution Wz.
e. Update the distribution 0z.
6. Repeat from Step 4 until convergence or for a maximal number of iterations.
3.2. Inclusion of the complementary strand
Often it is also useful to include the complementary strand into the analysis procedure since transcription binding factors are known to bind on both strands of the DNA. The straightforward way to tackle this
problem is to double the size of the data set by including the reverse complement of each individual sequence. However, with this approach, the noise present in the data set will also be doubled. Therefore, we suggest a more careful approach. In Step 5 of the algorithm, the predictive update distribution of both the sequence Sz and its reverse complement is computed. Next, the alignment positions are sampled
from Sz, these positions are masked on the opposite strand, and the alignment positions on the reverse
complementary sequence are sampled. Finally, the distribution 0z is calculated and updated for both the
strands.
3.3. Finding multiple motifs
So far, we discussed only the issue of nding one motif that can have multiple copies, but we would like also to nd multiple motifs. To nd more than one motif, we will run the Motif Sampler several times, and in each run we will mask the positions of the motifs previously found. By masking the positions, it will be impossible to nd the same motif twice. Masking a certain position in the sequence can be achieved by forcing the weights Wz.x/ to be 0 for all segments x that overlap with the previous motifs. The allowed
overlap is a parameter that the user of the algorithm has to de ne.
3.4. Motif scores
The nal result of the Motif Sampler consists of three parts: the position probability matrix µW, the
alignment vector A, and the weighting factors 0. Based upon these values, different scores with their own characteristics can be calculated: consensus score, information content, and log-likelihood.
The consensus score is a measure for the conservation of the motif. A perfectly conserved motif has a score equal to 2, while a motif with a uniform distribution has a score equal to 0.
Consensus ScoreD 2 ¡ W1 W X lD1 X b2fA,C,G,Tg qlblog.qb l/ (8)
The information content or Kullback-Leiber distance between the motif and the single nucleotide fre-quency tells how much the motif differs from the single nucleotide distribution. This score is maximal if the motif is well conserved and differs considerably from the background distribution.
Information ContentD 1 W W X lD1 X b2fA,C,G,Tg qlblog± q b l q0b ² : (9)
As a nal score, we consider the likelihood, P .S; AjµW; Bm/, or the corresponding log-likelihood. The
motif and alignment positions are the results of maximum likelihood estimation and therefore the log-likelihood is a good measure for the quality of the motif. In this case, we are especially interested in the positive contribution of the motif to the global log-likelihood. If we write the probability of the sequence being generated by the background model, P .SjBm/, as P0, the log-likelihood can be calculated as
log¡¼.S; AjµW; Bm/ ¢ D log± CXmax cD0 °cP .SjAc; µW; Bm/P .AcjµW; Bm/ ² D log.C/ C log ±CXmax cD0 °cP .SjAc; µW; Bm/ ² ;
where Ac refers to the rst c positions in the alignment vector A, which contains Cmax positions, and C is
a constant representing the prior probability of the alignment vector, which is assumed to be uniform. The log-likelihood depends on the strength of the motif and also on the total number of instances of the motif. Each of these scores accounts for a speci c aspect of the motif. Together with these scores, the number of occurrences of a motif in the input sequences can be computed. We can use Equation 6 to estimate the number of occurrences of a motif in the data set.
3.5. Web interface
The implementation of our motif- nding algorithm is part of our INCLUSive web site (Thijs et al., 2002) and is accessible through a web interface: www.esat.kuleuven.ac.be/»dna/BioI/Software.html. On this web interface, the user can either paste the sequence in FASTA format or upload a le to enter the sequences. The user also has to de ne ve parameters. Here is a short description of these parameters. ² Background model Bm: Selects one of the precompiled models (A. thaliana or S. cerevisiae) as the
background model or compute the background model from the sequence data themselves.
² Length W : Determines the length of the motif, which is xed during the sampling. Reasonable values range from 5 to 15.
² Motifs N: Sets the number of different motifs to be searched for. The motifs will be searched for in consecutive runs while the positions of the previously found motifs are masked.
² Copies Cmax: Sets the maximum number of copies of a motif in every sequence. If this number is set
too high, noise will be introduced in the motif model and the performance will degrade.
² Overlap O: De nes the overlap allowed between the different motifs. This parameter is used only in the masking procedure.
4. DATA
4.1. G-box sequences
To validate our motif- nding algorithm, we rst constructed two data sets of gene upstream regions: 1) sequences with a known regulatory element, G-box, involved in light regulation in plants and 2) a selection of upstream sequences from A. thaliana in which no G-box is reported (random data set). The G-box data set consists of 33 sequences selected from PlantCARE (Lescot et al., 2002) containing 500bp upstream of the translation start and in which the position of the G-box is reported. This data set is well suited to give a proof of concept and to test the performance of the Motif Sampler, since we exactly know the consensus of the motif CACGTG and also the known occurrences of the motif in the sequences. The data can be found at www.plantgenetics.rug.ac.be/bioinformatics/lescot/Datasets/ListG-boxes.html.
The random set consists of 87 sequences of 500bp upstream of translation start in genes from A. thaliana. The genes in this set are supposed to contain no G-box binding site. This set is used to introduce noise into the test sets and to evaluate the performance of the Motif Sampler under noisy conditions.
4.2. MET sequences
A set of upstream sequences from 11 genes in S. Cerevisiae that are regulated by the Cb -Met4p-Met28p complex and Met31p or Met32p in response to methionine (van Helden et al., 1998) were obtained from www.ucmb.ulb.ac.be/bioinformatics/rsa-tools/. Upstream regions between ¡800 and ¡1 are selected. The consensus of both binding sites is given by TCACGTG for the Cb -Met4p-Met28p complex and AAAACTGTGG for Met31p or Met32p (van Helden et al., 1998). Figure 2 shows the putative locations based on sequence homology of the two binding sites. These locations are used to validate the motifs retrieved with the Motif Sampler.
4.3. Bacterial sequences
As a third test set, we created a data set with intergenic sequences from bacteria. The data set contains a subset of bacterial genes regulated by the O2-responsive transcriptional regulator FNR (Marchal, 1999).
The genes were selected from several bacterial species: Azospirillum brasilense, Paracoccus denitri cans, Rhodobacter sphaeroides, Rhodobacter capsulatus, Sinorhizobium meliloti, and Escherichia coli. The data set contains 10 intergenic sequences of varying length. The FNR motif is described in the literature as an interrupted palindrome of 14bp and the consensus, TTGACnnnnATCAA , consists of two conserved blocks of 5bp separated by a xed spacer of 4bp (as will be shown later, in Figure 6). The presence of the spacer will make the nal motif model more degenerate and will have an in uence on the performance of the Motif Sampler.
FIG. 2. Representation of the putative location of TCACGTG and AAACTGTGG in the MET sequence set.
4.4. Plant wounding data
As a last test set, we selected sequences from clusters of coexpressed genes. As a test case, we selected the data from Reymond et al. (2000), who measured the gene expression in response to mechanical wounding in A. thaliana. The mRNA was extracted from leaves at 30 minutes, 1 hour, 90 minutes, and 3, 6, 9, and 24 hours after wounding (7 time-points), and the expression level was measured on a cDNA microarray of 138 genes related to the plant defence mechanism. To nd the groups of coexpressed genes, we use an adaptive quality-based clustering which we developed in our group (De Smet et al., 2002) to identify groups of tightly coexpressed genes. This resulted in eight small clusters of coexpressed genes.
From the eight clusters found, four of them contained only three genes. These sets were not considered for further analysis. The remaining clusters contained, respectively, 11, 6, 5, and 5 sequences. The pro les of the clusters and the genes belonging to the clusters can be found at www.plantgenetics.rug.ac.be/bioinformatics/ lescot/Datasets/Wounding/Clusters.html. The automated upstream sequence retrieval of INCLUSive (Thijs et al., 2002) was used to nd the upstream sequences of the genes in each of the selected clusters. Finally, we truncated each retrieved sequence to 500bp upstream of the annotated translation start.
5. RESULTS
5.1. G-box sequences
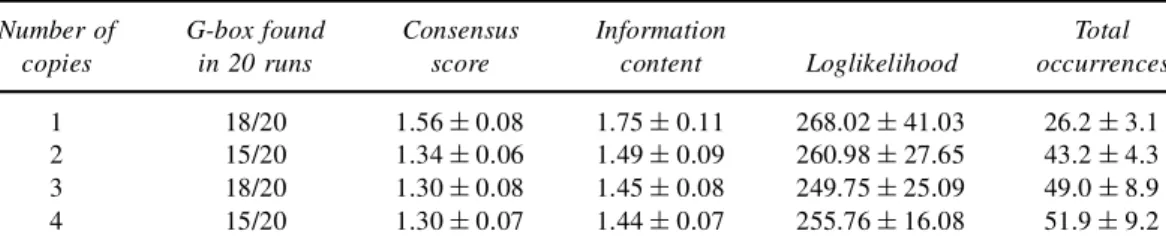
We exhaustively tested the performance of our implementation of the Motif Sampler. At rst, we set up a test with only the 33 G-box sequences. In this test, we looked only at the positive strand. We searched for six different motifs of 8bp and the maximal number of copies is varied between 1 and 4 and the allowed overlap was xed on 1bp. Each test was repeated 20 times. Table 1 gives an overview of the different scores. The rst column indicates the maximal number of copies of the motif. The second column gives the number of runs in which the G-box consensus CACGTG was found. The next three columns give the average of the different scores: consensus score, information content, and log-likelihood (see Section 3.4). The last column shows the average number of sites in the data set that the algorithm identi es as being representatives of the motif.
Table 1. Average and Variance of the Scores of the Motif Found in the G-Box Data Set
Number of G-box found Consensus Information Total copies in 20 runs score content Loglikelihood occurrences
1 18/20 1:56§ 0:08 1:75§ 0:11 268:02§ 41:03 26:2§ 3:1 2 15/20 1:34§ 0:06 1:49§ 0:09 260:98§ 27:65 43:2§ 4:3 3 18/20 1:30§ 0:08 1:45§ 0:08 249:75§ 25:09 49:0§ 8:9 4 15/20 1:30§ 0:07 1:44§ 0:07 255:76§ 16:08 51:9§ 9:2
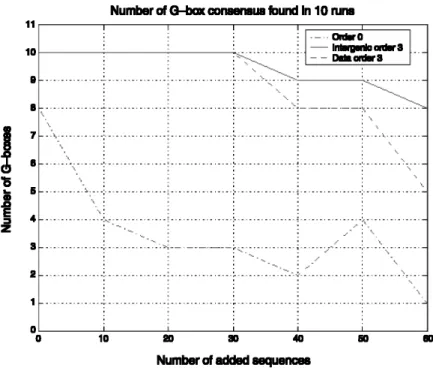
FIG. 3. Total number of times the G-box consensus is found in 10 repeated runs of the tests for three different
background models. The data set consists of the 33 G-box sequences and a xed number of added noisy sequences.
When the number of copies is set to 1, a more conserved motif is found, but a number of true occurrences is missed. Increasing the number of copies allows one to estimate better the true number of copies of the motif, but more noise is introduced into the initial model and the nal model is more degenerate. This is clearly indicated by the consensus score and the information content. Both scores decrease as the maximal number of copies increases. The number of representatives of the motifs detected by the algorithm increases with the number of copies. We can also see that the difference is most pronounced when increasing the number of copies from 1 to 2, but that there is not much difference between 3 and 4 copies. The trade-off between the number of occurrences and the degeneracy of the motif has to be taken into account when trying to nd the optimal parameters. For instance, when searching for 1 copy, the algorithm returns as consensus sequences mCACGTGG or CCACGTGk. When allowing up to 4 copies the algorithm will return more degenerate consensus sequences as nnCACGTG or mCArGTGk.
Another important issue is the in uence of noise on the performance of the Motif Sampler. Noise is due to the presence of upstream sequences that do not contain the motif. To introduce noise in the data set, we added in several consecutive tests each time 10 extra sequences, in which no G-box is reported, to the G-box data set. We exhaustively tested several con gurations to see how the noise in uences the performance of the Motif Sampler. In this extensive test, we limited the number of repeats to 10 for each test corresponding to a different set of parameters. Figure 3 shows the total number of times the G-box consensus was detected in ten runs for three different background models and an increasing number of added sequences when searching for a motif of length 8bp and the maximal number of copies set to 1. As can be expected, the number of times the G-box is detected decreases when more noise is added to the original set of 33 G-box sequences. This in uence is more dramatic for the single nucleotide background model than for the third-order background model. More details on the use of the higher-order background models are given elsewhere (Thijs et al., 2001).
5.2. MET sequences
In a subsequent set of tests, we experimented with the MET sequence set (in this case both strands are analyzed). In these tests, we used the higher-order background models compiled from the upstream regions of all the annotated genes in the yeast genome (van Helden et al., 2000b). With this data set, we further
explored the in uence of the different parameters on the performance of the algorithm. Preliminary tests showed that using a third-order background model was the best choice (data not shown), and we therefore used only the third-order background model in these tests. As in the G-box example, we ran our Motif Sampler with different combinations of parameters. In this case, we looked at the motif length W , the maximal number of copies Cmax, and the in uence of the total number of motifs N. Three different motif
lengths W were tested: 8, 10, and 12bp. The maximal number of copies Cmaxcould vary between 1 and 4.
First, N was set to 1, and each test, with a given set of parameters, was repeated 100 times. Since there are two different binding sites present in this data set, the algorithm should be able to pick up both of them. When searching for only one motif, the algorithm is surely not able to capture both in one run. Therefore the algorithm was tested with the number of different motifs N also set to 2, 3, and 4. Again, each test with a particular set of parameters was repeated 100 times. This means that in each test an additional 100 motifs are found.
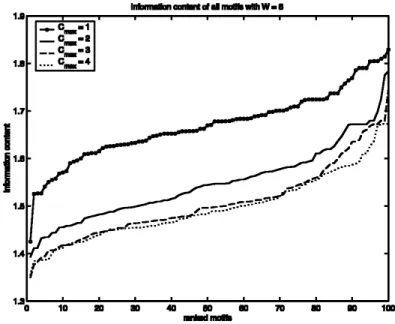
To analyze these results, we rst looked at the information content of the all motifs found (Equa-tion 9). Figure 4 shows how the informa(Equa-tion content changes when Cmax is increased from 1 to 4. On the
x-axis, the motifs are ranked with increasing information content, and the y-axis indicates the information content. Figure 4 clearly shows that when the maximal number of copies is increased the information content decreases. This is logical since more instances can be selected and the motif models become more degenerate. The effect is most pronounced when going from maximal 1 copy to 2 copies. Figure 5 shows how the information content changes when Cmaxis xed at 1 but the motif length is set to 8, 10, or 12bp.
Again, the plot clearly shows that on average the information content decreases when the length of the motif grows. This can be explained by the fact that the given information content is the average over all positions (see Equation 9). When the length of the motif is increased, noninformative positions can be added to the motif model, and therefore the information content decreases on average. This effect has to be taken into account when comparing the results of tests with different parameter settings.
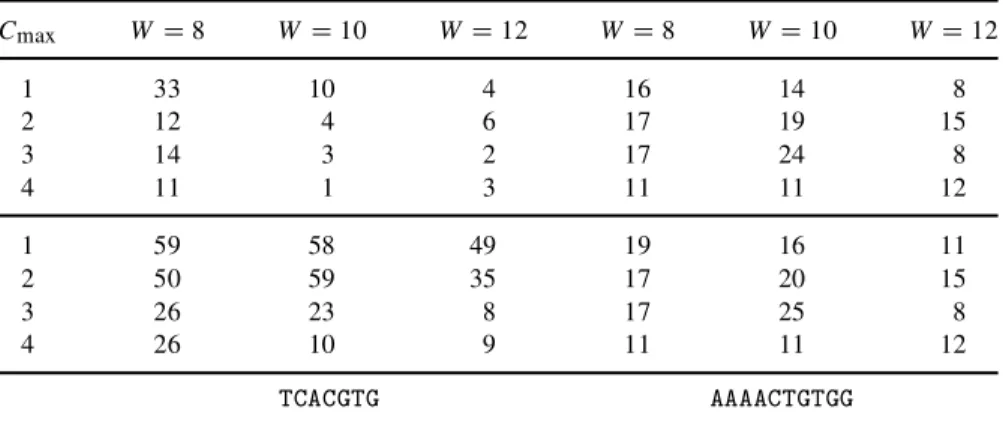
Next, the found motifs are further analyzed. Since prior knowledge about the binding sites was available, it was possible to compare the alignment vector of each retrieved motif with the putative location of the binding site. For each motif, the positions of all instances of the motif were compared with these putative positions. If at least 50% of the alignment positions correspond with one of the two known sites, the motif was considered as a good representative. A threshold of 50% corresponds to the number of instances needed to create a motif that resembles the consensus of a true motif. Table 2 gives an overview of the results when looking for the motifs that suf ciently overlap with the putative motifs. This table shows the
FIG. 4. Comparison of the information content of all motifs retrieved when searching for motifs of length 8bp and
FIG. 5. Comparison of the information content of all motifs retrieved when searching for motifs of length 8, 10,
and 12bp and the number of maximal copies xed to 1.
number of motifs found that overlap for three different motif lengths and four different values of Cmax.
The top part shows the result when we look at only one motif per run (100 motifs); the bottom part shows the results when we searched for four different motifs per run (400 motifs). When looking at the known motif TCACGTG, we can clearly see that the algorithm performed best when we searched for a motif of length 8bp and maximum 1 copy. This motif is only found in a few runs as the rst motif when searching for motifs of length 12; however, the performance improves when the number of motifs is increased to four per run. If we look at the motif AAACTGTGG, the overall performance is rather similar for all parameter settings. There is almost no increase of correct motifs as the number of motifs increases to four per run.
Another way to analyze the results is by looking at the retrieved motifs with the highest scores. This approach allowed us to check whether the best motifs found corresponded to the true motifs. In this partic-ular case, we looked at the information content (Equation 9). First, the motif with the highest information content was selected. Next, we removed all motifs in the list that were similar to the selected motif. Two motifs, µ1and µ2, are considered similar if the mutual information of both motifs was smaller than 0.7. To
Table 2. Number of Times a Known Motif is Found in the MET Sequence in 100 Motifs (Top) and 400 Motifs (Bottom)
Cmax W D 8 W D 10 W D 12 W D 8 W D 10 W D 12 1 33 10 4 16 14 8 2 12 4 6 17 19 15 3 14 3 2 17 24 8 4 11 1 3 11 11 12 1 59 58 49 19 16 11 2 50 59 35 17 20 15 3 26 23 8 17 25 8 4 26 10 9 11 11 12 TCACGTG AAAACTGTGG
Table 3. The Six Best Scoring Motifs of Length 8bp When Searching for 1, 2, 3 and 4 Different Motifs in 100 Tests
100 motifs 200 motifs 1 AACTGTGG 22 1.74 AACTGTGG 27 1.72 2 kCACGTGA 34 1.67 kCACGTGA 56 1.65 3 CGAAACCG 4 1.67 CGAAACCG 5 1.65 4 CGGsACCC 2 1.68 CGGsACCC 7 1.54 5 CTCCGGGT 3 1.69 AmGCCACA 4 1.66 6 CmGTCAAG 2 1.66 CTCCGGGT 5 1.67 300 motifs 400 motifs 1 AACTGTGG 28 1.71 AACTGTGG 35 1.66 2 kCACGTGA 62 1.64 kCACGTGA 64 1.63 3 CGAAACCG 7 1.61 CGAAACCG 7 1.61 4 CGGsACCC 10 1.54 CGGsACCC 15 1.50 5 AmGCCACA 7 1.61 AmGCCACA 7 1.60 6 CTCCGGGT 7 1.61 CTCCGGGT 7 1.61
calculate the mutual information, a shifted version of the motif is taken into account. To compensate for the length of the shifted motif, a normalizing factor was introduced in the formula of the mutual information, which leads to the following equation:
mutual informationD W1 W X jD1 4 X iD1 µ1.i; j /¤ log2 ± µ1.i; j / µ2.i; j / ² : (10)
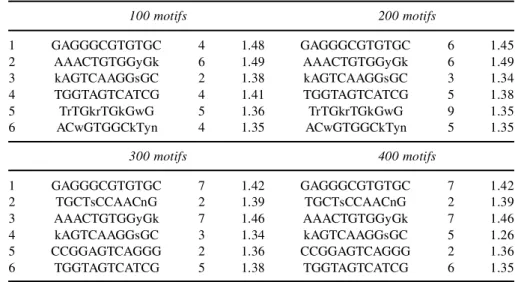
After removal of the similar motifs, the same procedure was repeated six times on the reduced set of motifs. We applied this methodology on all different tests, but here we show the results for two particular parameter settings. Table 3 and Table 4 give an overview of the six best motifs found when searching for motifs of, respectively, 8bp and 12bp that can have maximum one copy. The tables are split in four
Table 4. The Six Best Scoring Motifs of Length 12bp When Searching for 1, 2, 3 and 4 Different Motifs in 100 Tests
100 motifs 200 motifs 1 GAGGGCGTGTGC 4 1.48 GAGGGCGTGTGC 6 1.45 2 AAACTGTGGyGk 6 1.49 AAACTGTGGyGk 6 1.49 3 kAGTCAAGGsGC 2 1.38 kAGTCAAGGsGC 3 1.34 4 TGGTAGTCATCG 4 1.41 TGGTAGTCATCG 5 1.38 5 TrTGkrTGkGwG 5 1.36 TrTGkrTGkGwG 9 1.35 6 ACwGTGGCkTyn 4 1.35 ACwGTGGCkTyn 5 1.35 300 motifs 400 motifs 1 GAGGGCGTGTGC 7 1.42 GAGGGCGTGTGC 7 1.42 2 TGCTsCCAACnG 2 1.39 TGCTsCCAACnG 2 1.39 3 AAACTGTGGyGk 7 1.46 AAACTGTGGyGk 7 1.46 4 kAGTCAAGGsGC 3 1.34 kAGTCAAGGsGC 5 1.26 5 CCGGAGTCAGGG 2 1.36 CCGGAGTCAGGG 2 1.36 6 TGGTAGTCATCG 5 1.38 TGGTAGTCATCG 6 1.35
FIG. 6. FNR binding site logo.
parts with respect to the total number of motifs per run in each set.1For each of the sets, the consensus sequences, together with the number of similar motifs in the list and the average information content of the best six motifs, are shown. Table 3 clearly shows that the two true motifs are found as the two top-scoring motifs in this test. The other motifs have a low number of occurrences. These numbers deteriorate as shown in Table 4. In this example, we looked for motifs of length 12bp. As was described previously, the scores of the motifs are on average much lower than in the case of motifs of length 8bp. Now, only the consensus of the second motifs is found, but only in 6 out of 100 motifs. If we compare Table 4 with Table 2, we see that 49 motifs are found to overlap with TCACGTG, but this motif is not found as one of the top-scoring motifs, since a large part of the motif of length 12bp contains noninformative positions and has a low information content.
5.3. Bacterial sequences
Since no precompiled background model was available, a background model of order 1 was compiled from the sequence data. The order of the background model is limited by the number of nucleotides in the data set. We tested several parameters settings. Varying the motif length from 5bp to 14bp had a profound impact on the motif detection. When searching for a short motif, 5–6bp, the Motif Sampler found both consecutive parts, but when the length was increased only one of the two parts was found due to the masking of the site after an iteration. When the motif length was set to 14bp, the Motif Sampler retrieved the consensus sequence of the described motif. The motif logo is shown in Fig. 6. Table 5 gives a more descriptive overview of the results when we searched for a motif of length 14bp that can have 1 copy. The rst two columns identify the genes by their accession number and gene name. The third column gives the position of the retrieved site in the input sequence. The fourth column gives the site. In the next column, there is the probability of nding this motif in the sequence. It is clear that all the motifs are found with a high probability score. This means that the Motif Sampler is very con dent on nding the motif in the sequences.
The last column in Table 5 indicates whether the site found by the Motif Sampler corresponds to the site described in the annotation of the corresponding sequences. There are six sequences for which the annotated site matches exactly the site retrieved by the Motif Sampler. In one case, the sequence upstream of the gene ccoN, the Motif Sampler retrieves a site, TTGACGCAGATCAA , that matches the consensus but that is located at another position than the one in the GenBank annotation. The site found in the annotation, AGTTTCACCTGCATC , differs strongly from the consensus. In three other sequences, there is no element annotated in the GenBank entry, but the Motif Sampler nds a motif occurrence.
1A smaller set is contained in the larger sets. The set of 200 motifs contains the set of the rst 100 motifs together
Table 5. Detection of the FNR O2-Responsive Element
Accn Gene Position Site Prob. Annotation
af016223 ccoN 60 TTGACGCGGATCAA 1.0000 — af054871 cytN 255 TTGACGTAGATCAA 1.0000 match pdu34353 ccoN 131 TTGACGCAGATCAA 1.0000 ? pdu34353 ccoG 210 TTGACGCAGATCAA 1.0000 match af195122 bchE 82 TTGACATGCATCAA 0.9998 — af016236 dorS 8 TTGACGTCAATCAA 1.0000 — ae000220 narK 267 TTGATTTACATCAA 0.9986 match z80340 xNc 104 TTGATGTAGATCAA 1.0000 match z80339 xNd 240 TTGACGCAGATCAA 1.0000 match pdu34353 fnr 36 TTGACCCAAATCAA 0.9999 match
5.4. Plant wounding data
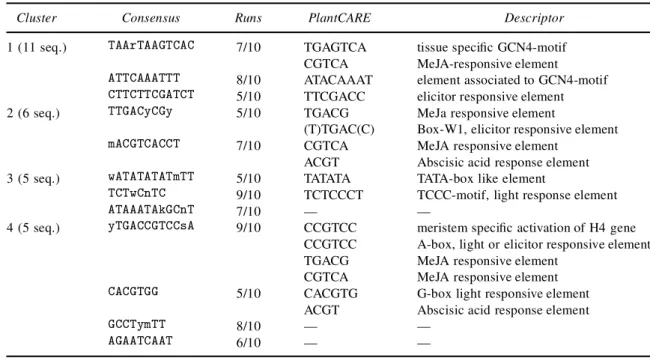
The previous examples can be seen as proof-of-concept tests to illustrate the performance of the Motif Sampler. To analyze a real life problem, the Motif Sampler was run on four sets of upstream regions from coexpressed genes. In these tests, we looked for six different motifs of length 8 and 12bp which can have 1 copy. To distinguish stable motifs from motifs found by chance, we repeated each experiment 10 times and only those motifs were selected that occur in at least ve runs. The results with the A. thaliana background model of order 3 are shown in Table 6, since they gave the most promising results. We repeated the same tests with the single nucleotide background model, but these results were not as promising as the ones shown in Table 6. In the rst column, we give the cluster number and the number of sequences in the cluster. The second column shows the consensus sequences, which are a compilation of the consensus sequences of length 8 and 12bp. Only the relevant part of the consensus is displayed. Together with the consensus, the number of times the consensus was found in 10 runs is indicated. The most frequent motifs are shown here.
Table 6. Results of the Motif Search in 4 Clusters for the Third Order Background Modela
Cluster Consensus Runs PlantCARE Descriptor
1 (11 seq.) TAArTAAGTCAC 7/10 TGAGTCA tissue speci c GCN4-motif CGTCA MeJA-responsive element ATTCAAATTT 8/10 ATACAAAT element associated to GCN4-motif CTTCTTCGATCT 5/10 TTCGACC elicitor responsive element 2 (6 seq.) TTGACyCGy 5/10 TGACG MeJa responsive element
(T)TGAC(C) Box-W1, elicitor responsive element mACGTCACCT 7/10 CGTCA MeJA responsive element
ACGT Abscisic acid response element 3 (5 seq.) wATATATATmTT 5/10 TATATA TATA-box like element
TCTwCnTC 9/10 TCTCCCT TCCC-motif, light response element
ATAAATAkGCnT 7/10 — —
4 (5 seq.) yTGACCGTCCsA 9/10 CCGTCC meristem speci c activation of H4 gene CCGTCC A-box, light or elicitor responsive element TGACG MeJA responsive element
CGTCA MeJA responsive element CACGTGG 5/10 CACGTG G-box light responsive element
ACGT Abscisic acid response element
GCCTymTT 8/10 — —
AGAATCAAT 6/10 — —
aIn the second column, the consensus of the found motif is given together with the number of times this motif was found in the
To assign a potential functional interpretation to the motifs, the consensus of the motifs was compared with the entries described in PlantCARE (Lescot et al., 2002). We found several interesting motifs: methyl jasmonate (MeJa) responsive elements, elicitor-responsive elements, and the abscisic acid response element (ABRE). It is not surprising to nd these elements in gene promoters induced by wounding, because there is a clear cross-talk between the different signal pathways leading to the expression of inducible defence genes (Birkenmeier and Ryan, 1998; Reymond and Farmer, 1998; Rouster et al., 1997; Pena-Cortes et al., 1989). Depending on the nature of a particular aggressor (wounding/insects, fungi, bacteria, virus) the plant ne-tunes the induction of defence genes either by employing a single signal molecule or by a combination of the three regulators jasmonic acid, ethylene, and salicylic acid. In the third and fourth cluster, there are also some strong motifs found that do not have a corresponding motif in PlantCARE. These motifs look promising but need some further investigation.
6. CONCLUSION
We have introduced a modi ed version of the original Gibbs Sampler algorithm to detect regulatory elements in the upstream region of DNA sequences, and we have presented two speci c modi cations. The rst change is the use of a probability distribution to estimate the number of copies of a motif in each sequence. The second contribution is the inclusion of a higher-order background model instead of using single nucleotide frequencies as the background model. These two modi cations are incorporated in the iterative scheme of the algorithm that is presented in this paper.
In this manuscript, we showed that our implementation of the Gibbs sampling algorithm for motif nding is able to nd overrepresented motifs in several well-described test sets of upstream sequences. We focused on the in uence of the different parameters on the performance of the algorithm. We explored different methodologies to analyze the motifs retrieved with our motif- nding algorithm. We tested our implementation on three sets of upstream sequences in which one or more known regulatory elements are present. These data sets allowed us to quantify, up to a certain level of con dence, the performance of our Motif Sampler. The tests showed that the performance increases if the parameters better match the true motif occurrence. Finally, to test the biological relevance of our algorithm, we also used our Motif Sampler to nd motifs in sets of coexpressed genes from a microarray experiment. Here we selected those motifs that regularly occur in the repeated tests done on the sets of upstream sequences of each selected cluster. By comparing the selected motifs with the known motifs in PlantCARE, we could identify some interesting motifs among those selected motifs, which are involved in plant defense and stress response.
The algorithm is accessible through a web interface where only a limited number of parameters has to be set by the user. These parameters are simply de ned and easy to interpret. Users do not need to go through the details of the implementation to understand how to choose reasonable parameter settings.
Furthermore, we will extend the implementation to improve the usability and performance. First, we will implement a method to automatically detect the optimal length of the motif. Currently, the length of the motif is de ned by the user and kept xed during sampling. Second, we will further optimize the procedure to nd the number of copies of the motif in the sequence, which is closely related to the improvement of the motif scores. The ultimate goal is to develop a robust algorithm with as few user-de ned parameters as possible. When the parameters are handled well, we will focus on the development of more-speci c motif models, such as short palindromic motifs separated by a small variable gap. Also, the combined occurrence of motifs is of greater importance. In the current setup of the algorithm, we will nd only individual motifs in consecutive iterations, and there is no clear connection between these motifs. From a biological point of view, it will be very interesting to nd signi cant combinations of motifs in those sets of coexpressed genes. Moreover, the probabilistic framework in which the Motif Sampler is implemented is well suited to incorporate prior biological knowledge in the sequence model (such as when we already know a few examples of the motif but there is not yet enough information to build a complete model).
ACKNOWLEDGMENTS
Gert Thijs is research assistant with the IWT (Institute for the Promotion of Innovation by Science and Technology in Flanders); Kathleen Marchal and Yves Moreau are postdoctoral researchers of the FWO
(Fund for Scienti c Research—Flanders); Prof. Bart De Moor is full time professor at the K.U.Leuven. Pierre Rouzé is Research Director of INRA (Institut National de la Recherche Agronomique, France). This work is partially supported by IWT projects STWW-980396; Research Council K.U.Leuven: GOA Me sto-666; FWO project: G.0115.01; IUAP P4-02 (1997-2001). The scienti c responsibility is assumed by its authors. We like to thank the reviewers of this manuscript for their valuable comments.
REFERENCES
Altman, R.B., and Raychaudhuri, S. 2001. Whole-genome expression analysis: Challenges beyond clustering. Curr.
Opin. Struct. Biol. 11, 340–347.
Audic, S., and Claverie, J-M. 1997. Detection of eukaryotic promoters using Markov transition matrices. Comput.
Chem. 21(4), 223–227.
Bailey, T. L., and Elkan, C. 1995. Unsupervised learning of multiple motifs in biopolymers using expectation maxi-mization. Machine Learning 21, 51–80.
Birkenmeier, G.F., and Ryan, C.A. 1998. Wound signaling in tomato plants. Evidence that aba is not a primary signal for defense gene activation. Plant Physiol. 117(2), 687–693.
Bucher, P. 1999. Regulatory elements and expression pro les. Curr. Opin. Struct. Biol. 9, 400–407.
De Smet, F., Marchal, K., Mathys, J., Thijs, G., De Moor, B., and Moreau, Y. 2002. Adaptive Quality-Based Clustering of Gene Expression Pro les. Bioinformatics, in press.
Delcher, A.L., Harman, D., Kasif, S., White, O., and Salzberg, S.L. 1999. Improved microbial gene identi cation with glimmer. Nucl. Acids Res. 27(23), 4636–4641.
Eisen, M.B., Spellman, P.T., Brown, P.O., and Botstein, D. 1998. Cluster analysis and display of genome-wide expres-sion patterns. Proc. Natl. Acad. Sci. USA 95, 14863–14868.
Heyer, L.J., Kruglyak, S., and Yooseph, S. 1999. Exploring expression data: Identi cation and analysis of coexpressed genes. Genome Res. 9, 1106–1115.
Hughes, J.D., Estep, P.W., Tavazoie, S., and Church, G.M. 2000. Computational identi cation of cis-regulatory ele-ments associated with groups of functionally related genes in Saccharomyces cerevisiae. J. Mol. Biol. 296, 1205– 1214.
Jensen, L.J., and Knudsen, S. 2000. Automatic discovery of regulatory patterns in promoter regions based on whole cell expression data and functional annotation. Bioinformatics 16(4), 326–333.
Krogh, A. 1997. Two methods for improving performance of an HMM and their application for gene nding. 5th Intl.
Conf. Intelligent Systems in Molecular Biology, 179–186.
Lawrence, C.E., Altschul, S.F., Boguski, M.S., Liu, J.S., Neuwald, A.F., and Wootton, J.C. 1993. Detecting subbtle sequence signals: A Gibbs sampling strategy for multiple alignment. Science 262, 208–214.
Lescot, M., Déhais, P., Thijs, G., Marchal, K., Moreau, Y., de Peer, Y. Van, Rouzé, P., and Rombauts, S. 2002. PlantCARE, a database of plant cis-acting regulatory elements and a portal to tools for in silico analysis of promoter sequences. Nucl. Acids Res. 30, 325–327.
Liu, J.S., Neuwald, A.F., and Lawrence, C.E. 1995. Bayesian models for multiple local sequence alignment and gibbs sampling strategies. J. Am. Stat. Assoc. 90(432), 1156–1170.
Liu, X., Brutlag, D.L., and Liu, J.S. 2001. Bioprospector: Discovering conserved DNA motifs in upstream regulatory regions of co-expressed genes. Proc. Paci c Symposium on Biocomputing, vol. 6, 127–138.
Lockhart, D.J., and Winzeler, E.A. 2000. Genomics, gene expression and DNA arrays. Nature 405, 827–836. Lukashin, A.V., and Borodowsky, M. 1998. GeneMark.hmm: New solutions for gene nding. Nucl. Acids Res. 26,
1107–1115.
Marchal, Kathleen. 1999. The O2 paradox of Azospirillum brasilense under diazotrophic conditions. PhD. Thesis,
FLTBW, KULeuven.
McCue, L.A., Thompson, W., Carmack, C.S., Ryan, M.P., Liu, J.S., Derbyshire, V., and Lawrence, C.E. 2001. Phylo-genetic footprinting of transcription factor binding sites in proteobacterial genomes. Nucl. Acids Res. 29, 774–782. Mjolsness, E., Mann, T., Castaño, R., and Wold, B. 2000. From coexpression to coregulation: An approach to inferring
transcriptional regulation among gene classes from large-scale expression data. S.A. Solla, T.K. Leen, and K.R. Muller, eds. Advances in Neural Information Processing Systems, vol. 12.
Ohler, U., Harbeck, S., Niemann, H., Nöth, E., and Reese, M.G. 1999. Interpolated Markov chains for eukaryotic promotor recognition. Bioinformatics 15(5), 362–369.
Ohler, U., and Niemann, H. 2001. Identi cation and analysis of eukaryotic promoters: Recent computational ap-proaches. Trends Genet. 17(2), 56–60.
Pavy, N., Rombauts, S., Déhais, P., Mathé, C., Ramana, D.V.V., Leroy, P., and Rouzé, P. 1999. Evaluation of gene prediction software using a genomic data set: Application to Arabidopsis thaliana sequences. Bioinformatics 15, 887–899.
Pena-Cortes, H., Sanchez-Serrano, J.J., Mertens, R., Willmitzer, L., and Prat, S. 1989. Abscisic acid is involved in the wound-induced expression of the proteinase inhibitor II gene potato and tomato. Proc. Natl. Acad. Sci USA 86, 9851–9855.
Reymond, P., and Farmer, E.E. 1998. Jasmonate and salicylate as global signals for defense gene expression. Curr.
Opin. Plant Biol. 1(5), 404–411.
Reymond, P., Weber, H., Damond, M., and Farmer, E.E. 2000. Differential gene expression in response to mechanical wounding and insect feeding in Arabidopsis. Plant Cell 12, 707–719.
Roth, F.P., Hughes, J.D., Estep, P.W., and Church, G.M. 1998. Finding DNA regulatory motifs within unaligned noncoding sequences clustered by whole genome mRNA quantitation. Nature Biotech. 16, 939–945.
Rouster, J., Leah, R., Mundy, J., and Cameron-Mills, V. 1997. Identi cation of a methyl jasmonate-responsive region in the promoter of a lipoxygenase-1 gene expressed in barley grain. Plant J. 11(3), 513–523.
Sherlock, G. 2000. Analysis of large-scale gene expression data. Curr. Opin. Immunol. 12, 201–205.
Sinha, S., and Tompa, M. 2000. A statistical method for nding transcription factor binding sites. 8th Intl. Conf.
Intelligent Systems for Molecular Biology, vol. 8, 37–45.
Szallasi, Z. 1999. Genetic network analysis in light of massively parallel biological data acquisition. Proc. Paci c
Symposium on Biocomputing 99, vol. 4, 5–16.
Tavazoie, S., Hughes, J.D., Campbell, M.J., Cho, R.J., and Church, G.M. 1999. Systematic determination of genetic network architecture. Nature Genet. 22(7), 281–285.
Thijs, G., Lescot, M., Marchal, K., Rombauts, S., De Moor, B., Rouzé, P., and Moreau, Y. 2001. A higher order background model improves the detection of promoter regulatory elements by Gibbs sampling. Bioinformatics 17(12), 1113–1122.
Thijs, G., Moreau, Y., Smet, F. De, Mathys, J., Lescot, M., Rombauts, S., Rouzé, P., De Moor, B., and Marchal, K. 2002. INCLUSive: INtegrated CLustering, Upstream sequence retrieval and motif Sampling. Bioinformatics 18(2), 331–332.
Tompa, M. 1999 (August). An exact method for nding short motifs in sequences, with application to the ribosome binding site problem. 7th Intl. Conf. Intelligent Systems for Molecular Biology, vol. 7, 262–271.
van Helden, J., André, B., and Collado-Vides, L. 1998. Extracting regulatory sites from upstream region of yeast genes by computational analysis of oligonucleotide frequencies. J. Mol. Biol. 281, 827–842.
van Helden, J., Rios, A.F., and Collado-Vides, J. 2000a. Discovering regulatory elements in non-coding sequences by analysis of spaced dyads. Nucleic Acids Res. 28(8), 1808–1818.
van Helden, J., André, B., and Collado-Vides, L. 2000b. A web site for the computational analysis of yeast regulatory sequences. Yeast 16, 177–187.
Vanet, A., Marsan, L., Labigne, A., and Sagot, M.F. 2000. Inferring regulatory elements from a whole genome. An analysis of Helicobacter pylori sigma80 family of promoter signals. J. Mol. Biol. 297(2), 335–353.
Wen, X., Fuhrman, S., Michaels, G. S., Carr, D. B., Smith, S., Barker, J. L., and Somogyi, R. 1998. Large-scale temporal gene expression mapping of central nervous system development. Proc. Natl. Acad. Sci. USA 95, 334–339. Workman, C.T., and Stormo, G.D. 2000. ANN-SPEC: A method for discovering transcription binding sites with
improved speci city. Proc. Paci c Symposium on Biocomputing, vol. 5, 464–475.
Zhang, M.Q. 1999. Large-scale gene expression data analysis: A new challenge to computational biologists. Genome
Res. 9, 681–688.
Zhu, J., and Zhang, M.Q. 2000. Cluster, function and promoter: analysis of yeast expression array. Proc. Paci c
Symposium on Biocomputing, vol. 5, 467-486.
Address correspondence to: Gert Thijs K.U. Leuven ESAT-SCD Kasteelpark Arenberg 10 3001 Leuven, Belgium E-mail: GertThijs@esat.kuleuven.ac.be
This article has been cited by:
1. Cornelia Spycher, Emily K. Herman, Laura Morf, Weihong Qi, Hubert Rehrauer, Catharine Aquino Fournier, Joel B. Dacks, Adrian B. Hehl. 2013. An ER-directed transcriptional response to unfolded protein stress in the absence of conserved sensor-transducer proteins in Giardia lamblia.
Molecular Microbiology n/a-n/a. [CrossRef]
2. Liu Wei, Chen Hanwu, Chen Ling. 2013. An ant colony optimization based algorithm for identifying gene regulatory elements. Computers in Biology and Medicine . [CrossRef]
3. Wei Liu, Hanwu Chen, Ling Chen, Yixin Chen. 2013. A Novel Ant Colony Optimization Based Algorithm for Identifying Gene Regulatory Elements. Journal of Computers 8:3. . [CrossRef] 4. F. Zambelli, G. Pesole, G. Pavesi. 2013. Motif discovery and transcription factor binding sites before
and after the next-generation sequencing era. Briefings in Bioinformatics 14:2, 225-237. [CrossRef] 5. A. M. Mehdi, M. S. B. Sehgal, B. Kobe, T. L. Bailey, M. Boden. 2013. DLocalMotif: a discriminative approach for discovering local motifs in protein sequences. Bioinformatics 29:1, 39-46. [CrossRef]
6. Ghasem Mahdevar, Mehdi Sadeghi, Abbas Nowzari-Dalini. 2012. Transcription factor binding sites detection by using alignment-based approach. Journal of Theoretical Biology 304, 96-102. [CrossRef]
7. Roger Revilla-i-Domingo, Ivan Bilic, Bojan Vilagos, Hiromi Tagoh, Anja Ebert, Ido M Tamir, Leonie Smeenk, Johanna Trupke, Andreas Sommer, Markus Jaritz, Meinrad Busslinger. 2012. The B-cell identity factor Pax5 regulates distinct transcriptional programmes in early and late B lymphopoiesis. The EMBO Journal 31:14, 3130-3146. [CrossRef]
8. Mauricio Quimbaya, Klaas Vandepoele, Eric Raspé, Michiel Matthijs, Stijn Dhondt, Gerrit T. S. Beemster, Geert Berx, Lieven Veylder. 2012. Identification of putative cancer genes through data integration and comparative genomics between plants and humans. Cellular and Molecular Life
Sciences 69:12, 2041-2055. [CrossRef]
9. M. Claeys, V. Storms, H. Sun, T. Michoel, K. Marchal. 2012. MotifSuite: workflow for probabilistic motif detection and assessment. Bioinformatics . [CrossRef]
10. A. Yamashita, Y. Shichino, H. Tanaka, E. Hiriart, L. Touat-Todeschini, A. Vavasseur, D.-Q. Ding, Y. Hiraoka, A. Verdel, M. Yamamoto. 2012. Hexanucleotide motifs mediate recruitment of the RNA elimination machinery to silent meiotic genes. Open Biology 2:3, 120014-120014. [CrossRef] 11. Stein AertsComputational Strategies for the Genome-Wide Identification of cis-Regulatory
Elements and Transcriptional Targets 98, 121-145. [CrossRef]
12. Phillip Seitzer, Elizabeth G Wilbanks, David J Larsen, Marc T Facciotti. 2012. A Monte Carlo-based framework enhances the discovery and interpretation of regulatory sequence motifs. BMC
Bioinformatics 13:1, 317. [CrossRef]
13. Jian-Jun Shu, Kian Yan Yong, Weng Kong Chan. 2012. An Improved Scoring Matrix for Multiple Sequence Alignment. Mathematical Problems in Engineering 2012, 1-9. [CrossRef]
14. Amin Zia, Alan M Moses. 2012. Towards a theoretical understanding of false positives in DNA motif finding. BMC Bioinformatics 13:1, 151. [CrossRef]
15. Shan Wang, Yanbin Yin, Qin Ma, Xiaojia Tang, Dongyun Hao, Ying Xu. 2012. Genome-scale identification of cell-wall related genes in Arabidopsis based on co-expression network analysis.
BMC Plant Biology 12:1, 138. [CrossRef]
16. Xuhua Xia. 2012. Position Weight Matrix, Gibbs Sampler, and the Associated Significance Tests in Motif Characterization and Prediction. Scientifica 2012, 1-15. [CrossRef]
17. Hui Jia, Jinming Li. 2012. Finding Transcription Factor Binding Motifs for Coregulated Genes by Combining Sequence Overrepresentation with Cross-Species Conservation. Journal of Probability
and Statistics 2012, 1-18. [CrossRef]
18. T. Kim, M. S. Tyndel, H. Huang, S. S. Sidhu, G. D. Bader, D. Gfeller, P. M. Kim. 2011. MUSI: an integrated system for identifying multiple specificity from very large peptide or nucleic acid data sets. Nucleic Acids Research . [CrossRef]
19. Martin Technau, Meike Knispel, Siegfried Roth. 2011. Molecular mechanisms of EGF signaling-dependent regulation of pipe, a gene crucial for dorsoventral axis formation in Drosophila.
Development Genes and Evolution . [CrossRef]
20. R. Yan, P. C. Boutros, I. Jurisica. 2011. A Tree-based Approach for Motif Discovery and Sequence Classification. Bioinformatics . [CrossRef]
21. Wendy M. Reeves, Tim J. Lynch, Raisa Mobin, Ruth R. Finkelstein. 2011. Direct targets of the transcription factors ABA-Insensitive(ABI)4 and ABI5 reveal synergistic action by ABI4 and several bZIP ABA response factors. Plant Molecular Biology 75:4-5, 347-363. [CrossRef]
22. Olivier Harismendy, Dimple Notani, Xiaoyuan Song, Nazli G. Rahim, Bogdan Tanasa, Nathaniel Heintzman, Bing Ren, Xiang-Dong Fu, Eric J. Topol, Michael G. Rosenfeld, Kelly A. Frazer. 2011. 9p21 DNA variants associated with coronary artery disease impair interferon-γ signalling response. Nature 470:7333, 264-268. [CrossRef]
23. Federico Zambelli, Giulio PavesiAlgorithmic Issues in the Analysis of Chip-Seq Data 425-448. [CrossRef]
24. Kristene L Henne, Xiu-Feng Wan, Wei Wei, Dorothea K Thompson. 2011. SO2426 is a positive regulator of siderophore expression in Shewanella oneidensis MR-1. BMC Microbiology 11:1, 125. [CrossRef]
25. Yoshiharu Y Yamamoto, Yohei Yoshioka, Mitsuro Hyakumachi, Kyonoshin Maruyama, Kazuko Yamaguchi-Shinozaki, Mutsutomo Tokizawa, Hiroyuki Koyama. 2011. Prediction of transcriptional regulatory elements for plant hormone responses based on microarray data. BMC
Plant Biology 11:1, 39. [CrossRef]
26. Eleftherios Pilalis, Aristotelis A Chatziioannou, Asterios I Grigoroudis, Christos A Panagiotidis, Fragiskos N Kolisis, Dimitrios A Kyriakidis. 2011. Escherichia coli genome-wide promoter analysis: Identification of additional AtoC binding target elements. BMC Genomics 12:1, 238. [CrossRef] 27. Barbara M. A. De Coninck, Jan Sels, Esther Venmans, Wannes Thys, Inge J. W. M. Goderis,
Delphine Carron, Stijn L. Delauré, Bruno P. A. Cammue, Miguel F. C. De Bolle, Janick Mathys. 2010. Arabidopsis thaliana plant defensin AtPDF1.1 is involved in the plant response to biotic stress. New Phytologist 187:4, 1075-1088. [CrossRef]
28. Xuefeng Fang, Wei Yu, Lisha Li, Jiaofang Shao, Na Zhao, Qiyun Chen, Zhiyun Ye, Sheng-Cai Lin, Shu Zheng, Biaoyang Lin. 2010. ChIP-seq and Functional Analysis of the SOX2 Gene in Colorectal Cancers. OMICS: A Journal of Integrative Biology 14:4, 369-384. [Abstract] [Full Text HTML] [Full Text PDF] [Full Text PDF with Links]
29. M. C. Sleumer, A. K. Mah, D. L. Baillie, S. J. M. Jones. 2010. Conserved elements associated with ribosomal genes and their trans-splice acceptor sites in Caenorhabditis elegans. Nucleic Acids
Research 38:9, 2990-3004. [CrossRef]
30. V. Narang, A. Mittal, W. K. Sung. 2010. Localized motif discovery in gene regulatory sequences.
Bioinformatics 26:9, 1152-1159. [CrossRef]
31. G. Li, B. Liu, Y. Xu. 2010. Accurate recognition of cis-regulatory motifs with the correct lengths in prokaryotic genomes. Nucleic Acids Research 38:2, e12-e12. [CrossRef]
32. M. Defrance, J. van Helden. 2009. info-gibbs: a motif discovery algorithm that directly optimizes information content during sampling. Bioinformatics 25:20, 2715-2722. [CrossRef]