British Journal of Nutrition (19941, 72, 579-599 579
Fibre-mediated physiological
effects of
raw and processed
carrots in humans*
BY ELISABETH WISKER', T H O M A S F. SCHWEJZERa, M A R T I N A DANIEL' A N D W A L T E R F E L D H E I M l
Christian-Albrechts University of Kiel, Institute of Human Nutrition and Food Science, Dusternbrooker Weg 17, 0-24105 Kiel, Germany
Nestle' Research Centre, Nestec Ltd, Vers-chez-les-Blanc, CH-I000 Lausanne 26, Switzerland
(Received 15 February 1993 - Revised 24 January I994 - Accepted 1 February 1994)
Fibre-mediated physiological effects of raw and processed carrots were investigated in twenty-four young women under strict dietary control in two randomized crossover studies. For 3 weeks between 405 and 688 g of either raw frozen, blanched or canned carrots (first study), or raw or raw frozen carrots (second study) were consumed in addition to a low-fibre basal diet. Carrots provided 15 g dietary fibre (DF)/d. Total DF intake was 16.0 to 19.0 g (control periods) and 31 to 34 g (experimental periods). Faecal bulking effects of raw and processed carrots were similar (between 2.4 and 3.7 g additional stoollg carrot fibre in the diet). Faecal excretion of dry matter, fibw, and protein also increased significantly during carrot consumption. Fermentability of carrot fibre constituents was high (91-94 %) and independent of processing, in spite of differences in the distribution of soluble and insoluble fibre and in the texture of raw and processed carrots. There was no effect of either type of carrot on serum total and high-density- lipoprotein-cbolesterol or on faecal bile acid excretion.
Carrots : Fibre : Humans
Much of the plant food we consume is processed. Freezing, blanching, cooking and canning are procedures which are often applied to vegetables. Cooking especially is usually accompanied by tissue softening and changes in textural characteristics. Heating can affect the fibre content or modify the fibre distribution between water-soluble and insoluble
fractions in several ways (Anderson & Clydesdale, 1980; Nyman et al. 19873; Lintas &
Cappeloni, 1988). Losses of soluble components such as sugars and minerals into the
cooking water result in an apparent increase in fibre content. Solubilization of insoluble
fibre increases the portion of soluble fibre. Degradation of polysaccharides into low-
molecular-weight fragments can have the same effect, but it can also decrease total fibre content, if oligosaccharides are formed which escape analysis by the normal methods for dietary fibre.
The chemical structure and the physicochemical properties of dietary fibre are both thought to determine their physiological effects. Therefore, it is often stated that modification of these properties may affect the action of fibre. Fibre sources containing high proportions of insoluble components like cereal brans and whole grain cereals have good faecal bulking capacities (Cummings, 1986), however, cooking of bran diminishes this
* Presented in part at the symposium Fibre 90: Chemical and Biological Aspects ofDietary Fibre, April 1990
580 E. W I S K E R A N D O T H E R S
effect (Wyman et al. 1976). More soluble types of fibre like those contained in fruits and vegetables or purified fibres like pectin are less effective in this respect. On the other hand,
these fibres have a greater effect on blood lipids and on carbohydrate metabolism when
they are consumed in sufficient amounts (Berger & Venhaus, 1992; Truswell & Beynen, 1992). Many actions of fibre are influenced by its fermentability in the large intestine. The effect on stool weight seems to be inversely related to the bacterial degradation of fibre (Stephen & Cummings, 1980a). Soluble fibres are more easily fermented than insoluble fibres (Cummings, 1984). Heat treatment of cereals at low moisture, like popping and extrusion cooking, has been shown to increase fibre fermentability in the rat due to an
increase of soluble components (Bjorck et al. 1984; Nyman et al. 1987a).
However, few human studies have actually addressed the effects of processing at high moisture levels such as those found in vegetables. The purpose of the present investigation was therefore to provide information on whether or not processing of a commonly eaten vegetable, i.e. carrots, affected the composition and solubility of fibre and thereby its physiological action in humans. Our main focus points in this study were colonic fermentation, bulking capacity of carrot fibre, and faecal excretion of fat, protein and bile acids. In addition, we hoped to resolve the question of whether or not carrots and carrot fibres exert cholesterol-lowering effects (Jenkins et al. 1979; Robertson et al. 1979).
E X P E R I M E N T A L
Subjects
A total of twenty-four healthy, free-living female subjects (22-29 years) took part in a series
of balance experiments organized in two distinct studies. Informed written consent was obtained from all volunteers. The studies were approved by the Ethical Committee of the Medical Faculty of the University of Kiel.
Study design
All food consumed during the experiments was prepared in the institute kitchen and was weighed to the nearest gram. Extra food and energy-containing beverages were not permitted. The subjects had lunch together in the institute; foods for all other meals were prepacked for home consumption.
First study. The study comprised four experimental periods of 21 d each. The periods
were separated from each other by at least 3 weeks to ensure that one dietary period had '
no residual effect on the next. During all periods the subjects consumed the same strictly controlled basal diet. This diet was supplemented either with a sugar jelly (low-fibre control diet), raw frozen, blanched frozen or canned carrots. The twelve subjects who took part in
this study consumed each of the four diets in a randomized Latin square design.
Second study. Twelve subjects participated in the second study. The study comprised two
experimental periods of 36 d each; the periods were separated from each other by 3 weeks.
During the first 15 d of each period, all subjects consumed a low-fibre basal diet
supplemented with a sugar jelly (low-fibre control diet). During the following 21 d the jelly
was replaced by either raw or raw frozen carrots, subjects being assigned to these two treatments in a randomized crossover fashion.
Diets
The subjects had a controlled food intake that maintained their body weight in a range of
k
1 kg of their starting weight. Each subject's normal energy intake was calculated from a7 d diet record by use of a food table (Deutsche Forschungsanstalt fiir Lebensmittelchemie,
available at https:/www.cambridge.org/core/terms. https://doi.org/10.1079/BJN19940061
F I B R E I N R A W A N D P R O C E S S E D C A R R O T S 58 1
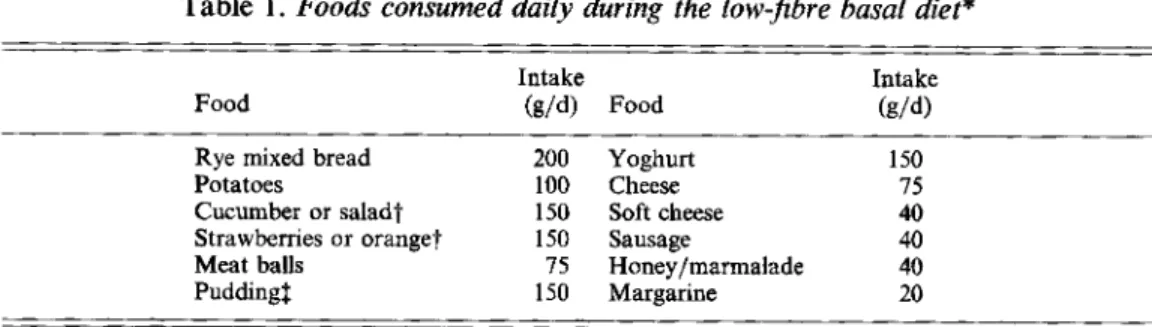
Table 1. Foods consumed daily during the low-fibre basal diet*
Intake Intake
Food (gld) Food (gld)
Rye mixed bread 200 Yoghurt 150
Potatoes 100 Cheese 75
Cucumber or salad? 150 Soft cheese 40
Strawberries or orange? 150 Sausage 40
Meat balls 75 Honey/marmalade 40
Pudding$ 150 Margarine 20
* Each subject consumed the same amount of these foods daily during each experimental period of the studies. Additional amounts of pudding, soft cheese, sausage, margarine and honey were eaten to adjust food intake to
individual energy requirement.
t
Foods were consumed in rotation.1 Pudding was prepared from milk, sugar, starch, eggs and vanilla.
1986). The low-fibre basal diet consisted of two 1 d menus of similar composition, which
were fed in rotation throughout both studies. All subjects consumed the same amount of fibre-containing foods, whereas fibre-free foods corresponded to individual energy requirements. The foods consumed during the basal diet are given in Table 1.
Carrots
Carrots (Daucus carota sp. sativus) harvested in 1988 and in 1990 were used in the studies. During the first study, raw carrots (harvested in 1988) from the same batch were washed,
steam-peeled, trimmed, cut into pieces (10 x 10 x 10 mm) and rinsed. The prepared
vegetables were either frozen and packaged (raw frozen carrots), or water blanched at 98-100" for 2 min, cooled after blanching at 10" for 2 min, frozen and packaged (blanched
frozen carrots), or canned at 120" for 20 min (canned carrots). Carrots were prepared in an
amount sufficient for the consumption during all study periods. Thus it was ensured that
each type of carrots had a constant composition throughout the study.
During the second study, raw and raw frozen carrots were obtained from one batch of carrots harvested in 1990. Raw frozen carrots were prepared as described above. Raw carrots were stored at 2" until they were consumed. They were prepared by washing, peeling by hand and coarse scraping.
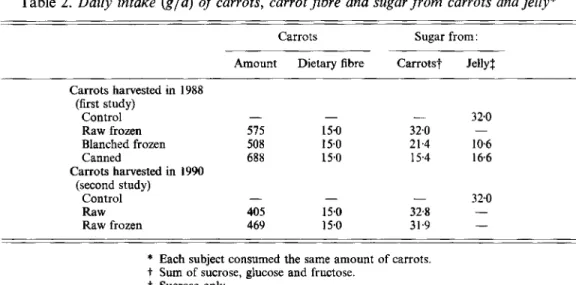
Daily intakes of raw and processed carrots were calculated to provide 15 g total dietary
fibre, as analysed by the method of Prosky et al. (1985). Table 2 shows the intake of carrots,
of total dietary fibre and sugar derived from carrots and the intake of sugar from jelly. Table 3 gives the intake of energy and nutrients during the experimental periods.
Blood collection
During the first study, at days 2 and 21, in ten subjects venous blood samples were obtained from a superficial arm vein by venepuncture after 12 h fasting. During the second study,
blood was drawn in eleven subjects at days 2, 15 and 36.
Balance technique
In the first study, balances were performed during the last week of each experimental period. During the second study, balances were performed from days 9 to 15 (low-fibre
582 E. W I S K E R A N D O T H E R S
Table 2. Daily intake (gld) of carrots, carrot jibre and sugar from carrots and jelly*
Carrots Sugar from:
Amount Dietary fibre Carrots? Jelly$
Carrots harvested in 1988 (first study) - 32.0 Control Raw frozen 575 15.0 32.0 Blanched frozen 508 15.0 21.4 10.6 Canned 688 15.0 15.4 166 - - - Carrots harvested in 1990 (second study) - 320 Control - - Raw 405 15.0 32.8 - Raw frozen 469 15.0 31.9 -
* Each subject consumed the same amount of carrots.
t
Sum of sucrose, glucose and fructose.3 Sucrose only.
consumed were weighed, homogenized, and frozen at - 25" until freeze-dried. Faeces were
collected quantitatively and frozen at -25'. Acid brilliant green (E 142, provided by
H. Schulz, Dragoco, Holzminden, Germany) was given as a faecal marker at the beginning
and the end of each collection period. After each balance period faeces were thawed, pooled together, and homogenized before freeze-drying a portion. Faeces collected during the low- fibre control diets (days 9 to 15) in the two experimental periods of the second study were pooled together and one sample for each subject was freeze-dried.
Analytical methods
Freeze-dried samples of food and faeces were milled through a 0.5 mm mesh screen. Total dietary fibre in the diet was determined gravimetrically by the method of Prosky et al. (1985) using the buffers as described by Prosky et al. (1988). Insoluble dietary fibre was measured according to Prosky et al. (1988). Neutral non-starch polysaccharides (NSP) in foods and faeces were determined by GLC as alditol acetates by the method C of Theander
& Westerlund (1986) using I-methylimidazole as a catalyst for the derivatization of NSP
monomers. Corrections for hydrolytic losses and detector response were made by performing the analyses with known sugar standards. Uronic acids were measured in the
acidic hydrolysate according to the method of Englyst & Cummings (1984). Total NSP was
calculated as the sum of neutral sugars and uronic acids and expressed as polysaccharides
(weight of monomers x 0.9). N was analysed by a microKjeldah1 method; protein was
calculated as N x 6 2 5 . Crude fat was determined after acid hydrolysis by extraction with
petroleum ether (40-60'). Ash was determined in a muffle furnace at 550'. Dry matter of
diets and faeces was obtained by drying the freeze-dried samples to constant weight at 105" (Arbeitsgemeinschaft Getreideforschung, 1978). Starch was measured as described by Bach Knudsen et al. (1987). Sugars were analysed after water extraction using enzyme test kits (Boehringer Mannheim GmbH, Mannheim, Germany). Serum total cholesterol was
determined enzymically by the CHOD-Iodide method (Merckotest 14350 ; Merck,
Darmstadt, Germany). High-density-lipoprotein (HDL)-cholesterol was measured by
precipitating all other cholesterol fractions with heparin and Mg (Fallungsreagenz 15007 ;
Merck) (Eckel et al. 1977) leaving a supernatant that was assayed for cholesterol by use of
available at https:/www.cambridge.org/core/terms. https://doi.org/10.1079/BJN19940061
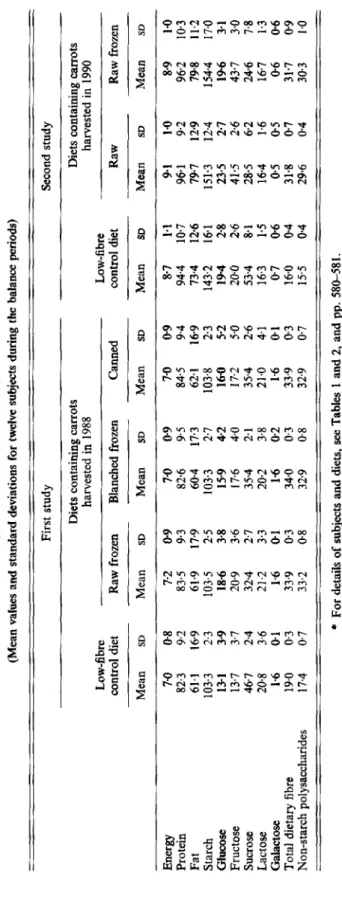
Table 3. Intake of energy (MJ/d) and nutrients (g/d) by young women during two studies of the physiological eflects of raw and processed carrot consump tion
*
(Mean values and standard deviations for twelve subjects during the balance periods) First study Second study Diets containing carrots harvested in 1988 Low-fibre Low-fibre Diets containing carrots harvested in 1990 control diet Raw frozen Blanched frozen Canned control diet Raw Raw frozen Mean SD Mean SD Mean SD Mean SD Mean SD Mean SD Mean SDEnergy Protein Fat Starch Glucose Fructose Sucrose Lactose Galactose Total
dietary fibre Non-starch polysaccharides 7.0 0-8 7-2 0.9 7.0 0-9 7.0 09 87 82.3 9.2 83.5 9.3 82.6 95 84.5 9.4 94.4 61.1 16.9 61.9 17-9 60-4 17.3 62.1 169 734 103.3 2.3 103.5 2.5 103.3 2.7 103% 2.3 143.2 13-1 3-9 18-6 3.8 15-9 4-2 160 5-2 194 13.7 3.7 20.9 3.6 17.6 4.0 17.2 5.0 20.0 46.7 2.4 32-4 2.7 354 2-1 354 26 53.4 204 3.6 21.2 3.3 20.2 3.8 21.0 4.1 16.3 1.6 0.1 1-6 0.1 1.6 0.2 1.6 01 07 19.0 0.3 33.9 0.3 34.0 0.3 33.9 0.3 16.0 17.4 0.7 33.2 0.8 32.9 0.8 32.9 0.7 15.5
*
For details of subjects and diets, see Tables 1 and 2, and pp. 580-581. 1.1 10.7 12.6 16-1 2-8 2.6 8- 1 1.5 0.6 04 0.4-
-
9.1 1.0 96.1 9.2 79.7 12.9 151.3 12.4 23.5 2-7 41.5 2.6 28.5 6.2 16.4 1.6 0.5 0.5 31.8 0.7 29-6 04 8-9 1.0 962 103 794 11.2 154.4 17.0 196 31 43.7 3.0 24.6 78 16.7 1.3 0.6 06 31.7 09 30.3 1.02
w https:/www.cambridge.org/core. University of Basel Library
, on
10 Jul 2017 at 15:59:15
, subject to the Cambridge Core terms of use, available at
https:/www.cambridge.org/core/terms
5
84
E. W I S K E R A N D O T H E R Sa test kit (Merckotest 14350). Accuracy of total cholesterol and HDL-cholesterol determinations were ensured through measurement of a standard serum (Kontrollogen LP; Behringwerke, Marburg, Germany). Faecal bile acids were measured by GLC after extraction from powdered dry faeces, saponification, separation from neutral steroids and derivatization as described by Schweizer et al. (1983).
Calculations
Soluble fibre was calculated as the difference between total and insoluble fibre. Fermentability of NSP constituents of the diets was calculated as the difference between
dietary intake and faecal excretion, expressed as a percentage
of
intake.During the second study, intake, faecal excretion and fermentation of NSP derived from carrots were also calculated. Intake and faecal excretion of carrot NSP were calculated as the difference between carrot-containing diets and the corresponding low-fibre control diets. Fermentation of carrot NSP was calculated as the difference between estimated dietary intake and faecal excretion, expressed as a percentage of intake. Faecal output due to carrots during the second study was calculated as the difference between carrot- containing diets and the corresponding low-fibre control diets.
Statistical analysis
The effects of processing on the composition of the carrots consumed during the first and second studies respectively, and the effects of the harvest year on the composition of raw frozen carrots were analysed by one-way analysis of variance. Linear contrasts were used to compare treatment means.
The results of the studies were treated statistically by analysis of variance in which
subject, period and diet effects were evaluated. Results obtained with diets containing raw frozen carrots harvested in 1988 and in 1990 were compared by one-way analysis of
variance in which the effect of the harvest year was determined. Where significant
differences between diets were established, differences were tested by linear contrasts. Linear contrasts were established by Student’s t-test with comparison-wise error rates (General linear models procedure (GLM), SAS Institute, Heidelberg, Germany). All tests
were considered significant at the 5 % level
(P
<
0.05).R E S U L T S
Composition of carrots
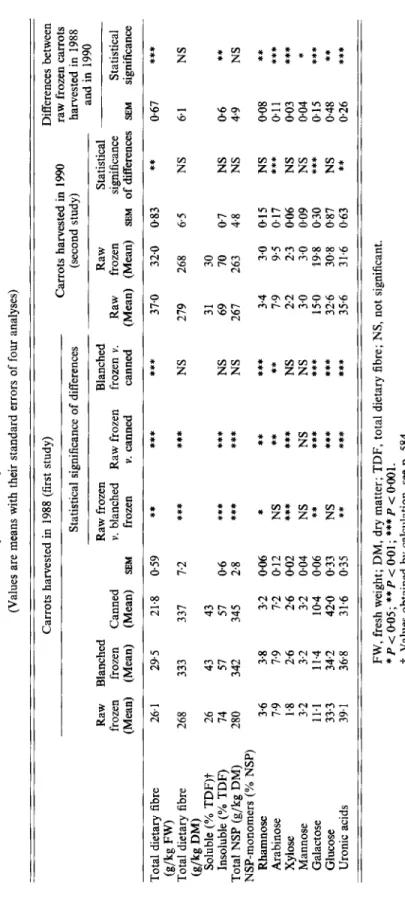
The total dietary fibre and NSP content of the carrots, the percentage of soluble and
insoluble fibre and the NSP monomers are given in Table
4.
Heat treatment, i.e. blanching and canning, increased the fibre content in carrot dry matter compared with raw frozen carrots due to losses in non-fibre material, mainly sugars. On a fresh weight basis the fibre values were higher in blanched and lower in canned than in raw frozen carrots. Blanching and canning also increased the percentage of soluble fibre compared with the raw frozen carrots. The raw frozen carrots from the 1990 harvest contained more dietary fibre than those harvested in 1988, calculated on a fresh weight basis, whereas the values in the dry materials were the same. Freezing reduced the dietary fibre content compared with the raw carrots when the values were calculated on a fresh weight basis, but in the dry material there was no difference. The percentage of soluble fibre was the same for both raw and raw frozen carrots and was higher compared with the value of the raw frozen carrots from the 1988 harvest. The main dietary fibre constituents in
available at https:/www.cambridge.org/core/terms. https://doi.org/10.1079/BJN19940061
Table 4. Content of total dietary Jibre and non-starch polysaccharides (NSP)
in
carrots, and percentage of soluble and insoluble dietary jibre and of NSP monomers (Values are means with their standard errors of four analyses) Carrots harvested in 1988 (first study) Differences between raw frozen carrots Statistical significance of differences (second study) harvested in 1988 and in 1990 Carrots harvested in 1990 Raw Blanched Raw frozen Blanched Raw Statistical frozen frozen Canned v. blanched Raw frozen frozen v. Raw frozen significance Statistical (Mean) (Mean) (Mean) SEM frozen v. canned canned (Mean) (Mean) SEM of differences SEM significance *** 0.67**
***
*** 370 32.0 0.83 ** Total dietary fibre 26.1 29.5 21.8 0.59 Total dietary fibre 268 333 337 7.2***
*** NS 279 268 6.5 NS 6.1 NS (g/kg FW) (g/kg DM) Soluble (% TDF)? 26 43 43 31 30 Insoluble (x TDF) 14 51 51 06 *** *** NS 69 I0 0.7 NS 0.6 ** Total NSP (g/kg DM) 280 342 345 2.8***
***
NS 267 263 4.8 NS 4.9 NS NSP-monomers (YO NSP) ***
***
3.4 3.0 0.15 NS 008 ****
** 7.9 9.5 0.17 *** 011 *** 2.6 0-02***
***
NS 2.2 2-3 0.06 NS 003 *** Rhamnose 3.6 3.8 3.2 0.06 Arabinose 7.9 7.9 7.2 012 NS Xylose 1.8 2.6 Mannose 3.2 3.2 3.2 0.04 NS NS NS 3.0 3.0 0.09 NS 0.04 * Galactose Glucose 33.3 34-2 42.0 0.33 NS ******
32.6 30.8 0.87 NS 048 ** Uronic acids 39.1 368 314 0.35 *** ******
150 99.8 0.30 *** 015 0.26 11.1 11.4 10.4 0.06 ** *****
35.6 316 063**
***
***
FW, fresh weight; DM, dry matter; TDF, total dietary fibre; NS, not significant. *P<005; **P<O-01; ***P<OOOl.t
Values obtained by calculation, see p. 584. I m P 9z
tr w P 0 0 m (A in m U n 9 P P 02
z C 4 N https:/www.cambridge.org/core. University of Basel Library
, on
10 Jul 2017 at 15:59:15
, subject to the Cambridge Core terms of use, available at
https:/www.cambridge.org/core/terms
586 E. W I S K E R A N D O T H E R S
carrots were uronic acids and glucose, followed by galactose and arabinose. In comparison to the raw frozen carrots, blanching had no effect on the percentage of glucose, but decreased uronic acids, whereas canning caused a decrease in uronic acids and an increase in glucose. Compared with the raw carrots, freezing increased arabinose and galactose and decreased uronic acids.
Effect of carrots on faecal excretion
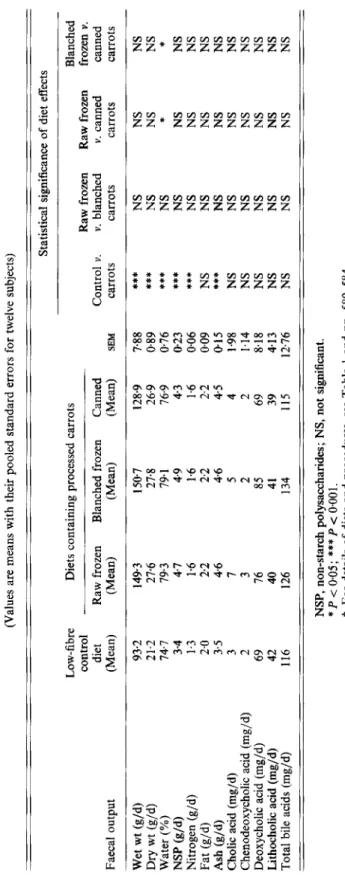
The effect of the consumption of carrots harvested in 1988 on important faecal variables
is shown in Table 5. The consumption of carrots caused an increase in faecal wet and dry weight compared with the values on the control diets. For each gram of additional fibre,
wet weight increased between 2.4 and 3.7 g, mean dry weight by 0 4 g. The fibre from the
various carrots led also to significantly elevated losses of water, NSP, N and ash, whereas fat excretion was not affected. An influence of processing of carrots could only be observed in the case of stool water which was higher during the consumption of raw frozen and blanched frozen carrots compared with canned carrots. The mean daily faecal bile acid excretion and the high extent of conversion of primary to secondary bile acids were similar in all periods of the first study.
The results of the second study (carrots harvested in 1990) are shown in Table 6 . Faecal output increased due to carrot consumption, but no differences in the effects of raw and raw frozen carrots could be observed.
Fermentation of carrot N S P
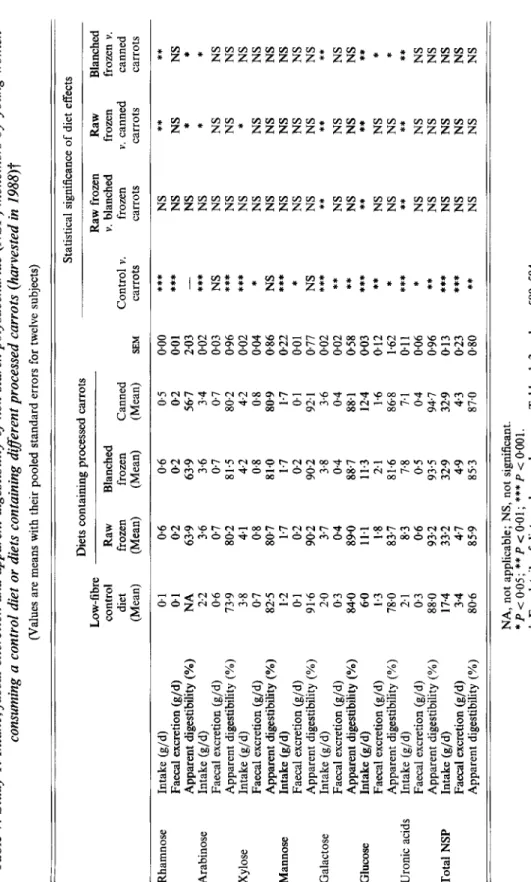
Table 7 shows the intake, faecal excretion and fermentation of NSP monomers during the
first study. Although the diets containing raw frozen, blanched or canned carrots from the
1988 harvest provided higher amounts of NSP monomers than the control diet there was
no, or only a small, increase in faecal excretion of the monosaccharides, even when the differences from the control diet were significant. The additional fibre constituents were extensively degraded, leading to higher values for the fermentation of NSP monomers during the carrot-containing diets than during the control diet. Compared with the control, total NSP intake increased by 15.8, 15.5 and 15.5 g/d when the raw frozen, blanched, and canned carrots respectively, were consumed. The corresponding NSP losses increased on
average by 1.3, 1.4 and 0.9 g/d respectively. From these values it was estimated that a mean
of 92, 91 and 94% of fibre in the raw frozen, blanched, and canned carrots from the 1988
harvest respectively, was broken down. No significant effect of processing of carrots on the
fermentation of NSP could be observed.
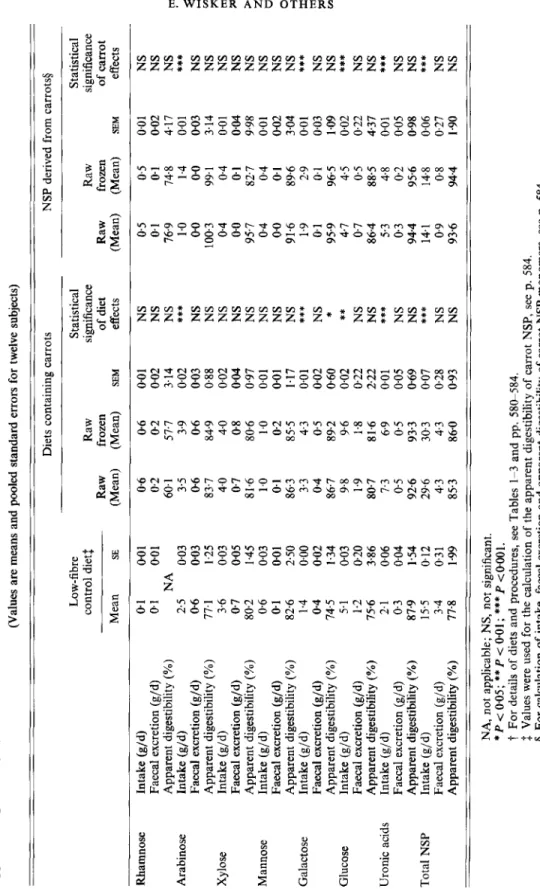
Table 8 gives the intake, faecal excretion and fermentation of NSP during the second study. There were no differences in faecal losses and digestibilities of NSP monomers between the two carrot-containing diets with the exception of galactose fermentation. The
additional fibre constituents provided by raw or raw frozen carrots from the 1990 harvest
were extensively fermented, independent of whether the fibre originated from raw or raw frozen carrots. The most resistant NSP constituents were glucose-containing polymers.
Table 9 shows a comparison of the effects of the diets containing raw frozen carrots from
the two harvest years. There were few differences between the effects of the two diets. EfSects on serum cholesterol
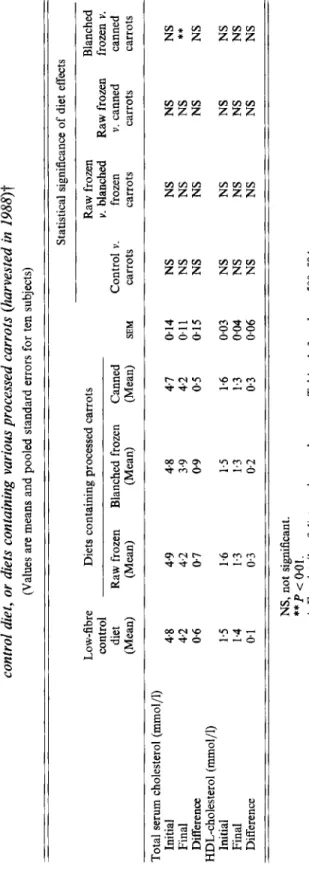
Table 10 gives the concentrations of serum total cholesterol and of HDL-cholesterol during
the first study. Both serum total cholesterol and HDL-cholesterol decreased within each experimental period, independent of the diet. However, there were no differences in the
available at https:/www.cambridge.org/core/terms. https://doi.org/10.1079/BJN19940061
Table 5. Study 1. Eflects of diets containing diFerent processed carrots (harvested in 1988) on faecal output in young women? (Values are means with their pooled standard errors for twelve subjects) Statistical significance of diet effects Faecal output Low-fibre Diets containing processed carrots Blanched control Raw frozen Raw frozen frozen v. diet Raw frozen Blanched frozen Canned Control v. v. blanched v. canned canned (Mean) (Mean) (Mean) (Mean) SEM carrots carrots carrots carrots Wet wt (g/d) 93-2 149.3 150.7 128.9 788
***
NS NS NS 21.2 27.6 274 26.9 0.89***
NS NS NS NS Water (%) 74.7 79,3 79.1 76.9 0.76 * * NS NS NS 3.4 4.7 4.9 43 023 *** Nitrogen (g/d) 1.3 1.6 1.6 1.6 006***
NS NS NS 2.0 2.2 2.2 2.2 0.09 NS NS NS NS Ash (g/4 3.5 4.6 4.6 45 015***
NS NS NS Cholic acid (mg/d) 3 7 5 4 1.98 NS NS NS NS Chenodeoxycholic acid (mg/d) 2 3 2 2 1.14 NS NS NS NS Deoxycholic acid (mg/d) 69 76 85 69 8.18 NS NS NS NS Lithocholic acid (mg/d) 42 40 41 39 413 NS NS NS NS Total bile acids (mg/d) 116 126 134 115 12.76 NS NS NS NS***
Dry wt (g/d) NSP Wd) Fat (g/d) NSP, non-starch polysaccharides; NS, not significant. *P<0.05; ***P<O.OOl.t
For details of diets and procedures, see Table 1 and pp. 580-584. I m 0 m-
z 02
> z U N P N https:/www.cambridge.org/core. University of Basel Library
, on
10 Jul 2017 at 15:59:15
, subject to the Cambridge Core terms of use, available at
https:/www.cambridge.org/core/terms
vl W W Table 6. Study 2. Effect of diets containing raw and raw frozen carrots (harvested in 1990) on faecal output in young women? (Values are means with their pooled standard errors for twelve subjects) Diets containing carrots Increase in faecal output due to carrots5 Low-fibre Statistical Statistical control dieti significance significance Raw Raw frozen of diet Raw Raw frozen of carrot Faecal output Mean SE (Mean) (Mean) SEM effects (Mean) (Mean) SEM effects 83.7 9.56 132.6 1244 9.71 NS 49.9 40.7 22.5 1.34 28.0 29.4 1.48 NS 5.5 6.9 71.0 1.89 765 73.6 1.38 NS 5.5 2.6 3.4 0.31 4.3 4.3 0.28 NS 0.9 0.8 1.3 0.09 1.6 1.7 0.09 NS 0.3 0.4 2.7 0.17 3.1 3.4 0.22 NS 04 0.7 40 0.21 5.1 5.5 0.32 NS 1.1 1.4 NSP, non-starch polysaccharides ; NS, not significant.
t
For details of diets and procedures see Tables 1-3 and pp. 58C-584. 3 Values were used for the calculation of the effects of carrots. 0 For the calculation of faecal output due to the intake of carrots see p. 584 9.71 1.48 1.38 0.27 009 023 0.3 1 NS NS NS NS NS NS NS https://doi.org/10.1079/BJN19940061 Downloaded from https:/www.cambridge.org/core. University of Basel Library
, on
10 Jul 2017 at 15:59:15
, subject to the Cambridge Core terms of use, available at
https:/www.cambridge.org/core/terms
Table 7. Study 1. Intake, faecal excretion and apparent digestibility of non-starch polysaccharide (NSP) monomers by young women consuming a control diet or diets containing direrent processed carrots (harvested in 1988)t (Values are means with their pooled standard errors for twelve subjects) Statistical significance of diet effects Diets containing processed carrots Low - fi b r e Raw frozen Raw Blanched control Raw Blanched v. blanched frozen frozen v. diet frozen frozen Canned Control v. frozen v. canned canned (Mean) (Mean) (Mean) (Mean) SEM carrots carrots carrots carrots
Rhamnose Arabinose Xylose Mannose Galactose Glucose Uronic
acids Total NSP Intake (g/d) Faecal excretion (g/d) Apparent digestibility (%) Intake (g/d) Faecal excretion (g/d) Apparent digestibility (YO) Intake (g/d) Faecal excretion (g/d) Apparent digestibility (%) Intake (g/d) Faecal excretion (g/d) Apparent digestibility (YO) Intake (g/d) Faecal excretion (g/d) Apparent digestibility (%) Intake (g/d) Faecal excretion (g/d) Apparent digestibility (Y) Intake (g/d) Faecal excretion (g/d) Apparent digestibility (YO) Intake (g/d) Faecal excretion (g/d) Apparent digestibility (%) 0.1 0.1 NA 2.2 06 73.9 3.8 0.7 825 1.2 01 91.6 2.0 0.3 84.0 6.0 1.3 78.0 2.1 0.3 88.0 17.4 3.4 80.6 0.6 0.2 63.9 3.6 0.7 80.2 4.1 08 80.7 1.7 0.2 902 3.7 0.4 89.0 11.1 1.8 83-7 8.3 0.6 93.2 33.2 4.7 85.9 0.6 0.2 63.9 3.6 07 8 1.5 4.2 0.8 81-0 1.7 0.2 90.2 3.8 0.4 88.7 11.3 2.1 81.6 7.8 0.5 93.5 32.9 4-9 85.3 0.5 0.2 56.7 3.4 0.7 80.2 4.2 0.8 80.9 1.7 0.1 92.1 3.6 0.4 88.1 12.4 1.6 86.8 7.1 04 94.7 32.9 4.3 87.0
*** ***
0.00 0.01 2.03 002 0.03 NS 096 0.02 0.04 * 0.86 NS 022 *** 0.0 1*
077 NS 0.02 0.02 0.58 003 0.12 1.62 * 0.1 1 0.06 * 0.96 0.13 0.23 0.80 -***
******
***
****
*****
*****
****** **
NS NS NS NS NS NS NS NS NS NS NS NS ** NS NS ** NS NS ** NS NS NS NS NS ** NS*
* NS NS*
NS NS NS NS NS ** NS NS ** NS NS**
NS NS NS NS NS ** NS * * NS NS NS NS NS NS NS NS ** NS NS ** * ***
NS NS NS NS NS NA, not applicable; NS, not significant. * P < 0.05; ** P < 0.01; ***P < 0.001.t
For details of diets and procedures, see Tables 1-3 and pp. 580-584. https:/www.cambridge.org/core. University of Basel Library
, on
10 Jul 2017 at 15:59:15
, subject to the Cambridge Core terms of use, available at
https:/www.cambridge.org/core/terms
Table 8. Study 2. Intake, faecal excretion and apparent digestibility of non-starch polysaccharide (NSP) monomers by young women consuming a control diet, or diets containing raw or raw frozen carrots (harvested in 1990), together with intake, faecal excretion and apparent digestibility of carrot NSPt (Values are means and pooled standard errors for twelve subjects)
-
Diets containing carrots NSP derived from carrots5 Low-fibre Statistical Statistical control dietf Raw significance Raw significance Raw frozen of diet Raw frozen of carrot Mean SE (Mean) (Mean) SEM effects (Mean) (Mean) SEM effectsRhamnose Arabinose Xylose Mannose Galactose Glucose Uronic
acids Total NSP Intake (g/d) Faecal excretion (g/d) Apparent digestibility (YO) Intake (g/d) Faecal excretion (g/d) Apparent digestibility (%) Intake (g/d) Faecal excretion (g/d) Apparent digestibility (YO) Intake (g/d) Faecal excretion (g/d) Apparent digestibility (YO) Intake (g/d) Faecal excretion (g/d) Apparent digestibility (YO) Intake (g/d) Faecal excretion (g/d) Apparent digestibility (%) Intake (g/d) Faecal excretion (gjd) Apparent digestibility ("LO) Intake (g/d) Faecal excretion (g/d) Apparent digestibility ("L) 0.1 0.01 01 0.01 NA 2.5 0.03 0-6 003 77.1 1.25 3.6 0.03 0.7 0.05 802 1.45 0.6 0.03 0.1 0.01 82.6 2.50 1.4 0.00 0-4 002 74.5 1.34 5.1 0.03 1.2 0.20 75.6 3.86 2.1 006 0.3 0.04 87.9 1.54 15.5 0.12 3.4 0.31 77-8 1.99 0.6 0.2 60.1 3.5 0.6 83.7 4.0 0.7 81.6 1 .O 0.1 86.3 3.3 0.4 86.7 9.8 1.9 80-7 1.3 0.5 926 29.6 4.3 85.3 06 0.2 57.7 3.9 06 84.9 4.0 0-8 80.6 1
.o
02 85.5 43 0.5 89.2 9.6 1.8 81-6 6.9 0.5 93.3 30.3 4.3 86.0 0.0 1 002 3.14 0.02 0.03 088 002 0.04 0.97 0.0 1 0.0 1 1.17 0.0 1 0.02 0.60 0.02 022 2.22 0.0 1 0.05 069 0.07 0.28 0-93 NS NS NS***
NS NS NS NS NS NS NS NS *** NS ***
NS NS *** NS NS *** NS NS 0.5 0.1 76.9 1 .O 00 100.3 0.4 0.0 95.7 0.4 0.0 91.6 1.9 01 959 4.7 0.7 86.4 5.3 0.3 944 14.1 0.9 93.6 0.5 01 74.8 1.4 0.0 99.1 0.4 01 827 0.4 0.1 896 2.9 0.1 965 4.5 0.5 88.5 4.8 0.2 95.6 14.8 0.8 94.4 0.01 NS 0.02 NS 4.17 NS 0.01***
003 NS 3.14 NS 0.0 1 NS 0.04 NS 9.98 NS 0.0 1 NS 002 NS 3.04 NS 001***
0.03 NS 1.09 NS 0.02 0.22 NS 4.37 NS 0.0 1***
005 NS 0.98 NS 0.06***
0.27 NS 1.90 NS***
NA, not applicable; NS, not significant. *P < 005; **P < 001; ***P <0001.t
For details of diets and procedures, see Tables 1-3 and pp. 58&584. f: Values were used for the calculation of the apparent digestibility of carrot NSP, see p. 584. 5 For calculation of intake, faecal excretion and apparent digestibility of carrot NSP monomers, see. p. 584. https://doi.org/10.1079/BJN19940061 Downloaded from https:/www.cambridge.org/core. University of Basel Library
, on
10 Jul 2017 at 15:59:15
, subject to the Cambridge Core terms of use, available at
https:/www.cambridge.org/core/terms
Table 9. Comparison of the eflects of diets containing raw frozen carrots harvested in 198% and in 1990 on faecal output and on apparent digestibility of non-starch polysaccharide (NSP) monomers by young women? (Values are standard errors for twelve subjects)$ Statistical Statistical Statistical significance significance significance Faecal excretion SEM of differences Faecal excretion SEM of differences Apparent digestibility SEM of differences Fresh wt Dry wt
Water Nitrogen Fat Ash ~
19.19 1.51 1.82 0.10 0.23 0.29 ~
NS NS * NS * * Rhamnose Arabinose Xylose Mannose Galactose Glucose Uronic
acids Total NSP 002 0.03 0.04 0.02 003 0.29 0.08 0.4 1 NS NS *** NS NS NS NS NS
Rhamnose Arabinose Xylose Mannose. Galactose Glucose Uronic
acids Total NSP 3.65 0.75 0.90 167 0.68 2.70 1.04 1.29 NS
***
NS NS NS NS NS NS NS, not significant. *P<O.O5; **P<O.Ol; ***P<O.OOl.t
For details of diets and procedures, see Tables 1-3, and pp. 58C584. # For mean values, see Tables 5-8. https:/www.cambridge.org/core. University of Basel Library
, on
10 Jul 2017 at 15:59:15
, subject to the Cambridge Core terms of use, available at
https:/www.cambridge.org/core/terms
Table 10. Study 1. Total serum cholesterol and high-density-lipoprotein (HDL)-cholesterol concentrations of young women consuming a control diet, or diets containing various processed carrots (harvested in 1988)t (Values are means and pooled standard errors for ten subjects) Statistical significance of diet effects m Low-fibre Diets containing processed carrots Raw frozen Blanched
e
control Y. blanched Raw frozen frozen Y. I v,E
diet Raw frozen Blanched frozen Canned Control v. frozen v. canned canned (Mean) (Mean) (Mean) (Mean) EM carrots carrots carrots carrots %*
z 0 Final 4.2 4.2 3.9 4.2 011 NS NS NS Difference 0.6 0.7 0.9 0.5 015 NS NS NS NS 4 Initial 1.5 1.6 1.5 1.6 0.03 NS NS NS NS Final 1.4 1.3 1.3 1.3 0.04 NS NS NS NS Difference 01 0.3 0.2 0.3 0.06 NS NS NS NS Total serum cholesterol (mmol/l) Initial 4.8 4.9 4.8 4.7 014 NS NS NS NS t7 ** HDL-cholesterol (mmol/l)E E
NS, not significant.**
P < 0.01. f For details of diets and procedures, see Tables 1-3 and pp. 580-584. https://doi.org/10.1079/BJN19940061 Downloaded from https:/www.cambridge.org/core. University of Basel Library
, on
10 Jul 2017 at 15:59:15
, subject to the Cambridge Core terms of use, available at
https:/www.cambridge.org/core/terms
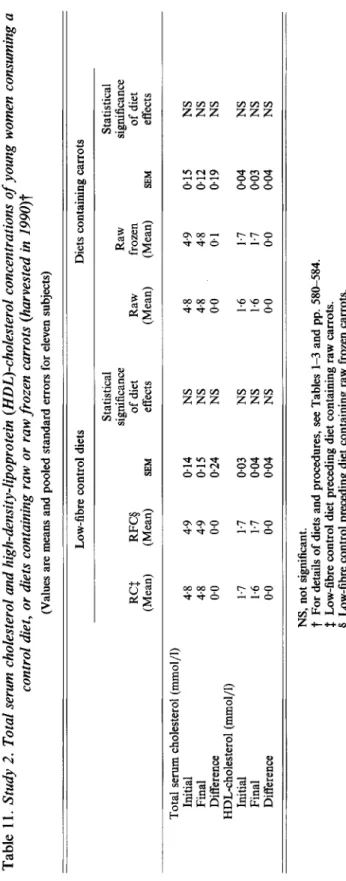
Table 1 1. Study 2. Total serum cholesterol and high-density-lipoprotein (HDL)-cholesterol concentrations of young women consuming a control diet, or diets containing raw or raw frozen carrots (harvested in 1990)t (Values are means and pooled standard errors for eleven subjects) Low-fibre control diets Diets containing carrots Statistical Statistical significance Raw significance RCS RFCg of diet Raw frozen of diet (Mean) (Mean) SEM effects (Mean) (Mean) SEM effects Total serum cholesterol (mmol/l) Initial 4.8 4.9 0.14 NS 4.8 4.9 0.15 NS Final 4.8 4.9 015 NS 4.8 4.8 0.12 NS Difference 00 0.0 0.24 NS 0.0 01 019 NS Initial 1.7 1.7 0.03 NS 1.6 1.7 0.04 NS Final 1.6 1.7 0.04 NS 1.6 1.7 0.03 NS Difference 00 00 004 NS 00 00 0.04 NS HDL-cholesterol (mmol/l) NS, not significant.
t
For details of diets and procedures, see Tables 1-3 and pp. 586584. # Low-fibre control diet preceding diet containing raw carrots. Q Low-fibre control preceding diet containing raw frozen carrots. m 0 1 cn cn W w https:/www.cambridge.org/core. University of Basel Library
, on
10 Jul 2017 at 15:59:15
, subject to the Cambridge Core terms of use, available at
https:/www.cambridge.org/core/terms
594 E. W I S K E R A N D O T H E R S
decreases between the different experimental diets. Table 11 shows the cholesterol values measured during the second study. There were no changes in serum total cholesterol and in HDL-cholesterol during the low-fibre control diets or during the carrot-containing diets.
D I S C U S S I O N
In this work we investigated whether or not processing of carrots had an influence on various fibre-mediated physiological effects of carrots. For practical reasons (length and number of study periods, keeping quality of raw carrots) the raw carrots in the first study were frozen. The second study was conducted mainly in order to see whether such raw frozen carrots would indeed closely match raw carrots in their physiological effects. We also hoped to reveal any differences in raw frozen carrots which could be attributed to different harvest years.
Dietary fibre content in carrots
and
structure of cell wallsBecause processing changed the total dietary fibre content in carrots, different amounts of carrots had to be consumed to achieve equal intakes of fibre. Similarly, as shown in other
studies (Anderson & Clydesdale, 1980; Nyman et al. 19876; Lintas & Cappeloni, 1988),
heat treatment affected the chemical composition and the physical structure of the carrot fibre. Both blanching and canning increased the percentage of soluble fibre, probably due to cleavage of glycosidic linkages in polysaccharide chains producing smaller compounds. Freezing had no effect in this respect. These findings corroborate the microscopic examination of the carrot cell walls ( C . Schlienger, personal communication). The cell walls of the raw carrots were dense with a very clear middle lamella and cellulose microfibrils
adhered to each other. Only very few lesions could be seen. The structure of the raw frozen
carrots was similar to that of the raw carrots with some more lesions but no definite breaks
in the cell walls. Blanching caused the carrot cell wall to swell. Probably due to the
solubilization of pectin, walls split at the level of the middle lamella and intercellular spaces.
A dissociation of the walls could be observed, but they did not break up completely. The
canned carrots suffered the most important cell lesions. Not only the pectin but also the hemicellulose bridges had been denaturated. The cellulose microfibril group dissociated and swelled. Due to the swelling of the matrix the tissues lost their rigidity. Thus, the canned carrots were much softer compared with blanched and frozen carrots, and especially with raw carrots which were very hard.
EfSect of processing of carrot jibre
on
fermentation and faecal outputSeveral physiological effects of dietary fibre are related to its degradation in the large intestine. The fermentative breakdown of dietary fibre polysaccharides may be of importance because of its impact on energy supply not only to the colonic mucosa (Roediger, 1980) but also for the body as a whole (McNeill, 1984). There are also hypotheses that short-chain fatty acids resulting from the fermentation may affect liver metabolism (Chen et al. 1984) and may play a role in the protection against colonic carcinogenesis due to their contribution to lowering colonic pH (Jacobs, 1990). Fibre fermentation was found to be inversely related to its stool bulking capacity (Stephen & Cummings, 1980~).
In our measurements of faecal saccharides we could not distinguish between unfermented dietary saccharides and those potentially derived from bacterial or endogenous origin. It is difficult to study the basal saccharide excretion on a fibre-free diet in humans as can be done in rats (Nyman et al. 1991). However, studies in man and rats provide evidence that
available at https:/www.cambridge.org/core/terms. https://doi.org/10.1079/BJN19940061
FIBRE IN R A W A N D PROCESSED C A R R O T S 595 saccharides of mucins and mucopolysaccharides produced by the host are utilized by the
gut microflora (Salyers & McCarthy, 1989). Animal experiments indicate that the
contribution of bacteria to faecal NSP may be only small (Nyman & Asp, 1985). In an investigation of the carbohydrate content of faecal bacteria of pigs it was found that NSP
accounted for only 4.3 % of bacterial dry matter. Glucose (2.36 %), galactose (0.96 Yo),
rhamnose (0.71 YO) and uronic acids (0.3 %) were the main components (Longland & Low,
1990). In human faeces, up to 55 % of faecal dry matter can consist of bacteria (Stephen
& Cummings, 1980b). If these bacteria contained similar amounts of NSP to those found
in the microflora of pigs (Longland & Low, 1990), in our study they could have contributed
a maximum of 0.3, 0.1, 0.1 and 0.05 g of glucose, galactose, rhamnose, and uronic acids respectively to the daily faecal losses of these saccharides, with only negligble differences between the single experimental periods. Therefore we can safely assume that measurements of apparent digestibility of fibre as performed in this study provide relevant information about true fibre fermentation.
The potential susceptibility of dietary fibre to fermentation by bacterial enzymes seems to be dependent on its solubility. Soluble components are more easily degraded than insoluble ones (Cummings, 1984). Provided that the additional consumption of carrot fibre
had no effect on the digestibility of fibre in the basal diet (Key & Mathers, 1990), carrot-
fibre fermentation may be estimated from differences in the amount of fibre intake and excretion between the carrot-containing diets and the corresponding control diets. According to this calculation, fibres from the different carrots were fermented equally and
rather completely (91-94 YO). The higher proportion of insoluble fibre components in the
raw and raw frozen carrots compared with the blanched and canned carrots, and also the more intact cell walls which could be observed microscopically, did not protect them from extensive degradation. The most resistant saccharides were glucose, representing mainly cellulose, and rhamnose, representing the resistant core regions of the carrot pectins.
When similarly processed carrots as used in our studies were fed to rats, fibre
fermentability differed from one harvest to the other (Nyman et al. 1991). During one year,
blanched carrots were fermented only to 53% compared with raw frozen and cooked
carrots which were degraded to 74 and 84
YO
respectively. However, carrots from anotheryear were fermented to a higher degree (83-91 %) and were unaffected by processing, as was
the case in the present study. In contrast to the studies in rats, no influence of the harvest year on the fermentation of carrot fibre could be observed in our human study involving different harvest years. At such a high fermentation efficiency subtle cell wall differences due to harvest year or processing are indeed not likely to be important. However, when the overall fermentation rates measured in humans are compared with those in rats, it appears that fermentation was slightly more complete in humans.
Faecal bulking capacity of carrot fibre was comparable with the effects of other vegetables (Wisker & Feldheim, 1990) and of finely ground cereal brans (Wisker et al. 1986,
1992), although the carrot fibre was fermented to a higher degree. The increase in stool
weight was due to an elevated output both of dry matter and of water. The percentage of faecal water increased with the raw frozen and blanched carrots from the 1988 harvest and with the raw carrots harvested in 1990. This was probably caused by reduced transit times, because under these conditions there might have been less time for water reabsorption (Cummings, 1986). However, transit times were not measured in this study. The higher excretion of faecal N during the consumption of the different carrots may reflect an increase
in microbial mass due to the fermentation of the carrot fibre (Stephen & Cummings,
1980b).
There were no differences in the faecal bulking effects between various processed carrots of the same harvest and also no differences between carrots from different harvests,
596 E. W I S K E R A N D O T H E R S
although there were changes in the chemical composition and in the solubility characteristics of the carrot fibre. This is consistent with the equal fermentability of all carrots found in this human study. In the study with rats (Nyman et al. 1991) the blanched carrots with the lowest fermentability had a greater effect on faecal wet and dry weight compared with raw frozen and cooked carrots. However, this effect could not be repeated when carrots from a different harvest year were studied. Faecal bulking and fermentability were therefore closely related in both humans and in the rat model.
Serum cholesterol and faecal bile acids
Highly fermentable isolated fibre sources like pectin have been shown to reduce serum cholesterol levels (Stasse-Wolthuis et al. 1980). A few studies have also reported such an effect after consumption of different vegetables (Gormley et al. 1977, 1979) and carrots
(Robertson et al. 1979). The mechanism by which dietary fibre affects the metabolism of
serum lipids is not fully understood. A decreased absorption of bile acids because of
binding to dietary fibre in the intestinal lumen and the inhibition of hepatic cholesterol synthesis by the products of fermentation, the short-chain fatty acids, are discussed as
possible mechanisms (Kritchevsky & Story, 1986).
During the first study the consumption of the experimental diets resulted in a reduction in the concentration of both serum total and HDL-cholesterol. However, because an equal cholesterol lowering could also be observed during the control diet, it could not be attributed to fibre present in the different carrots. Rather the decrease in cholesterol may have been due to differences in the fat content of these subjects’ normal diets and the experimental diets consumed in the study. The experimental diets contained less energy in
the form of fat (32 %) compared with average German diets (42
YO
; Deutsche Gesellschaftfur Ernahrung, 1988). Changes in the amount of dietary fat can affect serum total cholesterol (Stasse-Wolthuis et al. 1979). This interpretation is supported by the results of the second study, when neither the control diet nor the diets containing raw or raw frozen carrots had any effect on serum total and HDL-cholesterol. However, in this second study the low-fibre basal diet, which preceded the carrot-containing diets in order to avoid differences other than carrots between pre-study diets and experimental diets, did not exert any influence on serum cholesterol.
As our subjects were young women, cholesterol values may have been influenced by the menstrual cycle. However, the fluctuations in HDL- and total cholesterol during a normal
menstrual cycle do not apparently show a clear pattern. No changes and a cyclical decrease
in cholesterol values have both been reported (Adlercreutz & Tallqvist, 1959; Demacker et
al. 1982). In users of oral contraceptives a cyclical decrease in HDL- and total cholesterol
was observed (Demacker et al. 1982). Thus, the time of blood sampling during the cycle may be important. During our studies blood samples were taken independently of the menstrual cycle of the subjects. However, it is unlikely that there was a systematic effect of menstrual cycle, because the experimental periods lasted 3 weeks each and were separated
from each other by 3 weeks. A decrease of HDL-cholesterol together with total serum
cholesterol was also reported when beans (Anderson et al. 1990) or various dietary fibre sources (Stasse-Wolthuis et al. 1979; Kesaniemi et al. 1990) were consumed by male subjects (Anderson et al. 1990; Kesaniemi et al. 1990) or by subjects of both sexes (Stasse- Wolthuis et al. 1979).
The decrease in serum cholesterol during the first study was not connected with increases in faecal bile acid excretion. Faecal bile acids were more dilute after carrots than after the control diet, but the interindividual variation was considerable. Compared with other studies (Schweizer et al. 1983) bile acid losses were rather small, probably due to the low
consumption of fat with these diets.
available at https:/www.cambridge.org/core/terms. https://doi.org/10.1079/BJN19940061
F I B R E I N R A W A N D P R O C E S S E D C A R R O T S 597 Isolated pectin has been shown to decrease serum cholesterol in several studies. The smallest amount showing a significant effect was a dose of 9 g pectin/d (Stasse-Wolthuis et
al. 1980). Pectic substances, measured as uronic acids, contribute about one third to carrot
fibre. The carrots consumed in our studies provided daily between 5 and 6 g uronic acids,
an amount which was probably too small for a cholesterol-lowering effect. In addition,
native pectic substances present in cell walls differ from isolated pectin in respect to molecular weight and number of side chains and therefore may exert different physiological effects than isolated pectin.
Thus, our results differ from those of Robertson et al. (1979) who reported a significant
lowering of slightly elevated serum total cholesterol when 200 g raw carrots corresponding to 6 g carrot fibre per day were consumed over 3 weeks in addition to a freely chosen diet. This cholesterol-lowering effect was also accompanied by an increase in faecal bile acid excretion. More in agreement with our findings, the addition of isolated fibres from carrots, cabbage or apples to a controlled diet had no effect on normal serum total cholesterol levels, but the carrot fibre caused a decrease of HDL-cholesterol, which could not be explained (Jenkins et al. 1979).
Conclusions
Our investigations in humans have shown that dietary fibres in carrots are highly fermentable and yet have good stool-bulking ability, comparable to finely milled cereal brans. In spite of appreciable effects of processing, especially of blanching and canning, on the distribution of soluble and insoluble fibre and on texture and microscopic structure of carrots, the physiological effects of these raw or different processed carrots were very
similar.
At first sight this finding appears to differentiate root vegetables from cereal fibre sources for which variable physiological effects have been attributed to processing. However, processing effects with cereals have mostly been studied after mechanical or heat treatments at low moisture contents or could in part be explained by formation of resistant starch. In
addition, cereal fibres are normally less fermented than vegetable fibres (Wisker et al. 1988;
Wisker & Feldheim, 1990) allowing probably a larger effect of processing to be seen than
with highly fermentable fibre sources.
Finally, our combined findings from the two studies make it unlikely that carrots can exert a direct fibre-mediated cholesterol-lowering effect.
We gratefully acknowledge the excellent technical assistance of Elwira Klima, Gudrun Peschutter, Silvia Reimann, Astrid Resenhoeft and Antje Richardsen. The carrots were kindly provided by Nordreco AB, Bjuv, Sweden. We thank Karl-Erik Pilsson for processing and timely delivery of all carrot samples. Gerhard Rave, University of Kiel, is gratefully acknowledged for statistical advice, and Karl-Heinz Sudekum, University of Kiel, for his help with the calculations. We also thank Hans Hagemeister and his co-workers, Department of Dairy Research, Gel, for their help with freeze-drying. Special appreciation goes to the volunteers for their excellent cooperation.
R E F E R E N C E S
Adlercreutz, H. & Tallqvist, G. (1959). Variations in the serum total cholesterol and hematocrit values in normal
Anderson, N. E. & Clydesdale, F. M. (1980). Effect of processing on dietary fiber content of wheat bran, pureed
Anderson, J. W., Gustafson, N. J., Spencer, D. B., Tietyen, J. & Bryant, C. A. (1990). Serum lipid response of
women during menstrual cycle. Scandinavian Journal of Clinical and Laboratory Investigation 11, 1-9.
598 E. W I S K E R A N D O T H E R S
hypercholesterolemic men to single and divided doses of canned beans. American Journal of Clinical Nutrition Arbeitsgemeinschaft Getreideforschung (1978). Standard-Methoden fur Getreide, Mehl und Brot (Standard
Methods for Grain, F[our and Bread). Detmold, Germany: Schafer.
Bach Knudsen, K. E., Aman, P. & Eggum, B. 0. (1987). Nutritive value of Danish grown barley varieties. I.
Carbohydrate and other major constituents. Journal of Cereal Science 6, 173-186.
Berger, M. & Venhaus, A. (1992). Dietary fibre in the prevention and treatment of diabetes mellitus. In Dietary
Fibre - A Component of Food, pp. 279-292 [T. F. Schweizer and C. A. Edwards, editors]. London: Springer.
Bjorck, I., Nyman, M. & Asp, N. G. (1984). Extrusion cooking of dietary fiber - effects on dietary fiber content
and on degradation in the rat intestinal tract. Cereal Chemistry 61, 174-179.
Chen, W. J., Anderson, J. W. & Jennings, D. (1984). Propionate may mediate the hypocholesterolemic effects of
certain soluble plant fibres in cholesterol-fed rats. Proceedings of the Society for Experimental Biology and
Medicine 175, 215218.
Cummings, J. H. (1984). Microbial digestion of complex carbohydrates in man. Proceedings of the Nutrition
Society 43, 3544.
Cummings, J. H. (1986). The effect of dietary fiber on fecal weight and composition. In Handbook of Dietary Fiber
in Human Nutrition, pp. 211-280 [G. A. Spiller, editor]. Boca Raton: CRC Press.
Demacker, P. N. M., Schade, R. W. B., Stalenhoef, A. F. H., Stuyt, P. M. J. & Van't Laar, A. (1982). Influence
of contraceptive pill and menstrual cycle on serum lipids and high-density lipoprotein cholesterol concentrations.
British Medical Journal 284, 1213-1215.
Deutsche Forschungsanstalt fur Lebensmittelchemie (1986). Souci, Fachmann, Kraut. Nahrwert Tabellen 1986187
(Nutrition Tables 1986187). Stuttgart, Germany: Wissenschaftliche Verlagsgesellschaft.
Deutsche Gesellschaft fur Ernahrung (1988). Erniihrungsbericht 1988 (Nutrition Report 1988). Frankfurt, Germany : Henrich.
Eckel, W., Wieland, H., Heuck, C. C., Seidel, D., Dietrich, R. & Scheurler, H. (1977). Eine zuverlassige und
einfache Methode zur Erkennung gefahrlicher Formen von Dyslipoproteinamie (A reliable and simple procedure for detection of dangerous forms of dyslipoproteinemia). Arztliches Laboratorium 23, 101-1 10.
Englyst, H. N. & Cummings, J. H. (1984). Simplified method for the measurement of total non-starch
polysaccharides by gas-liquid chromatography of constituent sugars as alditol acetates. Analyst 109,937-942.
Gormley, T. R., Kevany, J., Egan, J. P. & McFarlane, R. (1977). Effects of apples on serum cholesterol levels in
humans. Irish Journal of Food Science and Technology 1, 117-128.
Gormley, T. R., Kevany, J., ODonnell, B. & McFarlane, R. (1979). Effects of peas on serum cholesterol levels
in humans. Irish Journal of Food Science and Technology 3, 101-109.
Jacobs, L. R. (1990). Influence of soluble fibers on experimental colon carcinogenesis. In Dietary Fiber. Chemistry,
Physiology and Heulth Efects, pp. 399402. [D. Kritchevsky, C. Bonfield and J. W. Anderson, editors]. New
York: Plenum Press.
Jenkins, D. J. A,, Reynolds, D., Leeds, A. R., Waller, A. L. & Cummings, J. H. (1979). Hypocholesterolemic
action of dietary fiber unrelated to fecal bulking effect. American Journal of Clinical Nutrition 32, 243&2435.
Kesaniemi, Y. A., Tarpila, S. & Miettinen, T. A. (1990). Low vs high dietary fiber and serum, biliary, and fecal
lipids in middle aged men. American Journal of Clinical Nutrition 51, 1007-1012.
Key, F. B. & Mathers, J. C. (1990). Estimation of the digestibility of NSP for wholemeal bread and haricot beans
fed in mixed diets. In Dietary Fibre, Chemical and Biological Aspects, pp. 254258. [D. A. T. Southgate,
K. Waldron, I. T. Johnson and G. R. Fenwick, editors]. Cambridge: Royal Society of Chemistry.
Kritchevsky, D. & Story, J. A. (1986). Influence of dietary fiber on cholesterol metabolism in experimental
animals. In Handbook of Dietary Fiber in Human Nutrition, pp. 129-142 [G. A. Spiller, editor]. Boca Raton:
CRC Press.
Lintas, C. & Cappeloni, M. (1988). Content and composition of dietary fibre in raw and cooked vegetables.
Human Nutrition: Food Sciences and Nutrition 42F, 1 17-124.
Longland, A. C. & Low, A. G. (1990). The contribution of microbial non-starch polysaccharides (NSP) to the total NSP content of faeces. In Dietary Fibre, Chemical and Biological Aspects, pp. 7376. [D. A. T. Southgate,
K. Waldron, I. T. Johnson and G. R. Fenwick, editors]. Cambridge: Royal Society of Chemistry.
McNeill, N. I. (1984). The contribution of the large intestine to energy supplies in man. American Journal of
Clinical Nutrition 39, 338-342.
Nyman, M. &Asp, N. G. (1985). Dietary fibre fermentation in the rat intestinal tract: effect of adaptation period,
protein and fibre levels, and particle size. British Journal of Nutrition 54, 635-643.
Nyman, M., Bjorck, I., Hikansson, B. & Asp, N.-G. (1987~). Popping of whole grain wheat. Effects on dietary
fiber degradation in the rat intestinal tract. Journal of Cereal Science 5, 67-72.
Nyman, M., Pilsson, K. E. & Asp, N. G. (19873). Effects of processing of dietary fibre in vegetables.
Lebensmittel- Wissenschaft und Technologie 20, 2%36.
Nyman, M., Schweizer, T. F., Pilsson, K. E. &Asp, N. G. (1991). Effects of processing on fermentation of dietary
fibre in vegetables by rats. Lebensmittel- Wissenschaft und Technologie 24, 433-441.
Prosky, L., Asp, N.-G., Furda, I., DeVries, J. H., Schwekr, T. F. & Harland, B. (1985). Determination of total
dietary fiber in foods and food products. Collaborative study. Journal of the Association of O#icial Analytical
Chemists 68, 677-679.
51, 1013-1019.
available at https:/www.cambridge.org/core/terms. https://doi.org/10.1079/BJN19940061