ELSEVTER Cardiovascular Research 30 (19%) 449-459
Block of impulse propagation at an abrupt tissue expansion: evaluation
of the critical strand diameter in 2- and 3-dimensional computer models
Vladimir G. Fast *, Andre G. Kleber
Department of Physiology, University of Berne. Biihlplatz 5, CH-3012, Brme, Switzerlund
Received 26 January 1995; accepted 11 May 1995
Abstract
- -.-. .___ .-_- --_----
Objective: Unidirectional conduction block in the heart can occur at a site where the impulse is transmitted from a small to a large tissue volume. The aim of this study was to evaluate the occurrence of conduction block in a 2-dimensional and 3-dimensional computer model of cardiac tissue consisting of a narrow strand abruptly emerging into a large area. In this structure, the strand diameter critical for the occurrence of block, h,, was evaluated as a function of changes in the active and passive electrical properties of both the strand and the large medium. M&hods: The effects of changes in the following parameters on h, were analysed: (I 1 maximum sodium conductance (gNa,,, 1, (21 longitudinal (R,) and transverse (R,) intracellular resistivities, and (3) inhomogeneities in gNa,,,, and R, and R,” between the strand and the large area. Three ionic models for cardiac excitation described by Beeler-Reuter, Ebihara-Johnson, and
Luo-Rudy ionic current kinetics were compared. Results: In the 2-dimensional simulations, h, was 175 pm in Ebihara-Johnson and Beeler-Reuter models and 200 pm in the Luo-Rudy model. At the critical strand diameter, the site of conduction block was located beyond the transition, i.e. a small circular area was activated in the large medium, whereas with narrower strands conduction block
occurred within the strands. The decrease of gNa,,, resulted in a large increase of h,. This increase was mainly due to the change of d%7l,x in the large area, while h, was almost independent of giva,,, in the strand. Changing R, had no effect on h,, whereas the
increase of R, decreased h, and reversed conduction block. Inhomogeneous changes of R, and R, in the strand versus the large medium had opposite effects on h,. When the resistivities of the strand alone were increased, h, also increased. In contrast, the increase of the resistivities in the large area reduced h,. In the 3-dimensional model, h, was 2.7 times larger than the corresponding Sdimensional values at the various levels of gNa,,, and resistivity. Conclusions: (1) At physiological values for active and passive electrical
properties, h, in the 2D simulations is close to 200 pm in all three ionic models. In the 3-dimensional simulations, I?, is 2.7 larger than in the 2-dimensional models. (2) The excitable properties of the large area but not of the strand modify h,.. The decrease of intercellular
coupling in the large medium facilitates impulse conduction and reduces h,., while the same change in the strand increases h,.. (3) Occurrence of conduction block at an abrupt geometrical transition can be explained by both the impedance mismatch at the transition site and the critical curvature beyond the transition.
Keywords: Computer model; Conduction; Anisotropy
_ _-.. _ “... .._-_--_.--_. 1. Introduction
Impulse conduction in cardiac tissue is dependent on the flow of local current at the front of the propagating wave. At a site of an abrupt geometrical expansion from a narrow cardiac strand into a large volume of myocardium, the amount of current supplied by the strand may not suffice to discharge the increased membrane surface down- stream and conduction may fail (current-to-load mismatch). In the case where conduction is successful in the opposite direction (decrease of the electrical load across the transi- tion) unidirectional conduction block (UDCB) will occur.
In the heart, a change in electrical load occurs in variety of locations including junctions between Purkinje fibers
and ventricular muscle [l], between SA node and atria1 tissue [2], between accessory pathways and myocardium in the WPW syndrome [3], and between thin cell strands surviving within an infarcted myocardium and intact tissue [4]. The effect of a geometrical expansion on impulse conduction was studied theoretically in 1 -dimensional ca- ble models representing either an axon or a cardiac strand [5-lo]. Experimentally, it was investigated in several tis- sue models including Purkinje-muscle junction [ 11-l 31, branching muscle bundles [14], an isthmus connecting two large areas of atria1 or ventricular tissue [3,1~,16] and
* Corresponding author. Tel. (+41-31) 631 87 07; Fax (+41-31) 631
46 11.
0008-6363/95/$09.50 6 1995 Elsevier Science B.V. All rights reserved
SSZll noox-~3~3~~~s~ooo7l-~
450 V.G. Fast, A.G. Klkber/Cardiouascular Research 30 (1995) 449-459
patterned cell cultures with narrow strands abruptly diverg- ing into a large cell area [17-191.
An important parameter in the geometry-dependent mechanism of UDCB is the critical diameter of a cardiac strand at which the block occurs. This parameter shares a close similarity with the critical size of excited tissue necessary to produce a propagated response (concept of liminal length [20-2211, with the critical width of an isthmus connecting two large excitable areas [ 161, and with the critical curvature of a propagating wave front [23,24]. The value of critical strand width has not been calculated in the computer simulations until now and its dependence on the passive and active model properties has not been established. Here we use a computer model of cardiac excitation to calculate the critical strand width and to evaluate its dependence on tissue properties. The specific goals were the following:
(1) To evaluate the critical strand size in 2-dimensional vs. 3-dimensional models. The electrical load imposed by the large tissue area on the narrow strand depends on the dimensionality of the large area. Thus, the critical strand width is expected to be different depending on whether the strand diverges into a thin 2-dimensional sheet of myo- cardium or into a 3-dimensional myocardial wall.
(2) To investigate the effects of inhomogeneities in tissue properties at the geometrical expansion on critical strand width. We modelled inhomogeneities in excitability and in resistivity between the strand and the large area. Such an inhomogeneity is present at the PM junction where both passive and excitable properties of the Purkinje fiber and of the ventricular muscle are different.
(3) To test whether the main findings about the critical strand width are model independent by using different models for the description of ionic currents in ventricular myocardium according to Beeler-Reuter [25], Ebihara- Johnson [26], and Luo-Rudy [27].
2. Methods
The 2-dimensional (2D) model was designed to de- scribe impulse propagation in a thin sheet of myocardium and was similar to the model used previously [19]. The extracellular medium was assumed to be isotropic and its resistance to be negligible. The model did not include the cellular structure, i.e. intercellular and cytoplasmic resis- tances were lumped together. However, the overall intra- cellular resistivity could be varied throughout the medium. The equation which describes propagation in the 2D model was the following:
where V is membrane potential, C, is the specific mem- brane capacitance ( ELF/cm*>, S, is the surface-to-volume ratio, Ii,, is the total ionic current ( PA/cm*), R, and R, are internal resistivities in x and y directions (flcm).
In the 3D case, we considered a model with cylindrical symmetry. In this case, the 3D analog of eq. 1 can be
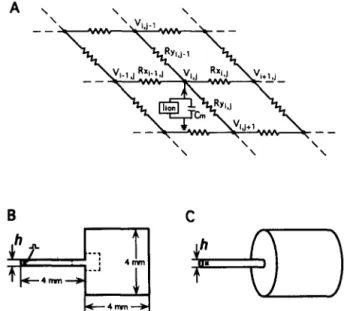
Fig. 1. (A) Electrical equivalent circuit of the anisotropic cardiac sheet. Membrane elements are represented as a capacitance C, in parallel with ionic current, I,,,, described by either Ebihara-Johnson, Beeler-Reuter or Luo-Rudy ionic current models. R, and R, are resistive connections between excitable elements in x and y directions respectively. (B and C) 2-dimensional (B) and 3-dimensional (C) structures with an abrupt expan- sion of a narrow strand into a large medium. h is a stand width (B) or a strand diameter (0. Asterisk indicates the site of stimulation. Only small portion of the medium (indicated by a dashed line in B) was used in subsequent Figures for the presentation of activation maps.
reduced to 2D equation and presented in the following form:
Here, x corresponds to the axes of symmetry, and y corresponds to the radial coordinate (see Fig. 1C).
To solve eq. 1 numerically, it was divided into isopoten- tial excitable patches of the dimensions Ax and Ay (Fig. 1A). Substituting the right part of the eq. 1 with the difference approximation, the equation for membrane po- tential of the 2D patch with coordinates i, j is the follow- ing:
ayj 1
cm2 = S [ K.r;i- l,j( vi-1.j - vi.j)
at ”
where
-Kx;i,j(Vi,j - vi+ l,j>
+Ky;i,j-l(Vi,j - Y,j-I)
-Ky;i,j( vi,j - K,j+l)] - ‘ion
1 1
Kx;i,j =
Ax*R,,,,~ ’ and Ky;i,j = AY*Ry;i,j
(3)
describe the resistive links in x and y directions of the element (i, j). The geometrical shape of the model and the pattern of resistive connections were coded by coefficients KXiij, Ky;i,j which were calculated in advance and stored in arrays. The impermeable boundaries were modeled by setting K,,i,j = 0 and Ky;i,j = 0 at the border elements.
V.G. Fast, A.G. Kl&er/ Cardiooascular Research 30 (190.5) 4494.59 451
In the 3D case, the corresponding difference approxima- tion is the following:
-fL,,P!,, - v/. I.,)
+ &jKv:~,,
l(Y.j- vl.j 1) --Kt.,,j(Y,, - Y,,r+-1))1
-‘ionwhere
1
K;,,, =
i
Ax2L., ’
and K,,., j = I 9 AY~R,,,,~The equations 3 and 4 were solved using the Peace- man-Rachford alternating-direction implicit algorithm [28]. Space integration steps Ax, Ay were varied in the range from 10 to 50 pm to keep the ratio between the electro- tonic space constant and the space integration step at about 20. The ordinary differential equations for the ionic vari- ables were solved by the Rush-Larsen algorithm [29,30]. The time integration step was in the range from 1 to 3 ps depending on the value of maximum sodium conductance. Computer-generated lookup tables with AV = 0.1 mV were used to calculate rate constants.
The simulated structures are shown on Fig. 1B and C. The 2D structure consisted of a narrow strand of a width h abruptly emerging into a large area. The corresponding 3D structure was obtained by rotation of the 2-dimensional structure around the axis of symmetry. In this case, h corresponds to the diameter of the strand. The dimensions of the large area and the length of the strand were 4 mm which was about six times larger than electrotonic space constant. Simulations showed that the dimensions of the large area did not affect impulse propagation at the transi- tion point when the dimensions were larger than two space constants. Impulse propagation was initiated at the left end of the strand by injecting current with double threshold strength. To determine the critical width, h,, propagation was simulated in structures with gradually decreasing strand width and the value for last successful propagation was defined as h,.
The value for C, = 1.0 pF/cm2 and S,. = 0.25 pm- ’ were normally used in calculations. Three models describ- ing the kinetics of ionic current Z,,,, were used: the Beeler-Reuter model [25] referred to in the text as the BR model, the Ebihara-Johnson (EJ) model [26], and the Luo-Rudy (LR) model [27]. The reversal potential for the slow inward current was fixed at +70 mV in all models. The critical strand diameter was calculated as a function of maximal sodium conductance, @Vu,,,, and the tissue resistivities, R, and R,. From Eq. 1 follows that isotropic variation of tissue resistivities is equivalent to the change in surface-to-volume ratio S,. .
Activation times were determined at the moment when membrane potential reached the value of - 60 mV which is close to the threshold potential for the sodium inward current in all models. Selection of this activation criterion
was validated in our previous work 1191. These activation times were used for constructing isochrone activation maps. Simulations were programmed in FORTRAN and carried out on VAX-6410 with Vector Processor
3. Results
3.1. Slow conduction and conduction block at the abrupt expunsion
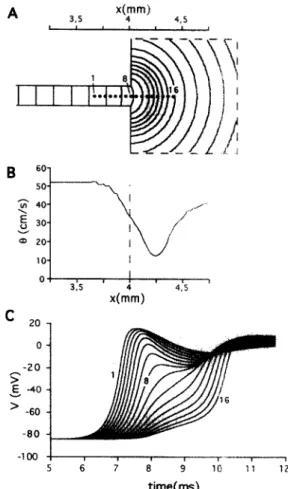
Fig. 2 demonstrates impulse conduction in the 2D model with an abrupt expansion described by Luo-Rudy ionic current kinetics. In this simulation, the width of the strand (200 pm) was slightly larger than the width necessary for
conduction block to occur. Panel A shows an isochronal map of wave propagation across the transition region, Panel B shows the profile of conduction velocity, and
Panel C shows the changes in action potential waveshapes. Far from the expansion in the strand, the excitation front was flat (A) and the impulse propagated with a uniform conduction velocity of 52.1 cm/s. Immediately before the transition, conduction slowed (Bl and the excitation front became slightly curved. The most prominent changes in activation spread occurred immediately after the transition.
3.5 x(qmm) 4 5 B 60 50 F 40 x---- E 30 s ?/ = 20 10 0 ~ 3,s x(m4-n) 435 -20 9 jj 40 ' -60 -80
-loa
m--
11
12 time( ms)Fig. 2. Slowing of conduction at an abrupt expansion. (A) Isochrone map (interval 0.3 ms) of wave propagation in a portion of medium indicated by the dashed line in B. Strand width = 200 pm. The distance, Y, is measured from the left end of the strand. kB) Conduction velocity (0) profile across the transition. (C) Recordings of action potentials (V) at
selected points depicted in A. Luo-Rudy mode! with ~&$,,,, = 23
452 V.G. Fast, A.G. Klt?ber/Cardiouascular Research 30 (1995) 449-459
The excitation front acquired a nearly-circular shape and conduction velocity decreased to 12.5 cm/s. The minimal conduction velocity was reached in the large area at a distance of 250 pm from the transition. Afterwards, the conduction accelerated and slowly approached the value for conduction velocity in the strand. Action potential upstrokes (C) had specific biphasic shapes with two rising phases typical for the geometrical expansion. Similar waveshapes were experimentally observed at PM junctions [11,31,32] and at the junction between cultured cell strands and a large cell area [19].
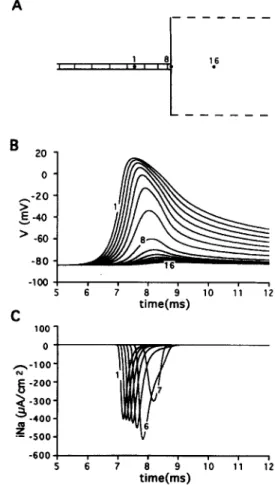
The decrease of the strand width, h, to 175 pm pro- duced conduction block as shown on Fig. 3 while propaga- tion was successful in the reversed direction (not shown). Voltage traces (Panel B) demonstrated that the action potential amplitude and duration gradually diminished across the transition. Such a gradual decrease of amplitude has been observed experimentally at a transition from a narrow cell strand into a large area in cultured cell mono- layers using high-resolution optical recordings [18,19]. Be- cause of the gradual changes in the voltage waveshapes, it was not possible to distinguish between actively generated responses and purely electrotonic potentials and therefore to locate conduction block. However, the site of conduc- tion block could be determined from the traces of sodium inward current, ijVu, depicted on Panel C. In contrast to the voltage changes, the amplitude of the sodium current first
s-20 E - -40 > -60 -80 -100 ; 6 7 8 9 10 11 12 time(ms) C 100 1 0 p-100 g -200 a -300 3 -400 m z -500 -600 -I 1 5 6 7 tYme(A) 10 11 12
Fig. 3. Conduction block at abrupt expansion. Strand width = 175 pm. Other parameters are the same as on Fig. 2. (A) Isochrone map with interval of 0.3 ms. (B and Cl Recordings of action potentials (VI and sodium current (Na) at the selected points depicted in A.
9 -20 g-40 ' -60 -80
-loo:
12 m time(ms)-6oo
4
12 time(ms)Fig. 4. Conduction block at a strand with the width of 50 pm. Other parameters are the same as on Fig. 2. (A) Isochrone map with interval of 0.3 ms. (B and C) Recordings of action potentials (V) and sodium current (&‘a) at the selected points.
increased at the transition and then almost abruptly dropped to zero; no sodium current was activated at point 10 and beyond. The initial increase of the sodium current was caused by the slowing of the depolarisation rate near the transition which allowed more time for the activation of sodium current. As judged by the abrupt decrease of the current amplitude, conduction block occurred between points 9 and 10 at a distance between 50 pm and 100 pm from the expansion. The maximal membrane potential at these two points was - 35 mV and - 47 mV respectively. These values are slightly higher than the threshold poten- tial in the LR model (-60 mV). No sodium current was activated at sites 10 through 16. Therefore, the voltage traces at these points were interpreted as purely electro- tonic potentials.
Block of conduction from a strand of subcritical width
(h = 175 pm, Fig. 3) occurred beyond the transition, i.e. a small circular nucleus of excitation was present in the large area. As depicted on Fig. 4, the further decrease of the strand width to 50 pm resulted in more proximal localisation of conduction block. In this case, more pro- found changes in action potential waveshapes and a more rapid decrement of conduction as compared to Fig. 3 were observed. The traces of the sodium current (Panel C) showed that the site of the conduction block was located between points 7 and 8 at a distance of 50 pm before the transition. Therefore the activation wave did not leave the strand.
V.G. Fast, A.G. Kl6ber/Cardiovascular Research 30 (1995) 449-4S9 3.2. Conduction across an isthmus
Cabo et al. recently investigated impulse conduction in a different structure consisting of a short isthmus connect- ing two large areas of ventricular myocardium [16]. To compare the results obtained at the geometrical expansion with the isthmus-type geometry we modelled the isthmus structure as illustrated on Fig. 5A. The length of the isthmus was fixed (50 pm) and conduction was studied as the function of the isthmus width. Otherwise the model parameters were the same as for the simulations presented on Fig. 2-4 (Luo-Rudy ionic model). Several differences in impulse conduction across the isthmus were found with respect to the strand structure. Firstly, impulse conduction was blocked at a smaller isthmus width than in the case of the strand. The critical isthmus width was 150 pm which is 25% smaller than the critical strand width. Secondly, the characteristics of conduction near the transition region were different. Fig. 5 shows impulse conduction across an isthmus with the critical width of 150 pm. Excitation was initiated by stimulating all elements at the left border of the model simultaneously. As in the strand, the excitation front was flat far from the transition (Panel A) and parame- ters of propagation were the same as in the strand. In contrast to the strand, the activation front became concave before the isthmus (Panel A), conduction accelerated (Panel B) and the action potential amplitude transiently increased
v IO! , I ! . I , 3,5 x(Rm) 4.5 C 4o 1 .lOO.. 5 6 7 9 10 11 12 time(ms)
Fig. 5. Impulse conduction across an isthmus. Isthmus length = SO pm, isthmus width = 150 pm. (A) Isochrone map of activation, isochrone interval of 0.15 ms. The distance, X, is measured from the left end of the strand. (B) Conduction velocity (8) profile across the transition. (C) Recordings of action potentials (V) at the selected points depicted in A.
Luo-Rudy model with gNa,,, = 23 mS/cn?, R, = R, = 450 Ocm.
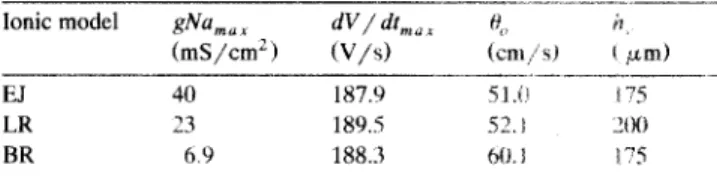
Table 1
Critical strand width, h,, in different ionic models
Ionic model 8%,, (mS/cm’) --.-_-.---._I- dV/dtn,,, % A (V/s) (Cttl/Sl ( FmJ -..-..- - EJ 40 187.9 .?I.(1 175 LR 23 189.5 i2.t ‘00 BR 6.9 188.3 ho. I i-5 _....______ __I_ El, LR, and BR indicate Ebihara-Johnson, Luo-Rudy, and Beeler-Reuter
ionic models respectively; gNa,,, indicates maximum sodium conduc-
tance; dV/dt,,, and 0, indicate maximal upstroke rate of rise and
conduction velocity measured during uniform propagation of a planar wave.
(Panel Cl. In the strand, conduction slowed and the ampli- tude decreased at the corresponding region (Fig. 21.
3.3. Critical strand width in different ionic modelo
Three ionic models are preferentially used in literature for the description of ionic currents in ventricular myo- cardium referred as Beeler-Renter [25], Ebihara-Johnson [26], and Luo-Rudy [27] models. Therefore we compared transitional action potential waveshapes and values for critical strand width, h,, in all three models and found similar results. Action potential upstrokes exhibited charac- teristic biphasic shapes during impulse conduction across geometrical expansion as shown on Fig. 2 in all three models. In each case, conduction block occurred at some value of the strand diameter which depended on the level of excitability. To compare the values for h, among the different models, the excitability of the models was ad-
justed to give comparable values of the maximal upstroke rate of rise, dV/dV,,,, during steady-state propagation. This meant increasing gNa,,, from 23 to 40 mS/cm’ in the EJ model and from 4 to 6.9 mS/cm’ in the BR model to match dV/dt,,, of the Luo-Rudy model. The models were assumed to be isotropic and passive model parame- ters were set equal (R = 450 LR cm). Table 1 contains the results of calculations of h, in the three models along with dV/4n,, and conduction velocity, H,, of a uniformly propagating planar wave. The accuracy of calculation of
h, was determined by the size of the excitable elements which was 25 pm in these simulations. It can be seen that the differences in h, between the three models were within the computational precision. Also, conduction velocity was essentially the same in El and LR models. The close results obtained in EJ and LR models are due to the similarity in the description of the fast sodium current in these two models (see Discussion). The conduction veloc- ity in the BR model was about 20% larger than in the EJ and LR models at the comparable level of dV/dt,,,,,. 3.4. Critical strand width in 3-dimensional model L‘S, 2-dimensional model
The electrical load imposed by the large tissue area on the narrow strand depends on the dimensionality of the large area. In 3-dimensional tissue the electrical load is larger than in the 2-dimensional tissue. Thus h,. is ex- pected to be different depending on whether the strand diverges into a thin sheet of myocardium or into the
454 V.G. Fast, A.G. KEber / Cardiovascular Research 30 (1995) 449-459 3 gNa,(mS/cm2) h
‘0.j y..!,
0 50 100 150 gNa,,,(mSkmz) C 2-IO6
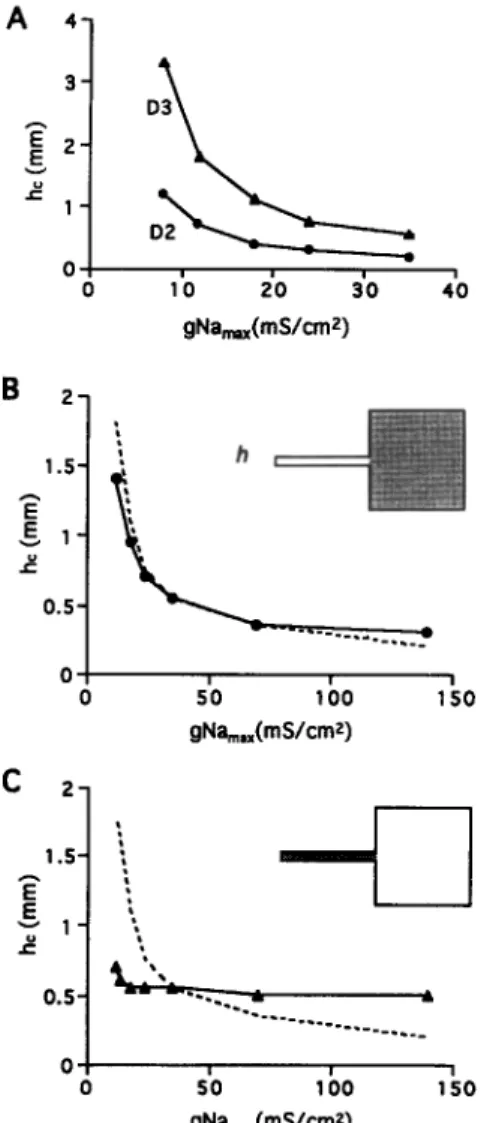
150 gNa,,,(mS/cmz)Fig. 6. Dependence of critical strand width, h,, on maximum sodium
conductance gNa,,,. (A) Effect of uniform change in gNa,,, in the
two- (D2) or three- (D3) dimensional models (EJ model with R = 450 &cm). (B and C) Effect of a nonuniform change of gNa,,, in the 2D model. Dashed curves correspond to the control when excitability was
changed uniformly throughout the model. Shaded areas in the inset
indicate the parts of the model where gNa,,, was altered: the large area (B) or the strand (C).
myocardial wall. In order to compare the 2D with 3D models, h, was calculated in 2D and 3D models at differ- ent values of excitability.
Fig. 6A shows the dependence of h, on maximum sodium conductance gNa, ox for homogeneous 2D and 3D models described by EJ ionic current kinetics. For a gN%,,, = 24 mS/cm’ used in the original formulation of the model 1261, h, was 0.3 and 0.8 mm for 2D and 3D models, respectively. At gNa,,, = 35 mS/cm2 which more closely represents adult myocardium, h, was 0.2 mm (2D model) and 0.55 mm (3D model). A decrease of excitability to 8 mS/cm2 produced a rapid increase of h,. The maximal values of h, reached in these simulations were 1.2 mm in the 2D case and 3.3 mm in the 3D case. At all values of gNa,,, h, in the 3D model was larger than in the 2D model by a factor of 2.7.
3.5. Efect of inhomogeneity in gNamax
The success of impulse conduction across a tissue ex- pansion depends on both the properties of the strand
(source of current) and the large area (current sink). In order to estimate the relative contributions of the excitabil- ities of the strand and of the large area, we calculated h,
upon changing gNa,,, either in the strand or in the large area. Panel B on Fig. 6 shows the effect of gNa,,,
changes in the large area alone in the 2D model described by EJ kinetics. In this case, the gNa,,, in the strand was kept constant at a level of 35 mS/cm2. Panel C shows the effect of changes of gNa,,, in the strand when the excitability of the large area was constant. For comparison, the dashed lines represent the effect of a uniform change of gN%,,, in the whole model. As shown on Panel B, h,
was critically dependent on gNa,,, of the large area. By contrast, h, was almost independent of the excitability of the strand CC). This suggests that conduction block at the site of abrupt change of electrical load is mainly dependent on excitable properties of the cells distal to transition (large medium) and less on the excitability of the proximal cells (strand).
3.6. Dependence of h, on axial resistivity
In our previous work we have demonstrated that the increase of intracellular resistivity in the large area facili- tated impulse conduction across a simulated geometrical expansion [19]. Here we further investigate this effect and evaluate the dependence of h, on intracellular resistivity and anisotropy in 2D and 3D models.
Dependence on resistivity in 20 vs. 30 models. The uniform increase of axial resistivity, R, facilitated impulse
04 0 500 1000 1500 2000 I R @cm) 0.14 0 500 1000 1500 2000 , R @km)
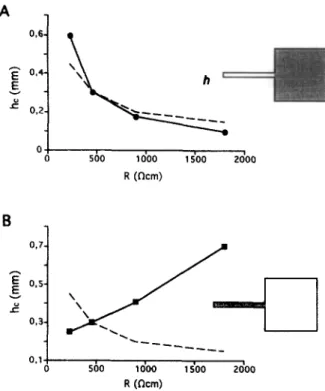
Fig. 7. Dependence of h, on intracellular resistivity R. (A) Effect of a uniform change in R in isotropic 2D and 3D models (EJ model with
tia,,, = 24 mS/cm’). (B) Effect of anisotropic change in R in a
uniform 2D model. The longitudinal resistivity, R,, was changed in the whole model while transverse resistivity, R,, was kept constant (curve “R,“) or, alternatively, R, was altered with constant R, (curve “R,“). The increase of transverse resistivity produced a decrease in h, while a change in longitudinal resistivity did not affect h,.
V.G. Fast, A.G. KEber / Cardiovascular Research JO (lOg5) 44%4.59 455 A 04 0 500 1000 1500 2000 1 R (ncm) O,lv 0 500 1000 1500 2000 , R (ncm)
Fig. 8. Effect of a nonuniform change in intracellular resistivity on h,. (A) Resistivity R was varied in the large area. (B) Resistivity of the strand was changed. For comparison, the dashed curves correspond to the control when resistivity was changed uniformly throughout the model. Shaded areas in the insets indicate the parts of the model where R was
altered. EI model with gNa,,, = 24 mS/cm’.
conduction across the expansion. When the strand width was narrow enough to produce conduction block at normal
R, the increase of R prevented the block. Conduction block was produced again at a smaller value of the strand width. Fig. 7A shows the dependence of h, on uniformly distributed resistivity in isotropic 2D and 3D models de- scribed by EJ kinetics with gNu,,, = 24 mS/cm*. Inte- gration steps in these simulations were decreased with increasing intracellular resistivity, R, in order to keep a constant ratio ( N 20) between the electronic space constant and the space integration step (see Methods). The depen- dencies were well fitted by the inverse square-root relation
h, N l/R’/’ in both 2D and 3D models. In the 3D model,
h, was larger than that in the 2D model by a constant factor of 2.7. This factor was the same as in the case when swn,, was varied (Fig. 6A).
Effect of anisotropy. Fig. 7B demonstrates the effect of an anisotropic change in the axial resistivity in both the strand and the large area. In the first case, the longitudinal resistivity (R,) was uniformly changed while transverse resistivity was kept constant (R,, = 450 Qcm). On the second plot, the resistivity in the transverse direction CR,)
was varied with constant R,. Only the transverse resistiv- ity affected h, while the longitudinal resistivity had no effect.
Inhomogeneous change of resistioity. Fig. 8 shows the effects of inhomogeneous changes in resistivity on h, in the isotropic 2D model. As depicted on Panel A, h,
decreased when the resistivity of the large area alone was increased and the resistivity of the strand was kept con-
stant (4.50 i2,cm). The dependence of h, on R was rather close to the change in h, upon a uniform variation of resistivity (dashed line). An entirely different result was obtained when the strand resistivity was altered (Panel B). In this case, the increase of resistivity resulted in an increase of h, .
3.7. Modeling of geometrical transition in heart c*eEl cul- ture
Recently, h, was measured in a-dimensional monolay- ers of cultured neonatal rat heart cells consisting of narrow strands abruptly diverging into a large cell area 1191. In order to test the predictive value of the model, the model was adjusted to fit the morphological and electrophysiolog- ical properties of cultured cell strands and monolayers. Two structural features of experimental preparations were simulated. Firstly, the geometrical transition from a strand into the large area was modified to include a funnel. i.e. a final portion of the strand with gradually increasing width. In cell cultures, the funnel had a length of 100 pm and a width of about 100 pm immediately before the large area. Secondly, a difference in intracellular resistivity between the strand and the large area was included to reproduce the difference in conduction velocity between the strand and the large area (34 cm/s vs. 25 cm/s [19]). In addition, the smaller cell size and the flatter shape in cell cultures compared to adult cells were considered by increasing the surface-to-volume ratio, S,.. These properties were in- cluded in the structure which is shown on Fig. 9A. The funnel had a simple linear shape with a length of 100 pm and a width of 120 pm. The Ebihara-Johnson model with swnax = 35 mS/cm’ and S, = 0.67 pm ’ was used. The resistivity was 400 SZcm within the strand and gradu- ally increased to 800 slcm upon transition through the funnel into the large area. During steady-state propagation
01 1 I , ! , , , ,
1,l 1,3 1,s 1,7 1 ,s x(mm)
Fig. 9. Impulse conduction in a structure with a terminal Funnel and a gradient of R. (A) Isochrone map of activation with time interval of 0.3 ms. Strand width = 30 pm, funnel length = 100 pm, funnel expansion = from 30 to 120 pm. Intracellular resistivity increases within the funnel in a linear fashion from 400 flcrn to 800 Ckm. (B) Conduction velocity (0) profile across the transition. Ebihara-Johnson model with gNa,,,c =
456 V.G. Fast, A.G. Klt2ber/Cardiouascular Research 30 (1995) 449-459
the maximal upstroke rate of rise was 172 V/s, the conduction velocity within the strand and within the large area were 32 cm/s and 23 cm/s, respectively. In these conditions, the critical strand width which resulted in successful propagation was 30 pm. Panel B demonstrates the profile of conduction velocity upon transition into the large area. In contrast to impulse conduction through a simple step-wise expansion (Fig. 21, conduction velocity was minimal at the transition to the large area which is consistent with experimental findings [ 191.
4. Discussion
4.1. Evaluation of the computer model
ID vs. 20 and 30 simulations. The effect of an abrupt increase in cable diameter on impulse conduction has been extensively studied in 1D models of axons or of a cardiac strand [5-91. Two differences exist between a 1D cable and multidimensional (2D and 3D) models. Firstly, in the 1D cable with an abrupt increase in diameter (from h to h’), impulse conduction through the transition region de- pends on the ratio h’/h, not on the real values of h’ or h [6,7]. In contrast, in multidimensional models, propagation is dependent on the real value of the strand diameter. Therefore a critical diameter, h,, can be obtained instead of the critical ratio h’/h. Another difference between conduction in 1D versus conduction in 2D/3D models is related to the effect of axial resistivity. In the 1D case, a uniform change of resistivity R does not affect impulse conduction through the expansion and does not change the critical ratio h’/h, while an uniform increase of R in 2D and 3D models facilitates impulse conduction and reduces h, (Fig. 7A). This difference is due to the presence of a transverse resistivity in the 2D and 3D models (Fig. 7B). Comparison of different ionic models. We obtained essen- tially the same values for h, in all three ionic models of ventricular excitation when excitabilities were adjusted to give comparable values for the maximal upstroke rate of rise. In addition, the values for conduction velocities were close in the EJ and LR models. This is not surprising since these two models share a very similar description for the fast sodium current which is the most important current during the action potential upstroke. There are two differ- ences (besides the differences in @a,,,) in the sodium current kinetics between LR and EJ models: (1) the i variable in the LR model which describes the kinetics of sodium current reactivation, and (2) the more positive reversal potential, ENn, in LR model as compared to EJ model. The i variable does not change during the upstroke of an action potential and therefore this difference is not important for the depolarisation phase. The higher value of ENa in LR model as compared to EJ model (54 mV vs. 29 mV) results in a bigger driving force for the sodium current and, hence, in faster depolarisation. However, this increase in the sodium current is compensated by the smaller @a,,,. Other differences between the two mod- els include a slightly more positive resting membrane potential and a smaller membrane resistance in the LR
model as compared to the EJ model. The higher resting potential in the LR model accelerates membrane depolari- sation. Again, this effect is compensated by adjustment of gN%,,x.
The similarity between the EJ and LR models is valid only for propagation of a single wave or for very slow stimulation rates. Different results can be expected at high excitation rates because significant differences exist be- tween EJ and LR models in the formulation of ionic currents during the repolarisation phase.
Continuity of intracellular resistivity. The facilitating ef- fect of increasing intracellular resistivity on impulse con- duction across an abrupt expansion and the corresponding decrease of h, (Fig. 7) is limited to tissue with continuous uniform properties. In real myocardium, internal resistivity is distributed nonuniformly between the cytoplasm and the intercellular junctions. When cells are well coupled, the effect of the nonuniformity is likely to be small and the continuous cable equation adequately describes impulse propagation on a macroscopic scale [8,33-351. However, when intercellular coupling decreases, the nonuniform dis- tribution of resistivity must be taken into account at some level of uncoupling. Thus our model may not be appropri- ate for certain pathophysiological situations when R in- creases beyond a critical value. A significant deviation from the behaviour of a continuous cable was observed when axial resistivity increased about five-fold in the one-dimensional computer model [35]. In conditions of an additionally reduced excitability such as in myocardial ischemia, linear cable analysis became invalid when R increased approximately by 200% 1361.
Another limitation of this model is related to the as- sumption that the resistance of the extracellular space is negligible. Such an assumption is valid in the case of superfused cultured cell monolayers [19], and to some extent in the case of a superfused isolated thin sheet of epicardial tissue. In case of anisotropic tissue with a restricted extracellular space, the results of this model would be quantitatively applicable when the anisotropic ratios for intra- and extracellular resistivities are equal. 4.2. Estimation of critical strand width in ventricular tissue and cell cultures
One of the main goals of this study was to estimate h, quantitatively for cardiac tissue. Since the ionic models used in these simulations were developed to describe excitation dynamics of ventricular myocytes, we discuss below two types of ventricular tissue where theoretical and experimental attempts to evaluate critical size were made previously: ventricular myocardium and cultured cell monolayers.
Ventricular myocardium. There is relatively close agree- ment among the computations of the different types of “critical sizes” in ventricular myocardium. Tyson and Keener estimated the critical diameter of a tissue nucleus which needs to be excited by a central stimulus to get a centrifugal propagated response. Using a theory which assumes a linear dependence of the velocity of activation
V.G. Fast, A.G. Kl~ber/Cardiovascular Research 30 (199.5) 449-459 17
front on front curvature they obtained a value of 200 pm [23]. Winfree estimated the same parameter from strength- duration curves and arrived at a value of 300 pm for 3D tissue [24]. The other critical parameter, the “liminal length” (size of a tissue area generating inward membrane current during point stimulation [20,21]) was calculated by Joyner et al. in the 2-dimensional Beeler-Reuter model and values between 200 pm and 370 pm were found for different levels of @a,,, [22]. We have previously re- ported a value of 300 pm for the critical strand width in the isotropic 2D Ebihara-Johnson model [37]. The slightly smaller critical strand width obtained in the present study in different ionic models (175-200 pm> is due to the larger assumed value for the surface-to-volume ratio and, hence, a smaller space constant. Cabo et al. calculated the critical width of a short isthmus connecting two large excitable areas [16]. Comparison of the “isthmus geome- try” with the “strand geometry” yielded a 25% smaller value of h, in the strand (see Figs. 2 and 5). The differ- ence between h, in the two geometries is explained by the acceleration of conduction and the increase in action po- tential amplitude in front of the isthmus. In the case of the diverging strand, no increase in conduction velocity or amplitude was present (Fig. 2B). To calculate h, in anisotropic tissue, the orientation of the longitudinal cell axis with respect to the direction of propagation must be taken into account. Depending on cell orientation, anisotropy will reduce h, by a factor of 1 to 3 if a ratio of 10 is assumed for anisotropic differences between R, and R, [38]. This factor is derived from extrapolation of the dependence h,.(R,) shown on Fig. 7 to the R, value of 5000 cIZcm. As a whole, the estimates for the different values of critical size vary between 60 and 200 pm in 2-dimensional tissue.
For the 3-dimensional tissue, our results predict a value 2.7 times larger than in 2-dimensional case (Fig. 6A and 7Al. Thus, h, in anisotropic 3D tissue is in the range of 160-500 Frn. This is consistent with the estimations of critical size of excitation as mentioned above. All esti- mates are significantly larger than the diameter of terminal Purkinje fibers which can be less than 100 pm [39]. Several factors may be taken into account to explain this discrepancy. Firstly, the intracellular longitudinal resistiv- ity of Purkinje fibers has been reported to be lower than in the working myocardium [34,40,41]. According to our simulations (Fig. XA) this difference will reduce h,. Sec- ondly. the funnel hypothesis [ll] postulated the presence of a gradually expanding portion within the PM junction which facilitates impulse transmission. Thirdly, conduction may be facilitated by the presence of a resistive barrier between the two tissues which may reduce the load of large ventricular mass on Purkinje fibers [7,42].
Cell culture. Recently, h, was measured in cultured cell monolayers [19]. In these experiments, propagation was investigated in long cell strands of variable width diverg- ing into a large cell area, i.e. in tissue with a geometry analogous to the simulated structures. In such cultures, h, was 30 pm which is considerably lower than the com- puted 2-dimensional h, value for a simple step-wise ex- pansion. However, when the specific geometrical and func-
tional properties of cultured cell monolayers were taken into account, a close quantitative agreement was obtained. 4.3. Effect
of
tissue inhomogeneitiesIn general, success or failure of impulse conduction depend on the electrical properties of both the strand (current source) and the large area (current sink). Several situations correspond to a case where the passive and active properties in the strand differ from the large area. One example is the junction between a Purkinje fiber and ventricular muscle. Another example is represented by cultured cell monolayers where cell strands and the large area have different intracellular resistivities between two parts [l&19]. Our results demonstrate that there is a con- siderable difference between the contributions of the source and the sink in impulse transmission at a geometrical expansion: varying maximum sodium conductance in the strand had little effect on impulse propagation in compari- son to the changes in excitability of the large area (Fig. 6). We can conclude that the critical size is mainly determined by the excitable properties of the large area. This simpli- fies the modelling of the expansion region since only the excitable properties of the large region need to be simu- lated precisely. The strand gN@,,, does not substantially influence h, because the amount of axial current supplied by the strand into the large area is mainly dependent on the voltage difference between the two parts which is equal to the action potential amplitude. The action potential ampli- tude does not change significantly wrth variation of @a,, r.
In contrast to the changes in excitability. the effects of changes in resistivity in the strand and in the large area were opposite (Fig. 8). The increase in the resistivity of the large area facilitated impulse conduction across the expan- sion and reduced critical strand width. This is explained by the reduction of the electrical load imposed by the large area on the strand. In contrast, the increase of the strand resistivity impaired impulse conduction across the expan- sion. The explanation for the latter effect is that the large strand resistivity reduced the amount of axial current flow- ing from the strand into the large area. A difference in resistivity between the strand and the large area may contribute to the success of impulse conduction at the PM junction as discussed above.
4.4. Critical currature or impedance mismatch?
It has been suggested that conduction slowing and block at the site of a geometrical expansion are determined by the curvature of the excitation front emerging from the narrow isthmus rather than by the impedance mismatch between the small and the large parts [ 161. Following this line of reasoning, it can be suggested that h, is determined by a critical value for the curvature in the large area. Our results partly support this point of view. In particular, the block of conduction from a strand of subcritical width occurred beyond the transition (Fig. 31. Since a small area of excitation was formed in the large area, the dissipation of excitatory current from a highly curved excitation front contributed to the conduction block. Also. the finding that
458 V.G. Fast, A.G. Kl&ber/Cardiouascular Research 30 (1995) 449-459 the changes in h, were largely independent of the strand
excitability and were mainly attributed to the modification of sN%,,, in the large area is in agreement with this idea.
[91 1101 Several considerations indicate that the curvature alone
does not fully describe all changes related to the geometri- cal expansion, however. Firstly, the conduction block in a very narrow strand may occur without the excitation wave entering the large area (Fig. 4). Since the curvature of the excitation front did not change within the strand, the block in this case can be explained by the impedance mismatch between the strand and the large area alone. Secondly, the consideration of the critical curvature does not correctly predict differences of critical strand widths in 3- vs. 2-di- mensional models. Indeed, the value of curvature of a spherical wave front in a 3-dimensional medium is two times larger than the curvature of a circular front in a 2-dimensional medium with the same radius. Therefore, critical strand width should be two times larger in the 3D than in the 2D model. However, in our simulations the 3D-to-2D ratio of h, was 2.7. The stronger dependence of the critical strand width on tissue dimensionality than predicted from the curvature hypothesis suggest that the impedance mismatch between the strand and the large area contributes substantially to conduction changes at the geo- metrical expansion. Thus, both the front curvature and the impedance mismatch appear to determine the geometry-de- pendent slowing of conduction and conduction block at the site of abrupt geometrical expansion.
1111 ml [I31 [I41 [151 [161 [I71 k31 [191 Acknowledgments
This work was supported by the Bonizzi-Theler Foun- dation the Swiss Heart Foundation, and the Swiss National Science Foundation DO1 ml References La [II Dl [31 [41 [51 161 [71 [81
Mendez, C, Mueller, WJ, Merideth J, Moe GK. Interaction of transmembrane potentials in canine Purkinje fibers and at Purkinje fiber-muscle junctions. Circ Res 1969;34:361-372.
Joyner RW, van Capelle FJL. Propagation through electrically cou- pled cells. How a small SA node drives a large atrium. Biophys J 1986;50:1157-1164.
De la Fuente D, Sasyniuk B, Moe GK. Conduction through a narrow isthmus in isolated canine atria1 tissue. A model of the W-P-W syndrome. Circulation 1971;54:803-809.
Smith JH, Green CR, Peters NS, Rothery S, Severs NJ. Altered patterns of gap junction distribution in ischemic heart disease - an immunohistochemical study of human myocardium using laser scan- ning confocal microscopy. Am J Path01 1991;139:801-821. Khodorov BI, Timin YN, Vilenkin SY, Gul’ko FN. Theoretical analysis of the mechanisms of conduction of a nerve pulse over an inhomogeneous axon. I. Conduction through a portion with in- creased diameter. Biofizika 1969;14:304-315.
Goldstein SS, Rall W. Changes of action potential shape and
velocity for changing core conductor geometry. Biophys J
1974;14:731-757.
Joyner RW, Veenstra R, Rawling D, Chorro A. Propagation through electrically coupled cells. Effects of a resistive barrier. Biophys J 1984;45:1017-1025.
Henriquez CS, Plonsey R. Effects of resistive discontinuities on waveshape and velocity in a single cardiac fibre. Med Biol Eng Comput 1987;25:428-438. 1231 [241 [=I 1261 [271 [=I [291 [301
Quan W, Rudy Y. Unidirectional block and reentry of cardiac
excitation: a model study. Circ Res 1990;66:367-382.
Sahakian AV, Myers GA, Maglaveras N. Unidirectional block in
cardiac fibers - effects of discontinuities in coupling resistance and spatial changes in resting membrane potential in a computer simula- tion study. IEEE Trans Biomed Eng 1992;39:510-522.
Mendez C, Muller WJ, Urguiaga X. Propagation of impulses across
the Purkinje fiber - muscle junctions in the dog heart. Circ Res
1970;26:135-150.
Sasyniuk BI, Mendex C. A mechanism for reentry in canine ventric- ular tissue. Circ Res 1971;28:3-15.
Overholt ED, Joyner RW, Veenstra RD, Rawling D, Wiedmann R.
Unidirectional block between Purkinje and ventricular layers of
papillary muscle. Am J Physiol 1984;247:H584-H595.
Spach MS, Miller WTI, Dolber PC, Kootsey JM, Sommer JR, Mosher CE. The functional role of structural complexities in the propagation of depolarization in the atrium of the dog. Cardiac conduction disturbances due to discontinuities of effective axial resistivity. Circ Res 1982;50:175-191.
Inoue H, Zipes DP. Conducton over an isthmus of atria1 myo-
cardium in vivo: a possible model of Wolf-Parkinson-White syn-
drome. Circulation 1987;76:637-647.
Cabo C, Pertsov AM, Baxter WT, Davidnko JM, Gray RA, Jalife J. Wave-front curvature as a cause of slow conduction and block in isolated cardiac muscle. Circ Res 1994,75:1014-1028.
Fast V, Kltber A. Tissue geometry as a determinant of unidirec- tional conduction block: assessment of microscopic excitation spread by optical mapping in patterned myocyte cultures. Circulation
1993;88:1-623.
Rohr S, Salzberg BM. Charactertization of impulse propagation at the microscopic level across geometrically defined expansions of excitbale tissue: multiple site optical recording of transmembrane voltage (MSORTV) in patterned growth heart cell cultures. J Gen Physiol 1994;104:287-309.
Fast V, Kleber A. Cardiac tissue geometry as a determinant of unidirectional conduction block: assessment of microscopic excita- tion spread by optical mapping in patterned cell cultures and in a computer model. Cardiovasc Res 1995;29:697-707.
Noble D. The relaton of Rushton “liminal length” for excitation to the resting and active conductances of excitable cells. J Physiol 1972;226:573-591.
Fozzard HA, Schoenberg M. Strength-duration curves in cardiac Purkinje fibres: effects of liminal length and charge distribution. J Physiol 1972;226:593-618.
Ramza BM, Joyner RW, Tan RC, Osaka T. Cellular mechanism of the functional refractory period in ventricular muscle. Circ Res 1990;66:147-162.
Tyson JJ, Keener JP. Singular perturbation theory of traveling waves in excitable media. Physica D 1988,32:327-361.
Winfree AT. The electrical thresholds of ventricular myocardium. J Cardiovasc Electrophysiol 1990;1:393-410.
Beeler GW, Reuter H. Reconstruction of the action potential of ventricular myocardial fibres. J Physiol 1977;268:177-210. Ebihara L, Johnson EA. Fast sodium current in cardiac muscle. A quantitative description. Biophys J 1980;32:779-790.
Luo CH, Rudy Y. A model of the ventricular cardiac action potential
- depolarization, repolarization, and their interaction. Circ Res
1991;68:1501-1526.
Peaceman DW, Rachford HH. The numerical solution of parabolic
and elliptic differential equations. J Sot Indust Appl Math
1955;3:28-41.
Rush S, Larsen H. A practical algorithm for solving dynamic membrane equations. IEEE Trans Biomed Eng 1978;BME-25:389- 392.
Victorri B, Vinet A, Roberge FA, Drouhard J-P. Numerical integra-
tion in the reconstruction of cardiac action potentials using
Hodgkin-Huxley-type models. Computers in Biomed Res
1985;18:10-23.
1311 AIanis J, Benitez D. Transitional potentials and the propagation of impulses through different cardiac cells. In: Sano, T, Mizuhira, V,
Matsuda, K eds. Electrophysiology and Ultrastructure of the Heart.
V.G. Fast, A.G. Kk%er/ Cardiocascular Research 30 (1995) 449-459 459 [32] Bukauskas FF, Sakson MY, Kukushkin NI. Discrete zones of the
electrical connexion of Purkinje terminals with muscle fibres in the canine ventricle. Biofizika 1976;21:887-892.
[33] Joyner RW. Effects of the discrete pattern of electrical coupling on propagation through an electrical syncytium. Circ Res 1982;50:192- 200.
[34] Kldber AC, Riegger CB. Electrical constants of arterially perfused rabbit papillary muscle. J Physiol (Iand) 1987;385:307-324. [35] Rudy Y. Quan W. A model study of the effects of the discrete
cellular structure on electrical propagation in cardiac tissue. Circ Res 1987;61:815-823.
[3h] Kltber AG, Riegger CB, Janse MJ. Electrical uncoupling and in-
crease of extracellular resistance after induction of ischemia in
isolated, arterially perfused rabbit papillary muscle. Circ Res
1987;61:271-279.
[?7] Fast VG. K16ber AG. Current-to-load mismatch in Purkinje-muscle
j”f”f ion: evaluation of critical fiber diameter by 2-dimensional simulation. Circulation 1991;84(suppl II):II-325 (abstract). [38] Clerc L. Directional differences of impulse spread in trabecnlar
muscle from mammalian heart. J Physiol (Lond) 1976;255:335-346. [39] Glomset DJ, Glomset ATA. A morphology study of the cardiac
conduction system in ungulates, dog, and man. Am Heart J 1940;20:677-701.
[40] Weidmann S. The electrical constants of Purkiqe fibres J Physiol (Land) 1952;118:348-360.
[41] Weidmann S. Electrical constants of trabecular muscle from matn- malian heart. J Physiol (Land) 1970;210:1041-1054.
[42] Tranum-Jensen J, Wilde AAM, Vermeulen JT, Janse MJ. Morphol-
ogy of electrophysiologically identified junctions between Purkinje
fibers and ventricular muscle in rabbit and pie hearts. Circ Rcs 1991;69:429-437.