Determination of Mica Cell Parameters by
X-Ray Powder Diffractometry — A Case Study
By W. B. Stern
Geochemkal Laboratory, Institute for Mineralogy and Petrography, Basel University, Berrwidlistrasse 30, CH-4056 Basel, Switzerland
Abstract
Possibilities and restrictions of least-square methods for mica cell refinement are briefly described. If diffractometric raw data are precise and accurate, and if geometrical errors are properly corrected, a cell refinement (determination of ao, D
o> c0, P) can be carried out rapidly, but the reliability of ob-tained data has to be evaluated carefully.
Introduction
Mica is a common rock-forming mineral; its potential chemical variation is an intensely studied petrologic topic e.g. as a clue to physical conditions of metamorphic rock genesis (Bailey, 1984; Frey el al, 1983). Because a strong interdependence of mica cell parameters and crystal chemis-try is assumed, and because Mg,Fe/Al substitution in mica is believed to be connected with physical conditions (pres-sure, temperature) of mica formation, X-ray powder dif-fractometry is a generally adopted method of investigation (Guidotti and Sassi, 1986).
A critical examination of literature data (Naef and Stern, 1982) shows, however, that either certain published data seem to be erroneous, or certain critical factors controll-ing cell determination were disregarded thus far. Indeed, several difficulties arise at different stages of investigation: • Grinding the mineral may induce a partial lattice
destruc-tion.
• The flaky shape of many sheet silicates causes strong ori-entation effects in powder X R D .
• Measurement of the Bragg angle 20 has to be executed very carefully in terms of precision and accuracy. • The mineral species, its crystal symmetry, and
approx-imate cell data have to be known a priori.
• The specimen should consist of one single phase only. A number of specific preparation techniques have been proposed in order to reduce orientation effects (Blount and Vassiliou, 1979). One common procedure combines a Guinier exposure for ao and b0 determination and diffrac-tometry for measurement of co. Sometimes, however, all cell constants are determined by diffractometry. Single crystal diffractometiy — as a measurement method — is seldom applied, for it is time-consuming and concerns individual mica crystals only, not a bulk sample.
In 1963 a least-squares method for general cell param-eter dparam-etermination and indexing by X R D was proposed and was later updated (Appleman and Evans, 1973). This ap-proach is currently used in many computer-based commer-cial diffractometers as a part of the integrated software package. This promising and widespread cell refinement technique has not been applied critically in mica determina-tion; a data bank based literature search (Physical Briefs, Georef, Chemical Abstracts) did not reveal any signficiant citations for the past 10 years. Therefore, an attempt has been made to use critically the Appleman/Evans refinement technique to investigate a series of mica specimens, ex-tracted from rocks of different origins. Details of crystallo-graphic and chemical data will be published elsewhere.
Evaluating Optimal Refinement Conditions
Calculated powder diffraction data [e.g. taken from Borg and Smith (1969)] are particularly useful for evaluating op-timal refinement conditions:
• d-values contain virtually no experimental error
• Miller indices are known and can be introduced into the refinement routine.
• The result is known; thus it is possible to control certain variables, like cell parameters and error tolerances, as starting points for refinement.
For all preliminary evaluations the same set of data was used (2Mj muscovite), namely
• 29 of the strongest reflections in the 20 range of 8 to 78°. • 3 reflections were a priori indexed ( - 114), (025), (0 0 10). • Crystal class, extinction conditions, angle p.
The starting values for refinement (a, b, c) were chosen close to the true cell data: differences not exceeding 0.1 to 0.2 A, error tolerances according to recommended values.
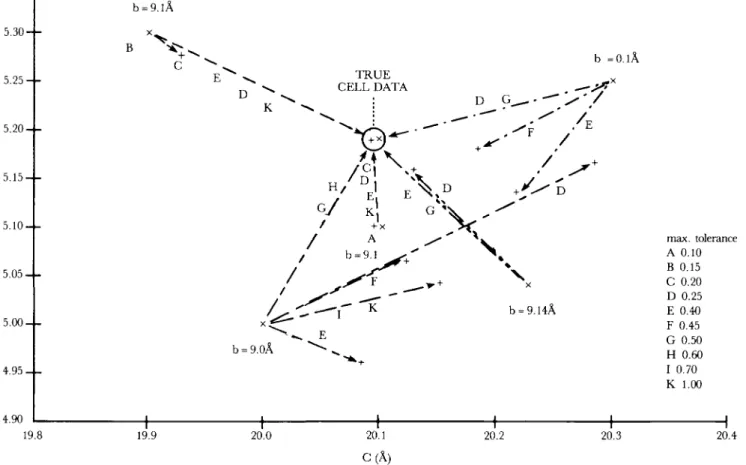
As can be seen from Figure 1, correct results were ob-tained when the starting point was quasi-identical to true data. If, however, starting points are not close (±0.1 A), true data are only found using a specific error range: either too small or too large error tolerances may lead to entirely erroneous cell parameters. An optimal error tolerance seems unpredictable; thus, even optimal raw data may produce ambiguous results.
The first intrinsic source of error: Sample Geometry
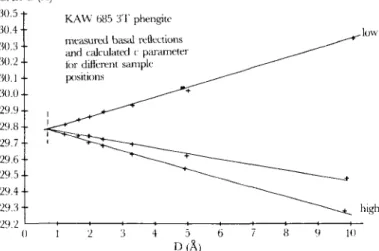
When experimental data (and not calculated d's like those in the above mentioned case) are processed, the ambiguity of the results will tend to increase. The first intrinsic source of error has to do with sample geometry: depending on grain size, surface morphology or specimen alignment, the reflect-ing crystal planes may be out of the X-ray optical focus. Because a slight geometrical aberration causes measurable deviations of the observed d-values, especially at low 0, either a mechanical specimen alignment (Smith and Leider, 1968), or an individual mathematical correction has to be done for every sample measurement. The usual software routine (0 calibration) does not help properly, for the actual geometric correction varies from one sample to the next, as routine measurements on series of samples clearly indicate. A common solution to this problem is the addition of an in-ternal standard to the sample powder, which is then con-taminated so that further examination on this subsample may be restricted. Internal standards may display either many reflections and thus provoke undesired interferences, or only a few reflections, therefore being unsuitable for the entire range of measurement because the Ad/d relationship is non-linear (Figure 2a). Fortunately, sheet silicates with their dominant basal reflections allow a very simple and ef-fective correction procedure: after a plot of all calculated c-parameters of a given specimen against their respective d's, an extrapolation towards a Bragg angle of 18O°20 is possi-ble, where a geometrical error is zero (angle between pri-mary X-ray beam and sample surface = 90°, angle between
249 Powder Diffraction, Vol. 2, So 4, December 1987
. https://doi.org/10.1017/S0885715600012896
A (A) 5.35 5.30 • 5.25- 5.20- 5.15- 5.10- 5.055.00 -4.95. 4.90 = 9.lA
x Starting point for refinement/regression + Result of refinement/regression b =0.lA = 9.14A b = 9.0A max. tolerance A 0.10 B 0.15 C 0.20 D 0.25 E 0.40 F 0.45 G 0.50 H 0.60 I 0.70 K 1.00 19.8 19.9 20.0 20.1 C(A) 20.2 20.3 20.4
Figure 1. Least-squares refinement on recalculated powder data (2Mj muscovite, Borg and Smith, 1969). Same set of 29 d-values, (3 indexed) may either lead to correct cell values, or to wrong ones when error tolerances are slightly varied.
diffracted X-ray beam and sample surface = 90°). Thus, without an internal standard, and without a mechanical specimen alignment, the true c for every specimen can still be found by extrapolation. Calculating back the difference between observed and true d for every basal reflection, Ad (A) for the entire range of measurement can be plotted (Figure 2b), and a correction term Ad be found for every reflection. This correction term is expectedly large for low 6 angles, low for high angles, and is, of course, different from one specimen to another. If the same specimen is placed at slightly different heights (ca±0.1 mm) in the sample holder, the influence of sample geometry on measured d's, and the effect of the described correction procedure can be demon-strated clearly (Table 1).
The second source of error: Data Reduction
A second source of error is data reduction. According to details of on-line reduction routines, a weak reflection may be suppressed, or a strong one may be interpreted as super-position of several — perhaps too many — individual re-flections. Every diffractogram should therefore carefully be compared with the data of the reduction routine used. At the same time, the specific mica polymorph should be deter-mined, as well as the presence of any second mineral phase. A manual, off-line evaluation of the diffractogram would give poor results, because a correct Ka2 elimination is difficult. The precision of a 29 measurement should be in the order of ^O.O2°20 which is only possible when ap-propriate software for data reductions is used.
Table 1.
Mica Mounted at Varying Height in Sample Holder of Diffractometer.
Sample: phengitic mica 3T, KAW 685
Observed peak position without d-correction Setting
High Medium Low
20 A 26 A 29 A
23.12 3.844 22.88 3.884 23.09 3.849 31.25 2.860 30.95 2.887 31.20 2.864 42.39 2.131 42.17 2.141 42.35 2.132
Recalculated data after d-correction 3.866 3.860 3.863 2.871 2.876 2.872 2.137 2.136 2.136 Measured reflection (hki) 1 0 4 1 08 1 1 8 1 0 4 1 0 8 1 1 8 D-variation due to ±O.O2°20
(A)
0.00328 0.00178 0.00096 d{k) 3.863 ± 0.003 2.873 0.002 2.136 0.0003Powder Diffraction, Vol. 2, No. 4, December 1987 250
. https://doi.org/10.1017/S0885715600012896
DELTA D (A) GAL 30.530.4 30.3 30.2 30.1 30.0 - 29.929.8 - 29.729.6 - 29.5- 29.429.3 -29.2 C(A) 0 KAW 685 3T phengite measured basal reflections and calculated < parameter ior different sample positions
D(A)
10
Figure 2a. Effect of sample alignment on peak position: measured basal reflections and calculated c parameter for different sample positions. At high angles 20 (low d-values) TTkusurement errors due to specimen misalignment become negligibly small.
d - correction terms tor different sample positions in specimen holder
-0.05
2.0 3.0 D(A)
2b. Using basal reflections, the difference between measured d and true d can be deter-mined for the entire range of measurement, and for each sample/run.
The third source of error: Allowable Choke of Programming Parameters
A third source of error is the choice of program parameters allowed by the software when performing a least-squares refinement:
• When the initial cell parameters — as a starting point for refinement — are too far off from the true parameters to be found, the result will most probably be erroneous. The number of rejected (i.e. not properly fitted) reflections will be large (30 to 50% or more of given d's). Because the true parameters are not known a priori, optimal settings for starting points and error tolerances are not known either. • When certain reflections are intially indexed and one was
erroneously selected or when a second (unidentified) phase is present.
• When the number and/or quality of given d's is insufficient. Evaluating Refinement Data
Because any given set of reflections may produce different cell parameters when input parameters to the least-squares procedure are varied, an ambiguity results in how to dis-tinguish the true cell values from incorrect ones. In order to
• The author is highly indebted to Dr. Henke of Karlsruhe Technical High School for his effort and indispensable support.
evaluate this uncertainty, two samples consisting of several mica flakes were studied independently by single crystal dif-fractometry*. The results are plotted in Figure 3: single-crystal and powder data correspond well when the respec-tive statistical error is considered. Whether 3 or 9 reflections out of 25 to 35 are initially indexed, the result remains the same, but the number of iterations may increase, whereas the percentage of rejected (not fitted) reflections decreases. One may conclude that the smaller the difference is between results obtained on 3 preset hkis vs 9 preset hkis, the better the final results are.
A second, but weaker criterion for evaluating refine-ment data is the number of rejected (not properly fitted) reflections; this figure is influenced by the selection of ap-propriate reflections taken for a least-squares refinement. Generally, there must be linearly independent reflections numbering at least 4 to 5 times the number of crystallo-graphic parameters to be refined, i.e. 16 to 20 at least for a monoclinic mineral with its 4 dimensions ao, bo, co and fi. Reflections with d between 1.5 and 4 A are most suitable, provided they are strong and uniquely defined. At larger angles of 20, the ambiguity of indexing increases and the reflections are thus less suitable though their counting statistics may still be acceptable when modern, sensitive equipment is used. 9.26 -p 9.25 . . 9.24 -9.23 •• 9.22 -9.21 •• 9.20
X single crystal diilractometry ( T H Karlsruhe GFR) Y powder diflractometry (this paper) 20.22 20.26 20.20 3a. 2Mj bmtite
Figure 3. Companion of powder data and single-crystal data obtained from micas.
20.24 CO(A) 20.28 3b. 3T A, Bo 5.23 -| 5.22 5.21 -(A) Y X Y y
single crystal dillractometrv (TH Karslruhc. GFR) powder diilractometry (this paper)
f
-t ^ 29.80 C (A) 29.85251 Powder Diffraction, Vol. 2, No. 4, December 1987
. https://doi.org/10.1017/S0885715600012896
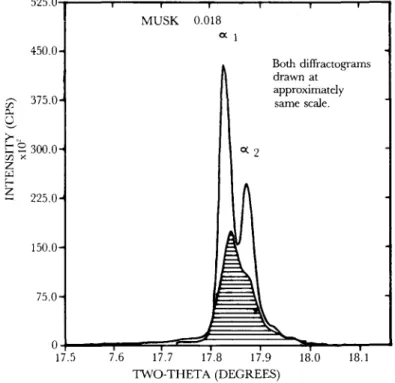
525.0 Both dmractograms drawn at approximately same scale. 0 17.5 7.6 17.7 17.8 17.9 TWO-THETA (DEGREES)
Figure 4. Comparison of two XRD equipments in terms of resolution and line intensity. Same single-crystal (2Mj muscovite) was measured under same excitation conditions and optimal slit configurations.
Quality of resolution and line intensity depends largely on the type of apparatus, as can be demonstrated by measuring the same specimen under comparable conditions with two different diffractometers (Figure 4). The (004) reflection of a single crystal (white 2Mj mica) displays clear-ly Kaj and Ka2 when modern equipment is used, whereas only one single, relatively weak peak can be seen when an old diffractometer is used.
Summary
Data acquisition is fast and reliable in terms of precision and accuracy if a suitable specimen is measured on suitable equipment following a suitable routine. Even when mea-surement errors (due to sample misalignment) are properly corrected, a cell refinement with the Appleman/Evans least-squares technique may produce ambiguous crystallographic data in case of low-symmetry minerals, like monoclinic mica. Experimental data on powder and single-crystals from the same specimens agree well
• When all unambiguous reflections are fitted (no rejec-tions) and properly indexed.
• When the number of iterations necessary for refinement is small, <10.
• When the results remain the same regardless of the num-ber of initially given (preset) Miller indices.
• When the initially given starting parameters for ao, bo, co and ft are close to the true data (estimated acceptable dif-ference e.g. for bo in the order of 0.02 A).
One has to assume, however, that in practice incorrect refinements are not easily detected. Though the Appleman/ Evans least-squares procedure offers an interesting tool in powder diffractometry, utmost care has to be taken by criti-cally evaluating the results. In fact, controlling refinement data is much more time-consuming than measuring speci-mens and processing raw data.
Finally, one may state (as one of the reviewers put it): "There is one and only one correct answer and it is the users' responsibility to locate it"!
Acknowledgement
For critical reading and useful comments the author is in-debted to: Prof. M. Frey, Dr. Isenberg, Dr. H. H. Klein, Prof. H. Schwander.
References
Appleman, D. E. and Evans, H. T. Jr. (1973). Indexing and least-squares refinement of powder diifraction data. Report PB 216188, U. S. Depart, of Commerce, National Technical Information Service, 5285 Port Royal R d , Springfield, VA 22151.
Bailey, S. W., ed. (1984) Micas. Reviews in Mineralogy, vol. 13. Washington, DC: Min. Soc. America.
Blount, A. M. and Vassiliou, A. H. (1979). A new method of reducing preferred orientation in diffraction samples. Am. Mineral. 64, 922. Borg, I. Y. and Smith, D. K. (1969). Calculated X-ray powder patterns for
sth-cate minerals. Mem. 122. Boulder, C O : Geol. Soc. Am.
Franz, G., Hinrichsen, T. and Wannemacher, E. (1977). Determination of the miscibility gap in the solid solution series paragonite-margarite, by means of infrared spectroscopy. Contnb. Mineral. Petrol. 59, 307. Frey, M., Hunziker, J. C , Jager, E. and Stern, W. B. (1983). Regional
distribution of white K-mica polymorphs and their phengite content in the central Alps. Contrib. Mineral. Petrol. 83, 185.
Guidotti, C. V. and Sassi, F. P. (1986). Classification and correlation of metamorphic fades series by means of muscovite bo data from low-grade
metapelites. Neuesjahrb. Mineral. 153 Abh., 363.
Naef, U., and Stern, W. B. (1982). Some critical remarks on the analysis of phengite and paragonite components in muscovite by X-ray diffrac-tometry. Contrib. Mineral. Petrol 79, 355.
Smith, D. K. and Leider, H . R. (1968). Low-temperature thermal expan-sion of LiH, M g O and CaO.J. Appl. Crystollogr. 1, 246.
Appendix
Analytical conditions
Equipment
Diffractometer Siemens D-500
Variable aperture, secondary monochromator. No primary filter
Microcomputer DEC PDP 11/23 +
2 hard discs (10 Mb), 1 Winchester (30 Mb)
Measurement
Excitation Cu tube 40 kV 30 mA
Divergence 1,1° entrance; 1, 0.05° secondary Scan 1°20 per minute, increment O.O2°20
Software
Diifrac-11 Siemens
Measurement Pgms EDM, D P M Data reduction ADR
Refinement APPLE
d-correction off-line, as described in text
Sample
50 to 200 mg powdered mica, mechanically extracted from mother rock; or powdered megacrysts from pegmatites Specimen holder 20 mm <|>, spinner
Received March 9, 1987 Revised July 22, 1987 Accepted July 25, 1987
Powder Diffraction, Vol. 2, No. 4, December 1987 252
. https://doi.org/10.1017/S0885715600012896