RESEARCH OUTPUTS / RÉSULTATS DE RECHERCHE
Author(s) - Auteur(s) :
Publication date - Date de publication :
Permanent link - Permalien :
Rights / License - Licence de droit d’auteur :
Bibliothèque Universitaire Moretus Plantin
Institutional Repository - Research Portal
Dépôt Institutionnel - Portail de la Recherche
researchportal.unamur.be
University of Namur
Challenges and Opportunities of Field-based Data Collection with a Game
Henriet, Elisabeth; Burnay, Nathalie; Dalimier, Joséphine; Hurley, Jaycel; Henry, Sabine
Published in:BMS Bulletin of Sociological Methodology/ Bulletin de Methodologie Sociologique
DOI:
10.1177/0759106320960885 Publication date:
2021
Document Version Peer reviewed version
Link to publication
Citation for pulished version (HARVARD):
Henriet, E, Burnay, N, Dalimier, J, Hurley, J & Henry, S 2021, 'Challenges and Opportunities of Field-based Data Collection with a Game: Analysis of the Development and use of a Game to Collect Data on People’s Emotional Experience in their Environment', BMS Bulletin of Sociological Methodology/ Bulletin de Methodologie
Sociologique, vol. 149, no. 1, pp. 7-29. https://doi.org/10.1177/0759106320960885
General rights
Copyright and moral rights for the publications made accessible in the public portal are retained by the authors and/or other copyright owners and it is a condition of accessing publications that users recognise and abide by the legal requirements associated with these rights. • Users may download and print one copy of any publication from the public portal for the purpose of private study or research. • You may not further distribute the material or use it for any profit-making activity or commercial gain
• You may freely distribute the URL identifying the publication in the public portal ?
Take down policy
If you believe that this document breaches copyright please contact us providing details, and we will remove access to the work immediately and investigate your claim.
Implementations
Challenges and
Opportunities of Field-based
Data Collection with a Game.
Analysis of the Development
and use of a Game to Collect
Data on People’s Emotional
Experience in their Environment
Elisabeth Henriet
Department of Geography and Transitions Institute, University of Namur, Belgium
Nathalie Burnay
Department of Political, Social and Communication Sciences and Transitions
Institute, University of Namur; Institute for the Analysis of Change in
Contem-porary and Historical Societies (IACCHOS), UCL, Namur, Belgium
Jos ´ephine Dalimier
Department of Geography and Transitions Institute, University of Namur,
Belgium
Jaycel Hurley
University of the Philippines Population Institute, Philippines
Sabine Henry
Department of Geography and Institute of Life, Earth, and Environment (ILEE),
Namur, Belgium
Corresponding Author:
Elisabeth Henriet, Department of Geography, University of Namur, 61 Rue de Bruxelles, 5000 Namur, Belgium Email: [email protected]
Bulletin de M´ethodologie Sociologique 1–23
ªThe Author(s) 2020 Article reuse guidelines: sagepub.com/journals-permissions DOI: 10.1177/0759106320960885 journals.sagepub.com/home/bms
R ´esum ´e
Collecter des donn ´ees sur le terrain avec un jeu de soci ´et ´e: difficult ´es et opportunit ´es. Analyse du d ´eveloppement et de l’utilisation d’un jeu pour collecter des donn ´ees sur l’exp ´erience ´emotionnelle des individus dans leur environnement. Les auteures ont d´evelopp´e et utilis´e un jeu de soci´et´e (Tigo-Tigo) pour
collecter des donn´ees sur l’exp´erience ´emotionnelle des individus dans leur environnement dans une r´egion touch´ee par un typhon aux Philippines. Dans le but d’encourager l’utilisation des jeux pour la collecte de donn´ees sur le terrain, elles fournissent une analyse d´etaill´ee de toutes les ´etapes du processus, du d´eveloppement `a l’exp´erience du jeu et `a la qualit´e des donn´ees produites. La conception d’un jeu pour collecter des donn´ees revient `a cr´eer une exp´erience immersive qui am`ene les individus `a partager des informations avec les chercheurs. Malgr´e le d´efi que son d´eveloppement implique de par l’exigence de respecter `a la fois les conditions n´ecessaires `a la collecte de donn´ees et `a l’exp´erience du jeu, Tigo-Tigo a r´eussi `a produire des donn´ees complexes et une exp´erience positive. En suivant ses r`egles simples, les personnes interrog´ees ont ´et´e amen´ees `a formuler et `a partager des donn´ees `a la fois quantitatives (force de l’´emotion) et qualitatives (explications sur les associations entre ´emotion et environnement). De plus, le jeu ´etait motivant et changeait le statut de la participation (les personnes sond´ees se retrouvent en position de pouvoir grˆace `a la dis-tribution des r ˆoles dans le jeu). Enfin, sa structure interactionnelle particuli`ere a ´egalement am´elior´e la qualit´e des donn´ees produites en r´eduisant les attentes envers les chercheurs ainsi que les barri`eres culturelles et linguistiques rencontr´ees sur le terrain.
Abstract
The authors developed and used a game (Tigo-Tigo) to collect data on people’s emotional experience in their environment in an area hit by a typhoon (Philippines). With the aim of encouraging the use of games for data collection in the field, they provide an in-depth analysis of all phases of the process, from the game development to the experience of the game sessions and the quality of the data produced. Designing a data collection game is creating an immersive experience that get people to share information with the researcher. However challenging to develop as it has to meet both data gathering and game requirements, Tigo-Tigo successfully produced complex data and a positive experience. By following its simple rules, the respondents were led to formulate and share both quantitative (emotion levels) and qualitative (explanations for emotion-environment associations) data. Moreover, the game was motivating and changed the status of participation, as the researchers played with the respondents in an inversed power setting. Finally, its particular interactional structure also improved the quality of the data produced by reducing expectation as well as cultural and translation barriers encountered in the field.
Mots cl ´es
collecte de donn´ees, ´emotions, environnement, jeu de soci´et´e, ludification, terrain, typhon
Keywords
data collection, emotions, environment, field, game-based methods, gamification, typhoon
Introduction
While games are popular in education because of their motivational and simulation potential (see for example Costanza et al., 2014; Duval et al., 2017; Garris et al., 2002; Hertzog et al., 2014; The Thiagi Group, 2019), their specific structure is also exploited for data collection.
Most game-based methods are used in research to collect data from large online populations (Gundry and Deterding, 2019). In field-based research, serious games are developed to simulate real life systems (Costanza et al., 2014). For example, TerriStories is a game used as a participatory research tool (CIRAD, 2018). It simulates the man-agement of a territory and its natural resources. Its particularity is to integrate the expertise, knowledge, experience, views and values of different stakeholders on the same level. By playing the game, solutions for a particular territory emerge and the players learn together. Another example is the proposition of Costanza et al. (2014) to use a game to evaluate the value of ecosystem services. The game would simulate or model a system integrating human behaviour and ecosystem responses. The objective of the game would be for the players to create their ideal world. Players would both learn ecosystem functioning through the game and make decisions. The players’ trade-offs decision are considered by the authors as a valuable source of data for the evaluation of ecosystem services.
The game may thus be used as an alternative data collection tool, one of its particu-larity being the way the respondent is led to formulate and share information. In those examples, instead of asking the respondents to formulate an integrative set of political solutions for a territory or to evaluate ecosystem services values, they are guided through the game to do so. Researchers using games in the field actually introduced a new way of surveying which draws attention on the interactional structure of the data collection moment and enables the collection of complex data.
What Type of Activities are Considered as being Games?
A game is a goal-oriented activity that proceeds according to rules that limit players (Costikyan, 2002). It is through the rules and the goal that the game structures the actions and decisions of the players during a game session. A small change in the structure of the game breeds a big change in the players’ behaviour. Secondly, the game is an artificial activity. In other words, game structures create their own meaning (e.g. Monopoly (Magie, 1935) bills cannot be used outside of the game structure). Moreover, players must ‘enter’ this activity voluntary. Indeed, ‘the basic transaction we make with games is to agree to behave as if achieving victory is important, to let the objective guide our behaviour in the game. There’s little point, after all, in playing a game without making that basic commitment’ (Costikyan, 2002). In general, games involve competition among players, but some games are cooperative. In those cases, the tension comes from the struggle of the players to achieve a certain situation together while adversity ema-nates from the game itself. Simulation games as presented in the introduction of this article are mostly cooperative: players interact to achieve a common goal. Both com-petitive and cooperative games involve decision-making: players will make decisions
through the game in order to achieve victory, and rational players seek to exploit the structure of the game to achieve their goals. Finally, games are generally associated with fun. Costikyan (2002) highlights the importance of the pleasure people have when playing that results in the compelling aspect of a game.
In this article, we present a data-collection game named Tigo-Tigo.1The research takes place in Guiuan (The Philippines), an area hit by a super-typhoon in 2013. This game has been developed for collecting data on the impact of the typhoon, through the lens of people emotions in their environment. It has been designed as an alternative to an interview or a questionnaire.
The Potential of the Game to Collect Data in the Field vs Interviews and
Questionnaires
The main purpose of the game designer is to create an experience (Schell, 2008) – understood as something that happens to you and affects how you feel (Cambridge Dictionary, Cambridge University Press, 2019). Games are the means to that end. On the contrary, interviewers and enumerators create experiences, but their purpose is to record information that will be used to describe and understand reality. As a conse-quence, the experiences are the means to data collection. That difference constitutes both the main opportunity and the main challenge in collecting data with a game.
The challenge consists of producing valid data with the game. Indeed, games may be very artificial and disconnected from reality. On the other hand, the opportunity resides in the fact that games offer a lot of possibilities to innovate in the way respondents are led to share information, in a variety of data-collection games configurations. In turn, games provide new possibilities in terms of study object, complexity, and format of the data produced. Further, games include characteristics of both interviews and questionnaires. On one hand, it is an icebreaking activity and a mean to launch a conversation about its content and other subjects. On the other hand, it has similarities with questionnaires as it includes decision making, rules and systematism. Games are thus adapted to collect mixed data – both qualitative and quantitative.
Researchers have a long tradition of reflexivity on the experience of the data collec-tion process and the way it condicollec-tions the data collected (e.g. power imbalances between the researcher and the researched) (Cloke et al., 2004; Cefaı¨, 2010). Questionnaires for example may be thought to present bias-free answers, mostly in the case of straightfor-ward factual data. However, face-to-face surveys are at risk of social desirability responses, biases due to the interviewer characteristics, etc. Knowing that the interac-tions between the researcher and the researched may influence both the content and the quality of the data, the game is worth being explored as an alternative to questionnaires or interviews as it is immersive and it brings the stakeholders to let go of the research context.
Further, while questionnaires and interviews use direct means to bring out the data, information is produced in an indirect fashion in the case of games. Researchers willing to use a game as an alternative to an interview or a questionnaire must question the ‘gates’ between the game and the empirical world over which data needs to be collected. For example, Pictionary (Angel, 1985) could be used to elicit the main features people
associate to certain jobs. The game mechanics would be used as following: ‘jobs’ are to be guessed, and players are constrained through the rules in a way that lead them to draw the main features of jobs. Some specific game mechanics appear particularly adapted as they encourage true story-telling (as in ‘truth or dare’), or are based on the players’ common history (as for most guessing games), or do reward the quality of the answers (as in games including a quiz like Trivial Pursuit (Abbott and Haney, 1982) and Pictionary (Angel, 1985)).
Producing a ‘let it go’ effect and using indirect ways to elicit the answers may higher the validity of the produced data. In addition, when designing a questionnaire, surveyors must pay attention to its length, dullness and complexity. Ultimately, the challenge is to maintain the motivation and attention of the respondent and collect well thought through answers. As games are compelling in principle, they offer new potentials in terms of length of the data collected.
Finally, construction – piloting and improvement of the activity and the questions – is a main challenge in the development of a data gathering tool. Using a game to collect data is even more challenging as it requires a high level of understanding of game structures and mechanics. To improve a game, the behaviour of the players must be analysed carefully together with the quality of the produced data. It is a constraint: some elements/steps unrelated to the research objective will be added to improve the game experience. It may be seen as a strength: the quality of the game experience serves as an indicator for both the interactional structure of the activity and the quality of the data produced.
This article presents the challenges and opportunities in the design and use of a game to collect data. For that purpose, we first contextualize and discuss the motivations to create Tigo-Tigo. Secondly, we expose both the development phase and the operationa-lizing phase of our data collection with the game. Finally, we discuss the achievements of our game based on the various aspects addressed throughout the article.
Motivations to Create a Data-collection Game
Our research aims to investigate a new way of quantifying an environmental phenom-enon within the wider context of people emotional experiences in a post-disaster area. Concretely, the study seeks to describe the link between a super typhoon and people emotions in their environment three years after the area was hit by the super typhoon.
Translating the Emotional Experience in the Environment into Quantitative Data
There is no consensus about how and under which format data on emotions should be collected. Collecting quantitative data on emotions in itself might be a source of criti-cism. Emotional geographers suggest that emotional geographies shouldn’t be defined in such ways that ‘they might become mere objects of quantification, comparison and manipulation’ (Smith et al., 2009: 6). Instead, ‘the phenomenal experiences of emotions are the starting point for most researchers’ (Smith et al., 2009: 7). On the other hand, many psychologists and other researchers focussing on emotions showed the relevance of measuring them either via questionnaires or via biological measurements apparatus
and observations (Nold et al., 2004; Rim´e, 2005). Respondents may for example be asked to identify the level of the emotions they experienced in various contexts (Kahneman, 2000; Cl´ement and Sangar, 2018).
Emotions happen at a certain moment in a certain place. Kahneman (2000) highlights the differences between a memory-based approach based on the subject’s retrospective evaluations of past episodes and situations, and the moment-based approach that is based on real-time measures. He rightly points that the moment-based approach is more valid than the memory-based approach. Because this research has been conducted few years after the disaster, the timeframe of the research allows only the retrospective evaluations of past episodes and situations. To add in complexity, the link between emotions and the environment is not as straightforward as the link between a certain lived situation and emotions. Finally, quantitative data are known to lack in explanatory penetration (Cloke et al. 2004: 128). To fully encircle the subject, qualitative data needed to be collected together with the quantitative material.
The Main Difficulties of the Surveying Context
The research field is located in the Philippines, in an area that was hit by typhoon Haiyan in 2013, one of the biggest typhoons to make landfall in recent history (NASA Earth Observatory, 2013). After they lost almost everything, people received an enormous amount of international attention: NGO’s and governmental organizations flew in to help locals to deal with the emergency. Given this context, local people have been used to expect material and immaterial help of any kind from foreigners who visit them. Expectation from the respondents was rapidly identified as a potential source of distor-tion in the data collecdistor-tion. Also, research is widespread in the area and people may be tired of being interviewed, used to it and rapidly bored during the survey. Some respon-dents may have developed their own responsive strategies. Cloke et al. (2004) speak of ‘survey fatigue’. Finally, many respondents seemed to be intimidated by the presence of a ‘white’, ‘foreigner’, and English speaker. More generally, the relationships between the researcher and the researched was hindered by power imbalance and cultural barriers.
A first fieldwork experience took place in the study area, one year before the game fieldwork, including a couple of interviews. People were asked about the elements of the environment and of their life that were meaningful to them, suggesting particular build-ings, the sea, NGO’s, their relationship, the house, etc. and they pointed some elements telling why it is important. For example:
Trees are important to us because it makes the temperature cool, nature is important to us. (Translation based on the record of the interview)
A local teacher was hired as translator during the interviews. The translating wasn’t always accurate. Regarding the trees:
She said that nature is important because here if it is night, ano ka pa it tawag hiton? Taghom? (Translation during the interview)
It has been later translated by someone else as:
She said that nature is important because if it’s night, how do you call that? Cool? (Trans-lation based on the record of the interview)
The face-to-face translator lacked vocabulary (‘Taghom?’) and added some own interpretations (‘if it’s night’) to the respondents’ answers, which rendered the interviews very difficult to conduct.
Expectations in Using a Game to Collect Data
Given the specificities of the aimed data and of the research context, we came up with the idea of the data gathering as an activity which the respondents could appreciate in itself. Collecting data with a tool as the game would foster the immersion of the participants and improve the retrospective evaluations of emotional experiences.
That activity would guide the respondent to the answers indirectly instead of asking them straightforwardly, lowering the obstacle related to the translation and to the abstract nature of the study object. The data quality would also be optimized by improving the connections between the participants. Indeed, the particular interactional structure of the game was expected to lower cultural barriers as well as the biases due to expectation, survey fatigue and power imbalance. The game was also expected to create dialogue and explanations and it was therefore adapted to the collection of mixed (quantitative and qualitative) data.
A game was thus developed to collect reliable quantitative and qualitative data on the respondent’s emotional experiences in the environment in the aftermath of a super typhoon.
Developing Tigo-Tigo: A Game to Collect Data on People
Emotions Related to their Environment
Before describing the development phase of Tigo-Tigo, its principles must be outlined.
Delineating Tigo-Tigo
As explained above, the challenge for the researcher is to arrange game elements in a way that meets the basic criteria of reliable data gathering methods, without losing sight on the characteristics necessary for the game to be a game. To fulfil this objective, the following constraints were fixed as guidelines in the development of the game:
[1] The data-collection game is really a game. In order to call it a ‘game’, we had to create a
real game, not to hide a data gathering process in something that looks like a game. In that purpose, game mechanics that make it being fun and compelling had to be integrated into the game. It also had to include basic characteristics such as: it is a goal-oriented activity, a contest that involves decision-making and in which the players make the basic
commitment as if achieving victory is important. By doing so, the game fosters immer-sion of the participants and creates the setting to collect high quality data.
[2] The game is a system that leads the respondents to share data. Thorough the game,
people should share information on a very spontaneous, authentic way. The game had to be motivating and make both the interviewer and the interviewee to rapidly feel com-fortable in exchanging about feelings and complex information. In a sense, the game should accompany the emergence of the data to be shared by the respondents.
[3] The game is easy to understand. It doesn’t require long explanations. The purpose is to
create a game that is very accessible to the respondents. Moreover, people should be able to pick and exploit the structure of the game very fast. Complex games tend to gain in interest after they have been played several times while we planned to play our game only once in each household.
[4] The game is developed within an intercultural team and allows direct interaction between the researchers and the researched. Because one of the objective was to lower the cultural
and translation barriers during the data collection activity.
Tigo-Tigo’s Material and Rules
The objective of Tigo-Tigo is to associate pictures of household’s environment with emotions (Figure 1). The pictures of the environment were taken in the three districts under study and in the municipality center. They were aimed to represent elements of the environment classified under three categories: the built elements of the environment, the cultivated non-built elements of the environment and the naturally given non-built elements of the environment.
Tigo-Tigo is a game divided in 3 steps. During the first step, the researchers explain the rules of steps 2 and 3 and then they ask the household couple to choose for 11 pictures among 73 pictures (Figure 1, left): 2 in each category and 5 more across all categories. During the second step, the household head associates one picture with emotions (represented by emoticons, Figure 1, right) and social network (represented by stylized drawings). The emotions are the followings: happy, sad, excited, calm, dominated, dominant, disgusted, afraid, angry and surprised. The social network tokens represent the followings: me alone, in couple/with someone else, with the close family, with the extended family, with friends, with NGO’s, with the priest, with authorities. The amount of emoticons and social network tokens to be associated with one picture is limited by the Velcro-space available at the back of the card.
The third step of the game consists of the household partner and the researchers trying to guess the picture by looking at the emotions and social network the household head associated with it. The third step is timed: the partner and the researchers have to hurry up to choose the card they think is the right one. Steps 2 and 3 are repeated 10 times. The game stops when only one card remains and it is not possible to guess anymore.
The household couple plays against the researchers. It gains 5 points every time only the household partner was able to guess the right card and it gets 3 points every time both
Figure 1. Example of data collected through the game in one household (August 14, 2016) 9
the household partner and the researchers were able to guess the right card. The research-ers only get points when they were able to guess right alone, but in that case they gain 7 points. The winner duo is the one with the highest amount of points at the end.
How Tigo-Tigo was Developed
While the game designer’s task is to be innovative in the conception of new game elements, researchers can merely recombine those elements in order to meet their research criteria. The mechanic of ‘guessing’ has been selected to create Tigo-Tigo. It combines ideas of games such as Compatibility (Browne, 2010), Concept (Rivollet and Beaujannot, 2013), and Dixit (Roubira, 2008) in a certain setting to set up the guessing dynamic of the game. First, players are limited in terms of ‘clues’ to make the others guess. Moreover, the clues are quite abstract and visual: emotions and social networks symbols. Secondly, the objective of the guessing system is not to guess based on a universal description but rather to make use of what players have in common. The ‘guessing’ thus encourages the respondents to associate emotions with pictures in a way that has to be understood not only by themselves but also by their partner. Moreover, guessing games are expected to launch interrogation, discussion, and exchange because it includes a certain level of suspense.
Another ‘gate’ to the empirical world is the use of pictures of the players’ environ-ment, emotions and social network. It was expected to lead the players to make associa-tions concerning their own lived environment rather than imaginary situaassocia-tions or stories. We used landscape analysis techniques to select pictures to be used in the game, as well as interviews of inhabitants in the research field. Photo elicitation is a well-known method to produce data (Glaw et al., 2017; Oldrup and Carstensen, 2012) as well as photo sorting such as the Q-method with pictures instead of quotes (Hawthorne et al., 2008; Milcu et al., 2014). The former is fully open in terms of photo interpretation. Researchers directly investigate what people see in the pictures. The latter is closed: researchers need a high understanding of their field of inquiry to cautiously choose what the pictures display. We had no preconception regarding the interpretation of the pictures and about how emotions relate to the environment (e.g. souvenirs, anecdotal and general feelings, etc.). But the respondents were not fully free in their answers given the game rules and the use of clues (emoticons and social network).
The way of distributing points encourages a certain way of associating pictures with symbols: you want certain people to be able to guess but not all of them. It encourages the respondents to avoid too general emotion-picture associations that the researchers will be able to guess and instead make a more personal association.
The first version of the game included more game phases: both the household and the researchers in turns made the others guess. As the game was too long and the phase when the researchers made the others guess useless in terms of data collection, it has been removed from the final version of the game. To further shorter the game session and make the game even funnier, the guessing was associated with a time limit. This is a game mechanic that is used in many games as in Pictionary (Angel, 1985) for example. Finally, the point system was made of tokens that formed a snake as in Worm Up (Randolph, 1995). Each point gained by a team allows the team to take one token at the
back of the snake and add it to the top of the snake. In this way, the snake goes forward. At the end of the game, the team which snake comes first wins the game. Both the time pressure and the contest with the snake point counting system are not necessary for the data collection but they are a source of fun that is motivating for the players.
Those game mechanics do not have to be explicitly described when the rules are explained to the players. If people want to win, they will discover what is best for them to do: making a personal association of emotions and social network with the pictures. This forces the player to focus on the picture and all the possible feeling experiences that come to mind while looking at the picture, and to share them in the best abstract and simple way . . . and that is exactly the data that we wanted to collect with the game.
The Data Collected and the Experience of the Game Sessions
The game has been played 63 times over 2 months during summer 2016. The respon-dents were sampled in three districts differently hit by the typhoon. Many are fishermen or farmers but not a majority (22%). Young respondents (<35 years old) constitute a quarter of the people with whom the game was played and fifty percent belong to the 35-55 age group. Half of the respondents’ highest educational attainment is elementary school or less.
The data produced during the operationalizing phase of the game is rich and complex. A general picture of their characteristics and potential is dressed below. The next section presents the experiences of the game sessions from both the researchers and the researched perspective.
The Data Collected
The number of emoticons per picture dataset is built on three dimensions: the pictures, the respondents and the emotions. For each intersection of a certain picture, one of the 10 emotions and a household, we collected the number of emoticons which represents the strengths of the emotions; the social network associated with it; and the explanation – if there was one – the respondent gave for this association. Hence, the game provides relevant information such as the most/least chosen pictures, the most/least chosen emo-tion, the pictures mostly related to one emoemo-tion, etc.
Given the game setting, respondents associated a variety of both positive and negative emotions to each picture. For example, figure 1 shows that someone associated happy (1), calm (3), afraid (1) and disgust (1) to a picture of the plaza/basketball court (picture 22). The explanations given by the respondent are: they go to this place with friends and family and that’s why he is happy; he just feels calm; disgust because the election campaign (speeches) happened in that place; he felt afraid during that period because so many could be manipulated by the politicians. For picture 19 – the bridge near the local beach: happy (3) because they go there; he is calm (3) when he is there; excited (1) to breathe fresh air; he is the one who decide (1 dominant) when they go there.
The most chosen pictures refer to the church related to the Sunday Mass; the sea where many go swimming during leisure time and where fishermen work; the coconut trees either broken or not that most related to the typhoon and farming activities; a
picture of a random house to link with their own house; the school; and the market. The pictures mostly related to sadness refer to the typhoon (broken coconut trees; the dam-aged historical church; and a demolished house).
The pictures least chosen either illustrated no clear object to refer to, or were too specific and people were not concerned (a children recreation area that seemed not to be used; a specific industry). A particular case is a picture of the building were coq fighting – which is an illegal activity – takes place. It has only been chosen once and the person said he did not recognize the place. However, people may have avoided the picture because of the illegal character of the activity displayed.
Happy is the most chosen emotion, followed by calm, sad, and afraid. Our variable of interest, the typhoon, was evoked at least once on most pictures. Many expressed neg-ative emotions (e.g. specific souvenirs of the event, the transport terminal that remains non-functional, the meteorological tower that could give bad news, etc.) but also positive emotions (e.g. some buildings were rebuilt and the new version is better than the former one, the plants are growing again, they were happy and calm after the storm, etc.).
We computed the emotions strengths and emotions occurrences differences between when people evoke the typhoon and when they don’t. In general, the numbers show that negative emotions are relatively higher and more often chosen than positive ones. Also, the different areas present specific emotion signatures coherent with the way they have been impacted by the typhoon and with the interdependence people have with their environment. In addition, the fact that both positive and negative emotions were asso-ciated together add nuance and complexity in the quantification of environmental facts. Most interestingly, the variety of effects encourages a non-binary (negative vs positive) approach in the study of the impact of a typhoon on human behaviour. Finally, the explanations inform about the variety of environment-people-typhoon emotional links: related to souvenirs, to the functions of particular elements of the environment, to aesthetics, to the material and the immaterial. Social network categories included NGOs, the priest, and the authorities. We could investigate how the people-environment-typhoon triangle relates to those various stakeholders.
In short, we successfully explored a new way to measure the impact of a typhoon. However, the data gathered may lack in focus as we quantify a large variety of emotional experiences together (souvenirs, judgment, particular and routine activities, etc.). More-over, in some limited cases, people related emotions to the environment but not their environment (e.g. I am happy that people living there own a house where to live); and some emotions linked to their environment were not their emotions (e.g. my son likes to walk there). But the guessing system leads people to select certain parts of their envi-ronment and avoid others, and to select certain experiences with it in particular. As such, the game mechanics – with the specific point system in particular – allow to collect emotional, important and shared experiences in the environment.
The Experience(s) of the Game Sessions
Creating a (positive) experience is one of the main motivations to structure the data collection through a game because it is expected to improve the quality of the data collected. The experience of the game sessions is described both based on the
researchers’ evaluation (at the end of the fieldwork, August 2016) and the respondents’ comments about the game (two years after we played the game with them, summer 2018).
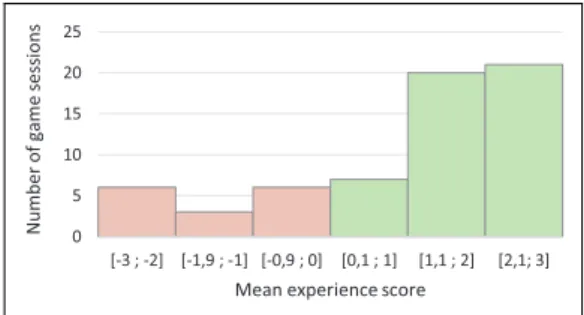
At the end of the fieldwork, after the last game had been played, each of the research-ers who attended the game gave a score ranging from -3 (the game was very unsuccess-ful) to 3 (the game was very successunsuccess-ful) to each of the game sessions. A mean score was computed for each. Two thirds of the 63 game sessions left a positive to very positive feeling to the researchers: 41 game sessions reached a score above 1 (see Figure 2). A minority of games were negatively perceived: 15 games were given a negative score. The most negative game session did actually end up just after the rules had been explained to the respondents: the household head felt uneasy with the activity and did not want to play. Other negative experiences included: playing with a very slow respon-dent while we were very tired; a game with someone who was obviously randomly placing the emoticons on the pictures because he did not understand the purpose of the game; a session during which the wife got angry on her husband; a game with a house-hold head who was half asleep; and a session during which the lady expected a serious research activity and played the game as if she was actually interviewed, making us feel uncomfortable in playing. Some game sessions were really enjoyable: there was com-petition and suspense, complicity within the teams and even between the teams, surprise, and lots of fun. A session with an educated old man was particularly enjoyable because he was able to speak English which allowed a deeper exchange.
When some respondents were asked two years later if they would be willing to play the game again if they were asked to, their answers were generally positive. Someone found it relaxing. They liked the team spirit created by the game and they wouldn’t change anything to it.
Other respondents were less enthusiastic. A respondent seemed to perceive it as a duty, another found the game too long. But someone who was not sure to be willing to play again found it interesting because it initiates reflexivity. Some respondents also evoked the strategy necessary to play well, and would be willing to play again as they better master it after playing once.
Based on both the perceptions of the researchers as those of the researched, we can say that we achieved to create a game which was understandable, immersive and
0 5 10 15 20 25 [-3 ; -2] [-1,9 ; -1] [-0,9 ; 0] [0,1 ; 1] [1,1 ; 2] [2,1; 3] sn ois se s e ma gf or eb mu N
Mean experience score
Figure 2. Evaluation of the experience of the game sessions by the researchers on a -3 to 3 scale
(in the field, after the last game session, late August 2016)
attractive. But the experience of it may vary. Factors influencing the experience of the games are: the willingness to play of the stakeholders and their motivation at the par-ticular moment of the game; their perceived control of the situation, which may be challenged because the activity is not usual; their capacity to pick the mechanics of the game and to develop a strategy, or their willingness to do so – that we perceived being generally higher with younger players; and more generally the interactions between the people around and in the game.
Confronting Expectations with Observations
The main assets of games are its data production mechanics and its particular interac-tional structure: the data production mechanics provide new possibilities in terms of study object, complexity, and format of the data. The game structure has a direct impact on the interactions between the researcher and the researched and offers new potentials regarding the survey context and the length of the data produced. To review the chal-lenges and opportunities encountered in the development and implementation of Tigo-Tigo, we confront the expectations in collecting data with a game with our experience of game development and use in the field (Table 1).
Data Production with the Game
The development of the game created a constant tension in fulfilling both the objectives and requirements of data collection and those of a game (Table 1, Objective 1). This necessary trade-off already appeared during the delineating and developing phases of the game construction. To collect comprehensive picture data, the game should have always used the same set of 11 pictures. But a high level of freedom is necessary in the game, to leave space for strategy and surprise.
The researchers must also constantly pay attention to both the game aspects and the data collection aspects during the game session itself. In particular, researchers had to make sure that people chose well and explained their emotion-picture association. For example, some very competitive players were not talkative. To collect the data we needed, we had to ask questions about their emotion-social network-picture associations. Our role of researcher took over and the game atmosphere suffered from it.
The resulting data is both quantitative (picture choice, emotion levels and social network) and qualitative (explanations for the pictures-emoticons associations), and has been collected following an embedded scheme. We believe that it would have been interesting to also focus on the interactions between the players. How did they/we react? What were their/our strategy? Why did they/we win? We underestimated the interest of a game being an open system in itself. In a sense, we did not fully exploit the interest of a direct contact with the researched, which provides ‘interpretative history to draw on when seeking to make sense of the answers’ (Cloke et al., 2004: 129), even if the qualitative data reveals some meanings that support the quantitative results and vice versa.
The data are retrospective emotional experiences in the environment after a super typhoon (Table 1, Objective 2). By retrospective, we mean that the emotions are recalled
rather than real-time measured. The use of pictures of peoples’ environment and emo-ticons representing emotions to connect the artificial game with the empirical world was successful. Respondents chose meaningful pictures. The pictures-emotions associations concerned feelings about objects (e.g. the road is already fixed) and situations (e.g. I am happy when I see vehicles racing). Both anecdotal feelings such as souvenirs of partic-ular events (e.g. that is the place where my friend told me that she had her heart broken and we talked in that place) and general feelings (e.g. there are no problems anymore when you go to church) were evoked. In some cases, the respondents associate the environment with emotions that do not concern them directly (either because they do not refer to their environment or because they speak of someone else’s emotions). While the large panel of emotional experiences may be seen as a weakness as the data may lack in focus, it is informative in the case of our study object. Our variable of interest, the
Table 1. Data production: confronting expectations with observations Expectations and objectives of the
game to collect data
Observations and conclusions based on Tigo-Tigo
1 Collect both quantitative (similar to questionnaire) and qualitative (similar to interview) reliable data
Trade-off in fulfilling both the requirements of data collection and game: systematism vs freedom; necessity to make people talk We collected picture choice, emotion levels
and social network information
We collected explanations. The interactions between the players is also a source of data 2 Data are retrospective emotional
experi-ences in the environment after a supertyphoon
By introducing ‘gates’ to the empirical world: in this case the use of pictures of people environment, emoticons and social network
Respondents choose meaningful pictures A large variety of emotional experiences
(strength¼ exploratory, weakness ¼ lack in focus)
Some emotions related to environment but not their environment and some emotions in their environment but not their emotions Possibility to be more specific in the choice
of ‘clues’ and pictures 3 Guide the respondent to the answers
structurally, adapted for complex data/ abstract study object
Via a guessing system, based on the player’s common history. Via abstract visuals and tokens
Resulting dataset is three-dimensional but not exhaustive
The game helps to reach information people are not used to talk about
The game creates ‘immersion time’ to build elaborated answers
The data may be difficult to interpret
typhoon, is explored in many aspects of people emotional experience in their environ-ment. Finally, we believe that it would be possible to focus on particular aspects by selecting more specific clues and pictures.
The particular game mechanics guide the respondent to the answers indirectly, it is adapted for the collection of complex data (Table 1, Objective 3). The guessing system based on the player’s common history – combined with familiar visuals – guide the respondents to elaborate and share complex information. The dataset created is three-dimensional: picture/emotion/respondent. To enable the guessing (and the pleasure of surprise associated with it), it is not exhaustive. As a consequence, further quantitative data treatments necessitate to reduce the number of dimensions, and densify the data for comparisons. A questionnaire would have been more exhaustive.
The game is particularly adapted to complex and abstract study objects. Relating emotions to the environment is not straightforward. We observed that some respondents took a lot of time to select the emotions to be associated with the picture, trying to find the right experience to share, and the right emotions and social network to associate with it. As if the game created an ‘immersion time’. As an example, many household heads turned and returned the picture cards with the Velcro on in, successively selecting some emotions and re-checking the picture associated with it.
Finally, given the particular data construction mechanics, the data may be difficult to interpret. What does the data exactly say about the selected pictures/emotions and the ones that were not selected? Are they really more meaningful? Is it dependent on the moment of the game? What is the exact influence of our choice of pictures? Are the experiences meaningful for the household head only or for the whole household? What does it say when the household partner was not able to guess? Answering those questions may be impossible, but raising them is necessary for a cautious use and interpretation of the data.
The Interactional Structure in the Game
The game setting particularly favours pleasure, reflexivity and team spirit while an interview or another data collection technique have a different impact (Table 2, Objec-tive 1). Players mostly enjoyed the activity. But the game does not provoke a complete ‘let it go’ effect. We perceived the level of ‘control’ as varying from one game session to the other for both the respondents and the researchers. In the case of the researchers, fatigue, stress, and the complex game/research trade-off were important factors disfa-vouring the immersion in the game. Moreover, the game atmosphere is easier to create during the first game sessions, when the suspense is also high for the researchers. It becomes more difficult when the researchers already played the game many times and get used to it. As with questionnaires and interviews, we could speak of ‘game fatigue’. Further, while the motivating and particular setting of the game was expected to help gathering long data because of its motivating character, it proved not to always be the case. It is exemplified by the household head who did not want to play. He was actually well willing to fulfil the questionnaire. Other examples include respondents who did not get the basic mechanics of the game and had difficulties to play. While using a game to
collect data, researchers must keep in mind that not everyone is interested in playing a game, or feeling capable to do the proposed activity.
The game reduces the translation barrier (Table 2, Objective 2). Instead of asking questions, the respondent is asked to follow a set of rules. Therefore, being able to play
Table 2. Interactional structure: confronting expectations with observations Expectations and objectives of the
game to collect data
Observations and conclusions based on Tigo-Tigo
1 Game experience: Impact of the structure on the interaction between researcher and researched, adapted for long data
Immersion, complicity. Players mostly enjoyed the activity
Variable distances between the researcher and the researched. It is impossible to create a complete ‘let it go’ effect Difficulty to be both a player and a
researcher, to focus both on the game atmosphere and the data collected Game fatigue
2 Using a game lowers the obstacles related to translation
Direct interaction between researchers and researched lowers potential translation distortions thanks to [1] the material (by using tokens people can manipulate and visual elements) [2] the rules (clear actions) Need of a translator-animator to explain the
rules and lead the game
New obstacle¼ the complexity of the game. It depends on the players
3 Using a game lowers cultural barriers, survey fatigue, power imbalance, and expectation
The moment of installation of the game is interesting to establish the contact. Installing and playing the game contribute to moderate cultural prejudices
An activity which the respondents appreci-ate in itself but not always successful. No responsive strategy observed during enjoyable sessions
The game changes the participation status. In this case the game artificially inversed power relations.
Not only expectation but also resentment and thankfulness
Depends on the level of immersion in the game
4 The quality of the game experience serves as an indicator for the quality of the inter-actions and the data
The challenge of creating a successful game draws the researchers’ attention on the quality of the interaction and its impacts on the data produced
The requirements of games participate in the framing of the data: e.g. social network
constitutes a guarantee that the objective has been well understood. As such, the role of the translator may be less crucial than in a classical interview. However, those game benefits do not compete with the advantages of a direct exchange and communication in a shared language remains preferable. Moreover, using a game to collect data necessi-tates to introduce an animator to explain the rules – preferably in the local language – and facilitate the game. The translator-animator had to convince people to play, participate in building a gaming atmosphere, encourage the respondent’s team, etc. Another strategy to lower the translation barrier is stressing visual communication. It constitutes an oppor-tunity in certain cases and a challenge in others, particularly with elderly people with a failing eyesight.
If the game is well designed, the researchers can expect to lower cultural barriers, survey fatigue, power imbalance and expectation (Table 2, Objective 3). First, by intro-ducing the game in more than sixty households, we realized that the moment of the installation of the game was interesting as such because it coincided with the moment of getting in touch and influenced the interactions between the participants: we placed piles of emoticons, boxes containing social network drawings, we distributed the card with the pictures to each of the players, and placed our sand timer and the token used to count the points. The installation coincided with the moment of getting in touch, it necessitated time for doing nothing but arranging the space, moving a chair, a table, changing seats. By accepting (un)comfortable positions and exchanging amused, curious or suspicious looks, both parties were already disclosing themselves. The positive or negative inter-actions during the game were also built on that moment; and being playful in general contributed to moderate cultural prejudices.
In our research context, survey fatigue was expected and there was little. Many respondents enjoyed playing and researchers had fun during most of the game sessions (Figure 3). As a consequence, the time passed quickly, everyone was motivated all along the game and to some extent forgot about the data collection context. We did not detect any strategy to manipulate the information shared during the enjoyable sessions and if there was survey fatigue, it disappeared throughout the game. Those were quality experiences with a certain level of immersion of the participants. It highly contrasted with the moment of submission of a questionnaire to the same respondents just after the game session. Instead of making the most of the ice-breaking effect of the game to pursue the discussion, we used the remaining time of the interview for surveying, which we would not recommend in this type of settings.
Another interesting aspect of the game experience is that roles are assigned to the various stakeholders and their interactions are organized via the rules and the use of tokens. The interactions are related to the ‘participation status’ temporalizing in the situation – here and now (Cefaı¨, 2010: 455). The game has an influence on those participation status. For example, our game artificially inversed powers: by being the ones who knew the environment displayed on the picture and associating emoticons to them, the researched were given power that the researchers did not have. As the game forced the researchers to introduce more freedom for the respondents during the data collection, it contributed to reduce the distance due to power differentials during the data collection interactions. The roles also directed the ‘answer’ of the household head (the picture-emoticons association) to his/her partner via the use of tokens, instead of directly
Figure 3. A game session (16th of July 2016). The researchers are sitting on the left, the household head is on the right, his partner is in the back with the fan, and the translator is sitting next to the camera, wearing a lined long sleeves t-shirt. Family and neighbours attend the game. The translator explains the rules (top left), the household head selects emoticons (top right), both the partner and the researchers try to guess (bottom left) and finally, the card is discovered (bottom right) 19
addressing his/her response to the researchers. We wonder if it may change the impact of social desirability and improve the quality of the data collected. But we don’t have any clues to assert it.
However, it does not eliminate the structure above the respondents as expectation, individual experiences and power differentials. In the case of the lady who played the game as if she was actually interviewed, the distance between the researchers and the respondent was very high. She had a lot of resentment against foreigners because she had been considered as too rich to receive help in the aftermath of the typhoon. We appre-hended expectation and power imbalance, here we observed another form of structure influencing the interaction. The status of participation were predefined by our perceived affiliation to the organizations that came after the typhoon. In other words, it appeared to depend on the individual specific experience people had with foreigners before. In many cases we experienced thankfulness, in some other cases expectation and in this case resentment. Most of the time, it was a complex mix of those various aspects and probably others that we were not able to perceive. But we believe that – in general – the game activity positively influenced the participation status of the various stakeholders, reduc-ing some distances and favourreduc-ing direct interaction, especially durreduc-ing successful game sessions. Structures as power differential, prejudices, etc. are very strong and probably impossible to overcome in such a short amount of time.
Finally, making the game ‘work’ draws the researchers’ attention on the quality of the interaction and its impacts on the data produced (Table 2, Objective 4). Making the guessing work forced us to add social network information to the game which proved to be valuable in understanding our object of analysis. Interestingly, while ‘involvement of the researcher in the direct framing of questions is a significantly powerful process in the construction of data’ (Cloke et al., 2004: 129), the researcher has a lesser control on the framing of the questions with a game, and it seems to be both an advantage and an inconvenient.
Conclusion
This article analyses a field-based game designed as an alternative to a questionnaire or an interview. The game was developed and used to collect data on people’s emotional experience in their environment, in an area hit by a typhoon. All data gathering tech-niques necessitate to define the problematic under study very specifically, to pay atten-tion for biases, but also for the complexity and the duraatten-tion of the data collecatten-tion activity. Creating a game to collect data was even more challenging: games do not exist to create data, their objective is to generate an experience. As a consequence, using games to gather data added important constraints: first, it had to be transformed in a way that it produced interesting and reliable data. Secondly, researchers must remain faithful to the characteristics of games. For example, a data collection game should be fun and compel-ling, it should be a contest, etc.
In general, data collection requirements were met and the data produced is valuable and reliable. It is both quantitative and qualitative, and people shared specific and complex information due to the particular way they were led to do so. The variable of
interest, the typhoon, is explored in many aspects of people emotional experience in their environment.
However, some difficulties appeared. First, it is difficult to be both a player and a researcher and the game necessitates a translator-animator. Each person’s role during the game should be precisely defined as the experience of the game and the quality of the data necessitate high vigilance and active participation at various levels. But role attri-bution can be used to change the stakeholder’s status of participation. For example, Tigo-Tigo inversed powers and allowed direct contact between the researcher and the researched. Secondly, a good game session requires players willing to play and feeling or being capable to understand and apply the rules. The more the players are motivated, the more the game gets them to let go and be open and true, which enhances the quality of the experience and of the data collected. Finally, the game requirements do frame – and restrict – the data, but they also bring innovation in the data material.
Further, we believe that many types of games could be relevant in many different contexts. We are convinced that the potential of games to collect data in the field has not been fully exploited yet. Games get people to act and interact in a well-designed and immersive setting. In particular, observing the players behaviours during the game is a great source of data that we did not exploit. We encourage social science researchers to innovate in their data collection techniques with the use of games and to further analyse their potential. New data collection methods yield alternative data, and this diversifica-tion enhances our knowledge building capacities.
Acknowledgements
This research would not have been possible without the active participation of 60 households of Guiuan. We are thankful for the time they accepted to spend with us, being accommodating and disclosing themselves playfully. We also thank the local authorities of Guiuan for allowing us to conduct our data collection.
We thank Prof. Grace T. Cruz and Prof. Maria Midea M. Kabamalan of the University of the Philippines Population Institute (UPPI) for their field support and wise advices. More generally, we are grateful for all the help received at UPPI.
We would also like to show our gratitude to Thibaut Quintens, founder of the non-profit organisation ‘Lets Play Together’ and of the publishing house ‘Act in games’. His numerous advises at the creation phase of Tigo-Tigo – based on his experience in travelling with games and in game creation – laid the foundation of the analysis presented in this article; and his vision of how games can powerfully contribute to better understand people has been inspiring throughout the entire research process.
Finally, the authors gratefully acknowledge the two anonymous reviewers for their insightful reading and constructive suggestions.
Declaration of Conflicting Interests
The author(s) declared no potential conflicts of interest with respect to the research, authorship, and/or publication of this article.
Funding
The author(s) disclosed receipt of the following financial support for the research, authorship, and publication of this article: This work was supported by Erasmus Plus International Credit Mobility
EU funds (grant numbers 2015-1-BE01-KA107-013175 and 2017-1-BE01-KA107-024723) and the University of Namur, Belgium.
Notes
1. Tigo means « Guess » in Waray, the local language of the respondents. The repetition is a common characteristic of game names in that language.
References
Abbott S and Haney C (1982) Trivial Pursuit. New York: Selchow and Righter. Angel R (1985) Pictionary. Seattle: Angel Games Inc.
Browne CA (2010) Compatibility. Versailles: Cocktailgames.
Cambridge University Press (2019) Cambridge Dictionary. Available at: https://dictionary. cambridge.org/ (accessed 11 July 2019).
Cefaı¨ D (2010) L’engagement ethnographique. Paris: EHESS.
CIRAD (2018) TerriStories: A Board Game Based on Research. Available at: https://www.cirad.fr (accessed 11 July 2019).
Cl´ement M and Sangar E (2018) Researching Emotions in International Relations. Cham: Springer Nature.
Cloke P, Cook I, Crang P, Goodwin M, Painter J and Philo C (2004) Practising human geography. London: Sage Publications.
Costanza R, et al. (2014) Simulation games that integrate research, entertainment, and learning around ecosystem services. Ecosystem Service 10: 195-201.
Costikyan G (2002) I Have No Words & I Must Design: Toward a Critical Vocabulary for Games. In: Ma¨yra¨ F (ed) Proceedings of Computer Games and Digital Cultures Conference. Tampere (Finland): Tampere University Press, pp.9-33
Duval J, Rubin J, Goldman E, Antrilli N, Zhang Y, Wang S-H and Kurniawan S (2017) Designing Towards Maximum Motivation and Engagement in an Interactive Speech Therapy Game. Proceedings of the 2017 Conference on Interaction Design and Children 589-594
Garris R, Ahlers R and Driskell JE (2002) Games, motivation, and learning: A research and practice model. Simulation & Gaming 33(4): 441-467
Gundry D and Deterding S (2019) Validity threats in quantitative data collection with games: A narrative survey. Simulation & Gaming 50(3): 302 -328
Glaw X, Inder K, Kable A and Hazelton M (2017) Visual methodologies in qualitative research: Autophotography and photo elicitation applied to mental health research. International Journal of Qualitative Methods 16: 1-8.
Hawthorne T, Krygier J and Kwan M (2008) Mapping ambivalence: Exploring the geographies of community change and rails-to-trails development using photo-based Q method. Geoforum 39(2): 1058-1078
Hertzog T, Poussin J-C, Tangara B, Kouriba I and Jamin JY (2014) A role playing game to address future water management issues in a large irrigated system: Experience from Mali. Agricultural Water Management 137: 1-14.
Kahneman D (2000) Experienced utility and objective happiness: A moment-based approach. In: Kahneman D and Tversky A (eds) Choices, Values and Frames. New York: Cambridge University Press and the Russell Sage Foundation, 673-692.
Milcu AI, Sherren K, Hanspach J, Abson D and Fischer J (2014) Land use policy navigating conflicting landscape aspirations: Application of a photo-based Q-method in Transylvania (Central Romania). Land Use Policy 41: 408-422.
NASA Earth Observatory (2013) Super Typhoon Haiyan Surges Across the Philippines. Available at: https://earthobservatory.nasa.gov (accessed 27 April 2018).
Nold C (2004) Emotional Cartography. Available at: http://www.emotionalcartography.net (accessed 12 February 2018).
Oldrup HH and Carstensen TA (2012) Producing geographical knowledge through visual methods. Geografiska Annaler. Series B: Human Geography 94(3): 223-237.
Randolph A (1995) Vermi. Venice, Italia: Venice Connection.
Rim´e B (2005) Le partage social des ´emotions. Paris: Presses Universitaires de France. Rivollet A and Beaujannot G (2013) Concept. Bruxelles: Repos Production.
Roubira J-L (2008) Dixit. Poitiers: Libellud
Schell J (2008) The Art of Game Design. Burlington: Morgan Kaufmann Publishers.
Smith M, Davidson J, Cameron L and Bondi L (2009) Emotion, Place and Culture. New York: Routledge
The Thiagi Group (2019) Resources. Available at: http://www.thiagi.com (accessed 11 July 2019).