HAL Id: tel-01970381
https://tel.archives-ouvertes.fr/tel-01970381
Submitted on 5 Jan 2019HAL is a multi-disciplinary open access
archive for the deposit and dissemination of sci-entific research documents, whether they are pub-lished or not. The documents may come from teaching and research institutions in France or abroad, or from public or private research centers.
L’archive ouverte pluridisciplinaire HAL, est destinée au dépôt et à la diffusion de documents scientifiques de niveau recherche, publiés ou non, émanant des établissements d’enseignement et de recherche français ou étrangers, des laboratoires publics ou privés.
in the central parsec of the Galaxy
Anna Ciurlo
To cite this version:
Anna Ciurlo. Physical and dynamical conditions of the molecular gas in the central parsec of the Galaxy. Galactic Astrophysics [astro-ph.GA]. Universite Paris Diderot – Sorbonne Paris Cite; Ecole doctorale 127 Astronomie & Astrophysique d’Île-de-France; Observatoire de Paris – LESIA, 2015. English. �tel-01970381�
Université Paris Diderot – Sorbonne Paris Cité
Ecole doctorale 127
Astronomie & Astrophysique d’Île-de-France
Observatoire de Paris – LESIA
THÈSE
Pour obtenir le titre de Docteur en Science Spécialité Astronomie & Astrophysique
Anna Ciurlo
Physical and dynamical conditions
of the molecular gas
in the central parsec of the Galaxy
Thèse dirigée par :
Daniel Rouan
Thibaut Paumard
Yann Clénet
Soutenue le 14 décembre 2015, jury :
M. Jacques Le Bourlot Président M. Andreas Eckart Rapporteur
M. Eric Thiébaut Rapporteur Mme. Jihane Moultaka Examinatrice
M. Andrea Goldwurm Examinateur M. Daniel Rouan Directeur M. Thibaut Paumard co-Directeur
Acknowledgments
This work would have never been possible without the support, guidance and advise of the many that crossed my path. Given that this text is in English, allow me to thank them all in the everyday language this work was carried out, French, with some of my Italian and a little bit of English.
Merci aux membres du jury, pour avoir pris le temps de lire ce manuscrit et pour la disponibilité ainsi que l’intérêt qu’ils ont montré. Merci à tous pour les remarques et la discussion enrichissante qui en a suivi. Merci en particulier aux rapporteurs qui se sont engagés dans la révision critique du manuscrit même quand le temps était serré. Thank you for the time you spent on the critical analysis even in the short time available.
Mes remerciements vont à mes directeurs de thèse, qui ont été complémentaires, présents tout en me laissant mon indépendance. Vous avez cru en moi et vous m’avez toujours soutenue. Au début c’est en vous regardant que j’ai pu apprendre et apprécier l’échange et la discussion scientifique. Merci donc pour vos qualités scientifiques et humaines aussi et pour m’avoir montré le beau la beauté de la recherche. En particulier, merci à Thibaut qui m’a accompagnée dans les premiers pas dans ce monde qui était encore nouveau et qui a cru en moi. J’ai frappé à sa porte bien des fois mais il a toujours su me guider pour que je prenne le relais, m’arrêter quand je commençais à trop me fixer sur un détail. Merci pour m’avoir appris à regarder les choses avec rigueur et fantaisie. Pendant ces années j’ai pu aussi apprécier les nombreuses discussions sur des sujets divers et je suis très contente que tu apprécies le limoncello. Merci à Daniel pour ses grandes qualités humaines et scientifiques. Avec les milliers des choses à faire et toutes ses responsabilités, il a toujours trouvé un moment pour discuter, pour me conseiller ou même pour signer un (ou mieux de nombreux) papiers. J’ai pu apprécier durant ces années ton ouverture d’esprit, toujours prêt à la discussion. Tu accueilles avec esprit critique mais cordialité toutes les idées proposées. En ta présence on se sent toujours très créatif et curieux. Merci à Yann, qui a été une présence constante, même au milieu de nombreuses choses à gérer. Tu as toujours été présent et disponible, que ce soit pour corriger un article, trouver une école d’été ou discuter une interprétation. Ton amabilité et tes encouragements m’ont beaucoup aidé dans les moments les plus difficiles.
Merci à Jacques, Franck et Emeric pour la collaboration et les discussions enrichissantes qui ont contribué à améliorer grandement ce travail. Merci à Emeric en particulier pour les graphs et sa grande disponibilité. Merci aussi à tous les collègues de l’Observatoire. Je suis arrivée dans un monde nouveau, dans un pays étranger et votre chaleur a transformé ce monde en quelque chose de beau et de familier. Je me rappelle en particulier d’une épique bataille de boules de neige comme l’un des premières souvenirs. Merci à Gérard, Eric, Damien, Tristan, Marie, Guillaume, Arnaud (sauf pour ses blagues sur la nourriture italienne) et Maxime pour les discussions et les bons moments. Merci à Roderick et Olivier pour les soirées à jouer la guitare et le soutien. Merci à Jonathan pour ses conseils et les inoubliables blagues, il m’a trop fait rigoler. Merci à Vincent, Silvestre, Fréderic, Vincent et Marie, grazie à Guy, pour les discussions intéressantes, les conseils et tous les bons moments. Aller au boulot c’était
plein de fois (merci Jonathan pour l’inspiration). Un merci spécial à Guillaume qui a partagé le bureau avec moi, pas depuis longtemps mais on dirait plus puisqu’il a été extrêmement ennuyant. Au moins cela m’a donné quelque chose sur laquelle décompresser. Mais bon, merci aussi parce qu’il m’a contaminé avec son calme très “vite”. Merci Marion, parce que le jour de ma soutenance elle n’a pas stressé et pour le soutien sur lequel je peux compter. Nous avons une approche du monde tant différente que j’aime beaucoup nos discussions. Merci à Nabih, pour être venu à la soutenance et pas au pot seulement. Bon, je rigole ! Merci pour les beaux moments passés ensemble et les histoires drôles à faire pleurer. Merci à Miguel qui a su, lors d’un moment délicat, me dire les bons mots au bon moment. Merci Pierre pour sa bonne humeur et son camion “Never give up, it s a wonderfull world”, quand on rédige c’est fondamentale ! Merci aux autres doctorants : Mélodie, Sophie, Clément, Raphael, Aurore, Matthieu, Cateline, Tabatha (et tous celles et ceux que j’oublie) parce que nos chemins ont été parallèles ces années et se sont croisés au club astro, dans l’organisation d’Elbereth, aux journées de thèses, ou simplement dans des moments de convivialité. Un grand merci à Pascal et Guillaume, avec lesquels j’ai partagé l’expérience magnifique du Sénégal, ça n’aurait pas été la même chose sans vous. Merci à JR et Vincent qui en ont fait partie aussi d’une manière. Pour cela je dois aussi remercier Daniel, Didier et Jaques qui l’ont rendu possible. Je tiens aussi à remercier Jacques en tant que directeur de l’ED qui a été fondamental pour la bonne réussite de ma thèse pour le soutien et le suivi des doctorants. On ne se sent jamais abandonnés. Merci aussi à tout le personnel de l’Observatoire qui a rendu ma thèse possible même quand il y avait des problèmes à la dernière minute (merci Jacqueline et Cris !).
Bien sûr je remercie ma famille du fond du coeur pour le soutien fort et toujours renouvelé, parce qu’ils sont tous venus à Paris pour le jour important de la soutenance (en se chargeant du pot aussi). Merci à mes parents pour m’avoir toujours encouragé et m’avoir été d’exemple. Merci à mon Père, pour avoir lu toute la thèse mais surtout pour m’avoir toujours soutenu dans mes choix tout en étant prêt à m’attraper si je tombais. Merci à ma Mère qui est toujours prête à venir à mon secours pour la plus petite jusqu’à la plus grande des choses et le soutien sans faute. Merci à mon frère Giacomo qui est le seul qui trouve jolies mes images du gaz et qui pose toujours des questions philosophiques sur la science et l’Univers. Merci à mon frère Pietro qui m’encourage et me soutient et est toujours fier de moi, je le suis de lui aussi. Son enthousiasme m’est précieux. Merci à ma soeur Agnese qui n’importe quoi je fasse me soutient sans jamais douter et pour la sagesse et la force d’une vraie adulte. Merci à mes grands-parents Orietta e Carlo qui me soutiennent et croient en moi avec grand enthousiasme et confiance. Merci à mon Grand-père Enrico qui m’a fait aimer les sciences, pour nos longues discussions par Skype et son sourire d’approbation qui est une énorme récompense pour moi. Merci à ma Grand-mère Anna pour tout l’amour qui m’a donné force, pour d’être toujours à mes cotés et m’apprendre à sourire à la vie. Merci à mes cousins, cousines, tantes et oncles qui me soutiennent et encouragent.
Merci à mes amis qui ont fait aussi le déplacement pour me soutenir. Merci Mati d’avoir cru la première qu’on allait partagé ces années à Paris. Merci Marci du soutien constant et
présent. Merci Ceci, notre lien et notre support réciproque est sans fin et n’a pas besoin de paroles. Merci aussi aux amis qui ont été proches de loin: Bea et ses paroles qui portent toute la force de son soutien quotidien, Anto pour notre amitié qui ne souffre pas le temps, Pietro compagnon fondamental d’études de physique et grandes discussions, Jack, Gio, Simo et Bruno amis de longue date et de longues discussions philosophiques. Mes remerciements vont aussi à ceux qui ont formé une nouvelle famille pour moi ici à Paris, spécialement: Angelo, Eunjin, Edgard et Andre. Un merci très spécial à Laura et Fany. Vous êtes de la famille pour moi et fondamentales tant dans cette période difficile que pour le futur. Laura avec ta pensée profonde, Fany avec ta force.
Et maintenant, dulcis in fundo, merci à Marcello. Depuis longtemps nous marchons ensemble dans cette vie qu’on découvre ensemble. Non so nulla del futuro se non che voglio passarlo con te.
bla
[...] Così tra questa Immensità s’annega il pensier mio: E il naufragar m’è dolce in questo mare.
Contents
Abstract . . . xi
List of acronyms . . . xiii
Structure of the central parsecs of the Galaxy . . . xv
1 Introduction 1 1.1 Context . . . 1
1.2 The Galactic Center environment . . . 3
1.2.1 The Bulge and the Bar. . . 3
1.2.2 The Central Molecular Zone . . . 3
1.2.3 Sgr A . . . 4
1.2.4 Sgr A East . . . 4
1.2.5 The Circumnuclear Disk . . . 6
1.2.6 Sgr A West and the Central Cavity . . . 7
1.2.7 Sgr A* . . . 11
1.2.8 Limit Cycle . . . 12
1.3 Interstellar medium . . . 13
1.3.1 Studying the ISM. . . 13
1.3.2 Physics of the ISM . . . 14
1.3.3 Molecular clouds structure and properties . . . 14
1.3.4 Molecular hydrogen . . . 14
1.3.5 Photon dominated regions . . . 17
1.3.6 Shock regions . . . 18
1.4 Aims of the thesis’s work. . . 18
2 Dataset and Analysis method 21 2.1 Dataset . . . 22
2.1.1 Integral field spectroscopy . . . 22
2.1.2 SPIFFI instrument . . . 23
2.1.3 Observations . . . 26
2.2 Calibration . . . 30
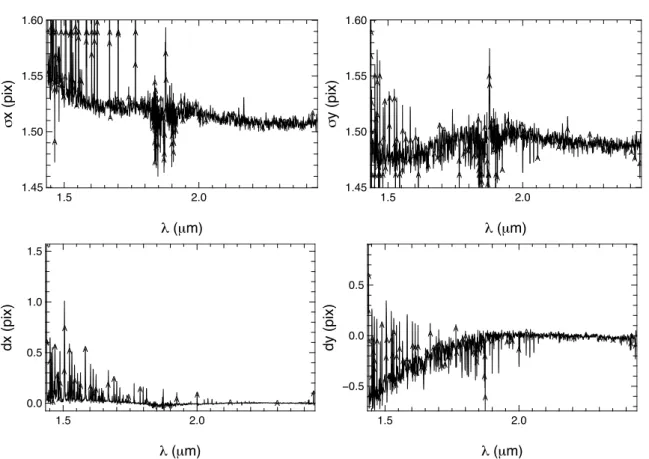
2.2.1 Relative calibration . . . 30
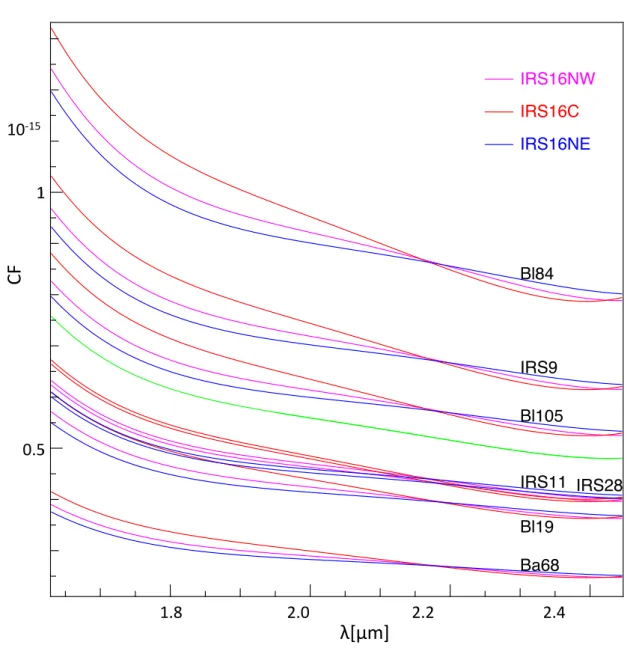
2.2.2 Photometric calibration . . . 32
2.2.3 Final calibration factor and uncertainty . . . 33
2.2.4 Continuum subtraction. . . 36
2.3 Analysis methods: regularized 3D-fitting of spectroscopic data . . . 38
2.3.1 Regularized 3D-fitting . . . 39
2.3.2 Hyper-parameters tuning . . . 40
2.3.3 Uncertainties . . . 48
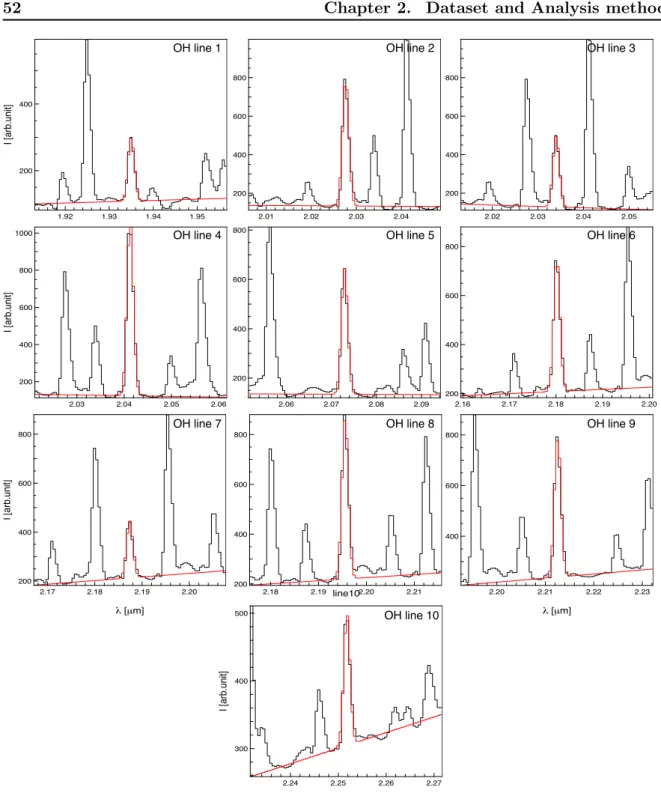
2.4 Instrumental line width . . . 49
3 H2 morphology and dynamics 57
3.1 Regularized 3D-fit of 1-0 S(1) . . . 58
3.1.1 Flux map . . . 59
3.1.2 Velocity map . . . 62
3.1.3 Width map . . . 67
3.2 Regularized 3D-fitting of other lines . . . 69
3.2.1 Ortho 1-0 lines . . . 70
3.2.2 Para 1-0 S(0) line . . . 75
3.3 Extinction corrected map . . . 76
3.3.1 Extinction law . . . 76
3.3.2 Local extinction variations. . . 78
3.3.3 Extinction map . . . 79
3.3.4 Dereddened 1-0 S(1) flux map . . . 84
3.3.5 Dereddened 1-0 S(0) flux map . . . 85
3.4 Flux–extinction correlation . . . 86
3.4.1 Individual extinction-flux correlation . . . 87
3.4.2 Sets of correlation . . . 87
3.4.3 Radiative transfer model. . . 87
3.4.4 Screen extinction τ0 . . . 91
3.4.5 Cloud extinctionτ . . . 92
4 Physical properties of the molecular hydrogen emission 97 4.1 Data analysis . . . 98
4.1.1 Para 1-0 lines: S(2), Q(2) . . . 98
4.1.2 2-1 S(1) line . . . 99
4.1.3 Multiline analysis . . . 100
4.2 Excitation diagrams . . . 101
4.2.1 Expression of the column density . . . 102
4.2.2 Excitation mechanism . . . 102
4.2.3 Data analysis using excitation diagrams . . . 104
4.2.4 Uncertainties . . . 107
4.2.5 Distinguishing thermalized from non-thermalized regions . . . 108
4.3 Zone analysis . . . 110
4.3.1 Thermalized zones: the CND . . . 110
4.3.2 Non-thermalized zones: the Central Cavity . . . 112
5 Conclusions and perspectives 125 5.1 Conclusions . . . 125
5.2 Perspectives . . . 128
B Regularized 3D-fit on recombination lines 133
C Study of the molecular gas in the central parsec of the Galaxy through
regularized 3D spectroscopy 139
D Hot molecular hydrogen in the central parsec of the Galaxy through
near-infrared 3D-spectroscopy 143
Bibliography 165
Résumé I
Introduction. . . I
Structure du Centre Galactique . . . I
Le milieu interstellaire au Centre Galactique . . . II
Objectifs de la thèse . . . III
Observations et méthodes appliquées . . . IV
SPIFFI . . . IV Données . . . V Calibration . . . V Ajustement 3D Régularisé . . . VI Méthode 1D . . . VII Résultats . . . VII
Morphologie et dynamique du gaz. . . VII
Extinction . . . IX
Excitation du H2 . . . XII
xi
Abstract
Physical and dynamical conditions of the molecular gas in the central parsec of the Galaxy
In the central parsec of the Galaxy the environment of the black hole (Sgr A*) presents a very young star cluster, emitting a strong UV radiation, and two main gas structures: the Circumnuclear Disc (CND), composed of dust and neutral gas, and the Minispiral, consisting mainly of dust and ionized gas. The aim of this work is to describe H2 distribution and properties in the central parsec where the neutral CND encloses the
ionized Minispiral, in order to understand the interstellar medium conditions in this ionized environment. This study is carried out through a near-infrared spectro-imaging data cube of the central cavity observed with SPIFFI on the VLT. These observations cover several H2 lines. The analysis has been done in two parts.
• In the first part of the analysis the gas morphology and dynamics are analyzed. To handle the noise and conserve good angular resolution an original line fitting method is applied: a global regularized 3D-fit, developed by T. Paumard. This method leads to high spatial and spectral resolution maps of the intensity, velocity and width of several H2 lines. For the first time the extinction map of H2 is
traced directly from the ratio of two H2 lines, allowing to correct flux maps and to
observe the effect of the foreground and local extinction. Molecular gas is detected everywhere. In addition to the known CND, H2 emission is detected from all over
the Central Cavity and in particular in the Northern Arm Cloud, from a region between GCIRS 7 and the Bar and from the border of Minicavity.
• In the second part of the analysis the excitation mechanism of the gas is enquired. A more classical 1D spectroscopic model fitting is applied in order to simultane-ously analyze several H2 lines. The excitation diagrams allowed to estimate gas
temperature, mass and density of several zones across the field.
These analyses allowed the detection of H2 emission from all over the observed field
of view. In particular several components of the H2 emission have distinct physical
properties. In the CND the emission comes from a hot, thermalized, thin layer at the surface of the dense clouds. This hot layer contains only a small fraction of the total H2 mass. In the Central Cavity H2 is not thermalized. The emission arises from a part of the gas contained in the bulk of the Northern Arm Cloud and also from the more diffuse gas contained in the Central Cavity. A strong deviation from thermal equilibrium is detected near the Minicavity and can be interpreted as coming from H2 constantly formed and destroyed in steady state, out of equilibrium.
Keywords: Galactic Center – Interstellar medium: molecules – Techniques: imag-ing spectroscopy – Infrared: Interstellar Medium
xiii
List of acronyms
ADU
Analog to Digital Unit
AGN
Active Galactic Nucleus
CND
Circumnuclear Disk
CMZ
Central Molecular Zone
(F)UV
(Far) Ultraviolet
IFS
Integral field spectroscopy
ISM
Interstellar medium
ISRF
Interstellar radiation field
LTE
Local thermodynamic equilibrium
(N)IR
(Near) Infrared
OPR
Ortho-to-para ratio
PDR
Photon dominated region
PSF
Point spread function
(SM)BH (Supermassive) black hole
xv
Structure of the central parsecs of the Galaxy
Northern Arm Cloud
CND
Minispiral
+
Sgr A* GCIRS 16 AF GCIRS 9 GCIRS 1 GCIRS 3 GCIRS 7 ★GCIRS 15 ★
★
★
★
★
★
★
★
★
★
★
★
GCIRS 13 ★
Central
Cavity
Chapter 1
Introduction
Contents
1.1 Context . . . 1
1.2 The Galactic Center environment . . . 3
1.2.1 The Bulge and the Bar . . . 3
1.2.2 The Central Molecular Zone. . . 3
1.2.3 Sgr A . . . 4
1.2.4 Sgr A East . . . 4
1.2.5 The Circumnuclear Disk . . . 6
1.2.6 Sgr A West and the Central Cavity. . . 7
1.2.7 Sgr A*. . . 11
1.2.8 Limit Cycle . . . 12
1.3 Interstellar medium . . . 13
1.3.1 Studying the ISM . . . 13
1.3.2 Physics of the ISM . . . 14
1.3.3 Molecular clouds structure and properties . . . 14
1.3.4 Molecular hydrogen . . . 14
1.3.5 Photon dominated regions . . . 17
1.3.6 Shock regions . . . 18
1.4 Aims of the thesis’s work . . . 18
1.1
Context
Phenomena taking place at the center of galaxies have proved to be of great importance to characterize galaxy formation and evolution. The proximity of the Galactic Center of the Milky Way makes it an exclusive object for the investigation of phenomena related to the activity in galactic nuclei.
There is strong evidence that most galaxies contain supermassive compact objects. The hypothesis proposed byLynden-Bell & Rees(1971) is that most – if not all – normal galaxies have massive, but dormant, supermassive black holes (SMBHs) at their centers. The center of the Galaxy encloses a mass of 4 106 M as evidenced by measurements of stellar orbits (Schödel et al. 2002; Ghez et al. 2005) contained within 0.1 pc. Firstly observed as a strong radio source, identified as Sgr A*, the Galactic Center indeed seems to host a SMBH which
is accreting and radiating. For instance flares observed in the IR (Genzel et al. 2003a) or in X-rays (Baganoff et al. 2003) are clearly related to the presence of the SMBH and accretion events. However, given its mass, it does not shine as brightly as it could. The Eddington luminosity (the maximum luminosity) of a BH of that mass is LEdd ∼1011L while the Milky Ways SMBH radiates ∼10−7LEdd (Narayan et al. 1998; Baganoff et al. 2003). The Galactic Center is thus not considered as an Active Galactic Nucleus (AGN).
AGNs correspond to the small fraction of those galaxies where the SMBH is responsible of very energetic phenomena. An accretion disk supplies the material that is fed to the SMBH (Lynden-Bell 1969); the conversion of gravitational energy in thermal energy through friction is responsible of the very large luminosity. The most powerful AGNs (Quasars) are also the farthest away, while Seyfert galaxies – closer to Earth than Quasars – are less powerful but with brighter nuclei than those of normal galaxies. Changes in luminosity and number of AGNs over time may be a key element to interpret galaxy formation and evolution but also to understand the origin of their central SMBHs.
Even though there are similarities with Seyfert galaxies, (Woltjer 1959andLo & Claussen 1983pointed out that it seems to be closely related to these active galaxies) the Galactic Center would seem to be in a non-active state. However, cycles of higher activity might have taken place in the past and might take place in the future, given the current conditions of matter and star activity (Morris & Serabyn 1996). The Galactic Center is thus an unique laboratory to study SMBHs and explore their impact on stellar and interstellar environment without being dazzled by the extreme luminosity of an AGN.
The Galactic Center is only 8.5 kpc far away, while the nearest normal spiral galaxy (M31) is located at a distance of 700 kpc and the nearest Seyfert galaxy (NGC 1068) is located at a distance of 25 Mpc. Therefore in our Galaxy we have a unique chance to observe in detail the environment of a galactic nucleus harboring a SMBH. The Milky Way can be described as a barred spiral (von Linden et al. 1996) and looks very standard. Therefore the results obtained from its study are presumably applicable to other galaxies as well.
The interstellar medium (ISM), and particularly its molecular phase, plays an important role as it fuels galaxy evolution through star formation and SMBHs growth. The study of the structure and physical conditions of molecular gas helps putting constraints on the mass inflow to the center, and allow to study the evolution and nature of the driving force. Molecules may also play a role in regulating the activation/deactivation of starburst and AGNs phases as they have been detected in large galactic outflows.
The Galactic Center is obscured, at optical wavelengths, by an extinction of AV ∼ 30 magnitudes because of diffuse dust along the line of sight. Radio, infrared (IR) and sub-millimeter wavelengths can penetrate these obscured regions. In particular the IR molecular emission can be observed from very inner regions of galaxies with deeply obscured nuclei.
In the Galactic Center, temperatures, densities, and internal velocity dispersions are higher than elsewhere in the Galaxy (Güsten 1989). Powerful large-scale shocks are involved in the ISM excitation, as underlined by high velocity bulk gas motions and velocity discontinuities. The very different nature of the dense ISM in the inner Galaxy makes it useful not only for proving theories about the interaction with stars in the nuclei of other galaxies, but also as a laboratory for studying physical effects on the ISM in some extreme conditions of UV field and shocks.
1.2. The Galactic Center environment 3
The goal of the present work is to study the molecular phase of ISM in the central parsec of the Galaxy to characterize its physical conditions. In the following sections a brief introduction of the Galactic Center environment – focusing on the central parsecs of the Galaxy – and a short description of the ISM physics and properties will be given. For a more complete review on the Galactic Center seeMorris & Serabyn(1996);Genzel et al.(1994);Mezger et al.(1996). A review of the Central parsec has been published byGenzel et al.(2010). For a detailed review on Sgr A* seeMorris et al.(2012). Latest results are provided by the conference proceedings of the IAU 303 Symposium (Sjouwerman et al. 2014).
1.2
The Galactic Center environment
The whole Galaxy contains a mass of around 1011 M and extends for 14 kpc. The Solar system is located at∼8.5 kpc from the Galactic Center, between two spiral arms.
The Galactic Center notion refers to a wide range of sizes: from several thousands of parsecs to the very immediate surroundings of the BH. In the following sections, a short description of the various gas and stellar structures of the Galactic Center shall be provided. These are ordered according to scales from few thousand parsecs to the geometrical center.
1.2.1 The Bulge and the Bar
Within 3 kpc from the center, the stars are arranged in an ellipsoidal bulge: the Galactic Bulge, extending down to 0.3 kpc. The stars here are of a late type and any present-day star formation seems to be lacking (Frogel 1988).
At the same distance scale, stars are distributed along a stellar Bar extending out to 2 kpc, with an axis ratio of 3 : 4. This Bar plays a role in matter inflow towards the inner few hundred parsecs (Morris & Serabyn 1996). Indeed, the Bar has the effect of deviating the gas from circular motion to elongated orbits because of cloud collisions. Shocks in these orbits compress the gas into molecular form. The orbiting gas loses angular momentum and it is driven inward at around 0.1–1 M yr−1. The gas can then end up forming stars (dominating processes 0.3–0.6 M yr−1; Güsten 1989), it can be lost as a thermally driven galactic wind (0.03–0.1 M yr−1) or it can accrete into the much smaller-scale Circumnuclear Disk (0.03–0.05 M yr−1; Sect. 1.2.5).
1.2.2 The Central Molecular Zone
At around 200 pc, gas density increases and the gas is mainly in molecular form. This region is usually referred to as the Central Molecular Zone (CMZ).
Here, there are many massive, high-temperature (30–200 K) and dense (104cm−3;Ginsburg et al. 2015) molecular clouds with broad line width (10–30 km s−1). Such densities are typical of clouds cores with a low filling factor, but they are required for the clouds to resist tidal shearing (Guesten & Downes 1980). The orbits of these clouds are not completely stable.
As previously discussed the gas which is not consumed in star formation is swept away through galactic winds – after entering a hot X-ray emitting halo – or it moves inwards towards the center. In the central parsec only a tiny fraction of the inflow material is currently accreted
by the compact source Sgr A*. The Limit Cycle hypothesis (Sect.1.2.8) states that this inflow of material provokes stars formation, which temporarily turns off the inflow opposing strong winds to the incoming material (Morris & Serabyn 1996).
The CMZ is divided in two main structures:
• A high-velocity (130–200 km s−1) component that appears as a continuous ring (the 180-pc molecular ring). This structure traces a HI/H2 transition (Binney et al. 1991).
• A low-velocity (< 100 km s−1) component of massive and dense molecular clouds moving in the same plane as the Galactic plane (the Galactic Disk population). There are also filament-like clouds which are predominantly stretched arcs and gaseous arms (Bally et al. 1988).
The ionized gas in the same area is more uniformly distributed than the neutral one, indicating a more even distribution of heating sources.
Dust temperature decreases rapidly with increasing distance reaching 23 K at 200 pc. Hot dust (50 K) is located mainly in the inner few parsecs.
The X-ray spectrum of the inner 150 pc indicates the presence of many point sources as well as of a high-T plasma (1–15 keV; among others,Nottingham et al. 1993;Markevitch et al. 1993). Koyama et al. (1996) also note that the X-ray spectrum of the central 150 pc of our Galaxy is very similar to that of the Seyfert 2 galaxy NGC 1068. This diffuse emission could be the result of the explosion of a great number of supernovae (∼103). This scenario implies that the Galactic Center in the past released a greater amount of energy with respect to the activity we are observing today. Such past energy release is compatible with the idea of some past starburst episode.
An intense magnetic field pervades the central hundreds parsecs. It is perpendicular to the Galactic plane in the inter-cloud space while it is predominantly parallel in dense clouds (Ferrière 2009).
1.2.3 Sgr A
The central 30 pc are occupied by the compact Sgr A radio complex. This source was discovered by Piddington & Minnett 1951 and it was associated with the Galactic Center by McGee & Bolton (1954). Downes & Martin (1971) resolved the Sgr A into the extended synchrotron source Sgr A East and the compact, three-armed spiral-shaped, H ii region Sgr A West (the Minispiral). Harvey et al.(1976) detected a double-peaked far-infrared dust surface brightness; later it was interpreted by Becklin et al. 1982 as emission from a dust torus surrounding the Galactic Center. Today, this feature is referred to as the Circumnuclear Disk (CND). At, or close to, the dynamical center of the Galaxy there is the compact source Sgr A* where most of the radio emission comes from.
1.2.4 Sgr A East
The Sgr A East structure is an extended (7 pc x 9 pc) synchrotron, shell-like source located at a projected distance of 2.1 pc from Sgr A*. In projection, Sgr A East encloses the ring formed by the CND which, in turn, encircles the Minispiral (Fig. 1.1).
1.2. The Galactic Center environment 5
The prevailing hypothesis is that Sgr A East has been created by an explosive event inside a dense Giant Molecular Cloud 5 104 years ago (Mezger et al. 1989; Zylka et al. 1990). This explosion may have also strongly affected the structure of the CND. At 80 pc around the Galactic Center the X-ray pervasive hot plasma has a similar expansion age. Both structures may come from the same event.
1.2.5 The Circumnuclear Disk
The CND is a compact, asymmetrical, torus of dust (Becklin et al. 1982) and molecular gas (HCN, Guesten et al. 1987;Christopher et al. 2005, CO, Guesten et al. 1987 and H2,
Yusef-Zadeh et al. 2001) which rotates around Sgr A* at 110 km s−1, in the same direction as the general galactic rotation (Jackson et al. 1993). It is inclined with respect to the galactic plane. The CND is fragmented in many clumps that have large velocity dispersions (∼17 km s−1) and are very dense (∼106−8 cm−3;Christopher et al. 2005;Smith & Wardle 2014). The filling factor is around 10%. Due to this clumpiness, the UV radiation penetrates efficiently. The line width is large (∼ 40 km s−1) and implies a large inter-clump velocity dispersion caused by collisions and shocks. Outside of the CND there are several massive molecular clouds (Mezger et al. 1996).
The gas and dust temperatures are high (50–200 K for the gas and 50–70 K for dust,Becklin et al. 1982; Christopher et al. 2005, among others). The inner rim is hotter (few 100 K) and denser (104−7 cm−3) than the outer part. This rim is a Photon Dominated Region (Genzel et al. 1994, see Sect.1.3.5). The well-defined, sharp border is ionized by radiation supplied by the central star cluster.
Beyond its inner rim the CND distribution is highly asymmetrical: 7 pc at negative galactic longitudes while it extends to only 3 pc at positive galactic longitudes. The higher symmetry of the inner rim with respect to the outer part could be explained by the naturally shorter orbital time-scale. Despite its clumpy structure, the CND is usually modeled as a rotating ring. The CND has an inner radius of∼1–1.7 pc and an outer radius of 3 –7 pc. The region it encloses is referred to as the Central Cavity.
The mass contained in the CND is around 106 M (Christopher et al. 2005), its density is in the range of 104–106 cm−3. Most estimates of the mass and density are below the critical density required for stability against tidal disruption, implying that this structure is short-lived. However Christopher et al. (2005) have found higher densities and propose a longer lifetime for this feature. The present irregular appearance suggests a short lifetime as well since asymmetry suggests time-dependence. Its dynamical age is estimated to be around 105 yr (Guesten et al. 1987), i.e. around the same age as Sgr A East and the thermal plasma. Notwithstanding the above, there is presently no conclusive evidence to confirm either the stable scenario or the transient scenario. But, if the CND is a permanent feature, it must have a strong impact on the inner stellar cluster and it probably is a preferential star formation site. In both scenarios the sharp inner edge and the large density drop in the Central Cavity have to be interpreted as transient features. This cavity is probably the result of the interaction between the inflow gas and the radiation provided by central star cluster (Guesten et al. 1987). The stars of this cluster are in a windy phase which pushes the gas away from the center. Once the source of this wind disappears, the gas accretion towards the central parsec may increase
1.2. The Galactic Center environment 7
again and lead to another star formation episode, coherent with the continuous but episodic Limit Cycle scenario (Morris & Serabyn 1996).
There are two main hypotheses about the origin of the CND:
• capture and subsequent tidal disruption of a passing giant molecular cloud; • energetic disruption of a stable pre-existing disk.
Whatever its origin is, it might be connected to the expansion of Sgr A East. It is likely that the shell-like radio feature either compressed and pushed gas towards the center or disrupted a pre-existing disk. The Minispiral is also deeply connected to the CND as, for instance, the Western Arc of this H ii region traces the inner edge of the CND. The interaction among all these structures is still unclear but they may interact or have interacted.
Mass inflow from the CND towards the Central Cavity is few 10−2M yr−1 (Guesten et al. 1987;Jackson et al. 1993). The magnetic field is high (0.5–2 mG) and may play a role in the disk dynamics and in angular momentum loss (Guesten et al. 1987;Morris & Serabyn 1996).
On the CND inner border, an emission from vibrationally excited H2 has been detected. There are two main competing heating mechanisms for the CND (Gatley et al. 1986; Yusef-Zadeh et al. 2001):
• shocks, both dissipating the local turbulence and from winds of the Central Cavity; • UV radiation, provided by the central star cluster.
The northeastern lobe of the CND is shielded from the UV field by the Northern Arm of the Minispiral. Therefore, at least in this region, cloud-cloud collisions are more likely to heat the gas. For the rest of the CND the observed emission can be due to UV fluorescence (Pak et al. 1996) or it might be a consequence of a strong shock caused by the central wind (Gatley et al. 1984,1986). The central star cluster is likely the source of this wind (Yusef-Zadeh 1994). For instance GCIRS 16NW and 16SE2 are the sources of a 600 km s−1 and a 2 500 km s−1 wind respectively (Martins et al. 2007). This interpretation is supported by the fact that it would explain the large line width and the sharp transition observed at the CND inner border where gas is in a quasi-steady equilibrium between the wind and the turbulent disk.
1.2.6 Sgr A West and the Central Cavity
Inside this Central Cavity, at 1.7 pc the gas density drops by an order of magnitude or two with respect to the CND (from 1021 cm−2 at the center of the Central Cavity to 1023cm−2 at the inner edge).
This cavity contains hot (∼106 K) X-ray emitting gas (Baganoff et al. 2003; Muno et al. 2004). X-rays maps also exhibit a number of point-like sources including a counterpart to the Sgr A* radio source. The Central Cavity contains 300 M of neutral gas and few M of dust (Davidson et al. 1992) in addition to the ionized gas (Jackson et al. 1993;Davidson et al. 1992). Within the Central Cavity the dust temperature rises as high as 300–400 K (Gezari, D. and Dwek, E. and Varosi F. 2003). This very hot dust is locally heated by the stars embedded into it, while warm dust (170 K) is heated from outside by luminous, hot HeIstars. The innermost
Figure 1.2: Combination of a radio image of the Minispiral (NRAO Very Large Array, green), HCN emission of the CND (BIMA, red) and infrared stars emission (NASA Spitzer Space Telescope, blue). Credits: F. Yusef-Zadeh (http://images.nrao.edu/667).
1.2. The Galactic Center environment 9
may be the result of the action of the wind produced by the young massive star being in a windy phase (Genzel et al. 1994;Morris & Serabyn 1996).
In the Central Cavity lies Sgr A West, an 2.1 pc × 2.9 pc ionized structure of density 103 cm−3 and H II mass of ∼ 250 M . It has been discovered thanks to the high angular
resolution of the VLA (Lo & Claussen 1983;Ekers et al. 1983;Brown & Johnston 1983). This is an optically thin HIIregion, more filamentary than the surrounding CND.
The ionized gas appears, in projection, as a spiral feature (as showed by the 2 cm emission) and it therefore is referred to as the Minispiral (Lo & Claussen 1983). However, individual features of the Minispiral appear not to be confined to a single plane and the spiral shape is a projection effect (Paumard et al. 2004). The streamers of the Minispiral are photo-ionized by UV radiation provided by the massive young stars (see for instanceMartins et al. 2007). The peculiar motions of the Minispiral arms may be the result of the interaction with stellar winds or of cloud-cloud collisions. The spiral features contain 15 M and they are relatively smooth (Ekers et al. 1983).
The Minispiral is composed by a Northern and an Eastern Arm, a Bar and a Western Arc (Fig.1.3). The Western Arc is the inner ionized border of the CND. The Northern Arm is the photoionized layer at the surface of a neutral cloud, referred to as the Tongue (here referred to as the Northern Arm Cloud), falling towards the center (Davidson et al. 1992; Telesco et al. 1996). Zhao et al. (2009) suggested that the Northern Arm and Eastern Arm may collide in the region of the Bar. The Northern Arm contains the Minicavity radio features: a nearly circular 200 hole in the ionized streamers of the Minispiral, 3.5 00 southwest of Sgr A* (Lutz et al. 1993).
The temperature inside the Minicavity are of 1–2 104 K as estimated from near-infrared (NIR) FeIIIlines by Eckart et al. 1992). The CND eastern border is not ionized as it happens
for the Western Arc. The reason can be the presence of the dense (∼1022cm−2) Tongue which blocks the radiation. In the Northern Arm of the Minispiral, emission from a small amount of UV-pumped H2 has been detected (Depoy et al. 1989; Lutz et al. 1996) as well as Fe II
emission (Depoy 1992;Burton & Allen 1993). FeIIis detected in the Minicavity as well (Depoy
1992).
The origin of the Minispiral streamers is likely the infall of passing molecular clouds which are then stretched by tidal distortion (Ekers et al. 1983). The surface of these clouds would then be ionized by UV radiation and lead to the observed features (Paumard et al. 2004).
To summarize there is a cascade between scales: the massive molecular clouds orbiting in the CMZ are in a non-circular motion because of the presence of the stellar star Bar, hence neutral gas can spiral inwards and fuel the CND. In turn, it drops material into the Central Cavity, which, being illuminated by the UV field, is the origin of the observed Minispiral (Güsten 1989;Morris & Serabyn 1996;Paumard et al. 2004).
1.2.6.1 Stars of the Central parsecs
Stars located within the central parsec are responsible for the ionization of the gas and for the heating of dust within the Central Cavity.
The stellar density increases towards the center, from a few tenths of parsecs to the Central Cavity (Becklin & Neugebauer 1968;Catchpole et al. 1990). In particular, the central parsec
Northern Arm Cloud
Figure 1.3: Image of the Brγ emission of Sgr A West. The velocity scales ranges between -350 (purple) and +350 km s-1 (red). Credits: Paumard et al. (2004).
contains a high number of hot early-type stars (Krabbe et al. 1995;Blum et al. 2003;Paumard et al. 2006;Bartko et al. 2009), making the Galactic Center one of the richest concentrations of such stars in the Galaxy. Star formation is recent in the central parsec (Rieke & Lebofsky 1982, for instance) and the young stars, mixed with old ones, dominate the luminosity. These stars are indicated as the cause of the windy phase which takes place in the central parsec. The early type stars are concentrated in the central 1200. GCIRS 16 is the brightest central condensation of this cluster of early type stars. The brightest star in the Galactic Center, GCIRS 7, is a red supergiant (late type star,Becklin & Neugebauer 1968), associated with the star formation event of the early type stars (Paumard et al. 2014b). Of the young (4–8 Myr) nuclear cluster more than 100 stars have been identified as Wolf-Rayet or OB stars (Allen et al. 1990;Ghez et al. 2003;Paumard et al. 2006;Bartko et al. 2009, among others).
There are at least two distinct dynamic populations. The first one is distributed on a clockwise disk and composed of very massive stars. These stars have formed because of frag-mentation and instabilities in a massive gaseous disk 4–6 Myr ago (Genzel et al. 2000; Levin & Beloborodov 2003; Paumard et al. 2006; Lu et al. 2009). The second population is more isotropically distributed and there is an on-going discussion on a possible second disk (Genzel et al. 2003b;Bartko et al. 2009).
Stars contained within one arcsecond of the SMBH are referred to as S-stars. How these stars are formed that close of the SMBH is still unclear. The tidal forces of the BH should indeed strongly disfavor star formation. This problem is referred to as the “paradox of youth” (Ghez et al. 1998).
1.2. The Galactic Center environment 11
Figure 1.4: Stars of the central parsec imaged in the NIR by NACO at the ESO VLT. The red extended emission is due to gas and dust in the Minispiral or to circumstellar material of individual stars. Credits: Galactic Center webpage of the Physikalisches Institut, University of Cologne (https://www.astro.uni-koeln.de/node/235).
1.2.7 Sgr A*
The existence of a strong compact radio source at the Galactic Center has been at first observed by Lynden-Bell & Rees (1971). Sgr A* is located at the dynamical center of the Galaxy, embedded in the center of the extended components of Sgr A West, in front of the Bar of the Minispiral (Beckert et al. 1996).
The apparent size of Sgr A* depends on the wavelength but it is in the milli-arcsecond domain. This compact radio source (Balick & Brown 1974;Lo 1985;Yusef-Zadeh et al. 1986) is the most likely candidate for a central SMBH, even though it is much fainter than it could be given its mass.
Studies of the proper motion of the central stellar cluster suggested a mass of 2.6 106 M confined within 0.015 pc (Eckart & Genzel 1997; Ghez et al. 1998). Schödel et al. (2002), Ghez et al. (2000) and Eckart et al. (2002) localized the mass within 30 mas,
Figure 1.5: Scheme of the structure of the central parsec (Genzel et al. 1994).
strongly supporting the BH interpretation for Sgr A*. The inferred mass for the Galactic Center BH is considerably less than that inferred for BHs in most AGNs, but well in the range of Seyfert and normal galaxies.
If the Galaxy shows indeed a core activity too low to be an AGN on the other hand, the CND seems to be comparable to the obscuring tori that are responsible for differences in the various AGN classes. The formation of such tori appears to be a direct consequence of the presence of massive central BHs. Notwithstanding the above, there is no direct evidence for the presence of a standard accretion disk in the Galactic Center. While the present-day accretion into the BH seems to be rather low, there is plenty of gas and dust supply available in the inner 200 pc suggesting that different phases or activity might take place or have taken place.
1.2.8 Limit Cycle
In the Limit Cycle scenario, exposed byMorris & Serabyn(1996), the Galactic Center activity begins when a cloud passes close enough to be captured and starts the accreting processes. This cloud is disrupted and it forms an asymmetrical disk, like the observed CND. Instabilities
1.3. Interstellar medium 13
or inter-clump collisions could, in a relatively short period (104 yr), transfer gas into the central potential well defined by the central star cluster (0.2<r<1.2 pc). This inflow would then be accreted by the central compact object or would contribute to the star formation. The following phase would be a windy period with radially propagating winds, radiation and energy. Such an outward movement would reverse the flow through winds (from O and Wolf-Rayet) and high mass outflow. Gas clouds would be pushed away and be mixed with the orbitally moving gas preventing it from falling inwards. As stars evolve (few 106 yr) they would explode in Supernovae. At this point a fraction of the gas would be able to start falling inward again, pushing against the central stars wind.
According to the described situation, the windy phase is the phase in which the Galactic Center is observed now. Since the gas is not smoothly distributed it could be the sign that there are recurrent periods of the SMBH accretion. The possible scenario to describe the Galaxy is thus an oscillation between Seyfert and starburst periods, separated by a quiet period.
1.3
Interstellar medium
While on one hand star formation is considered to be the motor of galaxy evolution, on the other hand the space amid stars is filled with very structured and varied gas and dust. The interstellar medium (ISM) plays a fundamental role in every phase of star formation as well as in all the processes taking place in galaxies (Dalgarno 2000). The center of the Milky Way galaxy is no exception in that respect. A very complete description of ISM properties and physics is provided by R. Pogge notes1 and Tielens (2010). A very complete review on molecular hydrogen is provided byHabart et al.(2005).
Having R. Pogge notes as basis, in the following sections, a brief summary of the ISM main features will be given, focusing on its most abundant molecule: H2.
1.3.1 Studying the ISM
The first evidence of the existence of a gas pervading the space amid stars has been inferred in the 19th century thanks to the observations of nebulae where the clouds cannot be resolved in individuals stars (for example the diffuse nebula of Orion).
The bright and diffuse nebulae are, in fact, regions where the gas surrounding a hot star is photoionized by its radiation. It is the case of H II regions where the interstellar gas is
ionized and heated by the UV radiation produced by O and B stars. In planetary nebulae the excitation mechanism is similar but the origin of the UV radiation is a white dwarf illuminating the ejected stellar envelopes in a dying star. In the case of Supernova remnants, the gas is ionized by the passage of the shock wave expanding into the ISM of Supernova type I or II; in this case the heating is mechanical. However 90% of the H+ is located outside HIIregions, in
the warm ionized medium.
H2 is the most abundant, but also the most elusive molecule in the ISM. First observations of interstellar H2 were made in the 70s as absorption UV lines towards hot stars. Later
1
H2 rotational-vibrational collisionally-excited lines were observed in the NIR. However most of the cold (10 K) H2 remains invisible.
The satellite IRAS, ISO, SPITZER, HERSCHEL, WMAP and COBE have observed the ISM in the infrared and in the far-infrared providing maps of dust and molecular emission of the Galaxy and of other galaxies.
1.3.2 Physics of the ISM
In general the ISM is far from being at thermal equilibrium and it is characterized by different thermal phases. Even though there is no thermal equilibrium, other equilibriums may apply: kinetic equilibrium in cold neutral clouds, excitation equilibrium for population that follows a Boltzmann distribution, ionization equilibrium when the photoionization equilibrates recom-bination and pressure equilibrium between cold and warm components. The gas is generally at pressure equilibrium, at least at large scales, especially for the atomic medium.
The ISM gas phase is composed for 90% of hydrogen, 10% helium, 0.1% of metals and is present in different phases (Molecular clouds, HIabsorption/emission, H IIemission).
Molec-ular clouds are primarily composed of H2, at 10–20 K with a density of 103 cm−3 on average
but they are mainly traced by CO emission lines. Warm ionized medium of H IIregions have
temperatures between 6 000 K and 12 000 K with a density of 0.1 cm−3 in 25% of the volume. This gas can be traced by recombination lines such as Hα and radio Bremsstrahlung emission. Dust is mixed in all these phases (except the hottest) and plays a fundamental role in each. It is the cause of interstellar extinction and the site of interstellar chemistry, especially of H2 formation. Dust grains are produced by stars in their post-AGB phase while expelling their envelope. The composition of grains and their size distribution are rather well known thanks to various observational constraints. It consists of a mixture of carbonaceous and silicate grains with a wide range of sizes (from 1Å to few microns). Wavelength-dependent extinction by dust grains through scattering and absorption results in the obscuration and reddening of objects.
1.3.3 Molecular clouds structure and properties
Most of the knowledge on clouds has been acquired through CO observations which showed that the clouds are very clumpy. They have dense cores of typical size <1 pc and a density of >106 cm−3. The clouds have a size in the range 3–20 pc and a mean density of 103−4 cm−3. Clouds are generally organized in larger complexes of 20 –100 pc with masses up to 104−6M .
1.3.4 Molecular hydrogen
Molecular hydrogen is the stable form of H at low temperatures and it dominates the ISM. It plays an important role in processes regulating star formation and the evolution of galaxies since:
• It represents the earliest stage of condensation of ISM matter to form stars; • Formation of H2 on grains initiates the chemistry of interstellar gas;
1.3. Interstellar medium 15
Moreover many competing mechanisms could contribute to its excitation and thus it can probe a wide range of distinct environments.
H2 forms on dust grains starting at 10 K and can be destroyed by UV. For H2 to exists there has to be a sufficiently large regions shielding it from UV photons (AV ∼0.01–0.1 mag). Being a highly symmetric molecule, it has no permanent dipole moment and only electric quadrupole transitions may occur with small transition probabilities (A-values) and high ex-citation energies. Therefore H2 is excited only at high temperature or in strong UV radiation fields. H2 lines are thus generally of negligible intensity except in unusually warm regions (500–1000K), like near hot stars and active star forming regions.
According to Combes & Pineau Des Forets(2000), most of H2 may hide in cool, shielded regions where the excitation is too low to be detected through emission lines. These peculiarities make H2 detectable only in particular environments, as studied in the present work, while the bulk molecular gas is generally studied through CO. The formation of this molecule occurs under specific conditions, which are favorable for H2 formation too. H2 is thus estimated from
observed quantity of CO, in particular the CO J=1-0 line at 2.6 mm.
Otherwise H2 is directly observable in two cases. The first case is the absorption at far-UV wavelengths in the diffuse ISM. This is the only direct proof of the cold H2 which represents most of the ISM. The second case is the NIR emission of rotational-vibrational lines in warm regions (500–2000 K) where H2 is excited by shocks or UV-fluorescence. H2 have been mostly studied in the 2.12µm rotational-vibration line 1-0 S(1). This line has been mainly detected in shock regions and PDRs.
The detection and study of NIR H2 emission in the central parsec is the main subject of this thesis. A brief introduction on its physical properties is given in the following sections. A more detailed discussion on its excitation mechanisms will be provided in Chapter4.
1.3.4.1 NIR vibrational rotational emission lines
Each electronic state has a set of rotation-vibration levels which are characterized by a vibra-tional quantum number, v, and a rotational quantum number, J. Permitted transitions are listed in Table1.1.
name ∆J
O -2
Q 0
S +2
Table 1.1: Rotational-vibrational transitions notation isvupper− vlower X(Jl) where X = O, Q,
S of table above and∆J = Jupper− Jlower. The first is 0-0 S(0) at 28.2 µm, the others are at
shorter wavelength and higher energies. Pure rotational transitions are found down to 3.4µm followed by vibrational-rotational lines in the range 1–4µm, clustering around 2 µm.
The H2 molecule has two spin states: the ortho (triplet) state, with parallel nuclear spins, and the para (singlet) state, with anti-parallel nuclear spins. Odd-numbered transition lines correspond to ortho states while even-numbered transitions match para states. For thermalized
populations the ortho-para ratio (OPR) is 3, following the spin statistics. There are several observations which report OPR different from 3 (Fuente et al. 1999, for instance). Deviations from this ratio can appear for radiative de-excitation from the Lyman-Werner bands which are the sign for UV excitation (fluorescence). Sternberg & Neufeld(1999) pointed out that, in the case of fluorescence, a OPR smaller than 3 is the result of different optical depth, in the UV-pumping, for ortho- and para-H2. Nevertheless OPR could be actually smaller than 3 as
the result of dynamical processes bringing colder gas into the PDR, or to fast conversion from ortho- to para-H2 during the molecule formation on grains surface (Le Bourlot 2000).
1.3.4.2 Excitation
For excited H2to be detectable, the excitation temperature has to be >1000 K. Excitation can be probed by excitation diagrams, where the column density of a state is plotted against the corresponding upper state energy (see Chapter 4, Sect. 4.2).
The possible excitation mechanisms are the following:
Collisional excitation: in this case the gas is heated by shocks. It affects low-J levels, exciting the molecule in a bottom-to-the top way. It happens for shocks at a speed greater than 6 km s−1 but lower than 25 km s−1; above such speed the shock would dissociate the molecule. The typical resulting temperature is around 1000 K but lower than 4000–5000 K. Little emissions is produced from transitions with v ≥3. Fe ii often traces shock regions as well; thus a correlation between the spatial distribution of the two species should be an indication of this excitation mechanism. For high density the population is thermalized and the kinetic temperature approaches the physical excitation temperature of the gas. A range of temperatures is also possible while integrating on the line of sight. Below a certain (critical) density, the population levels starts to deviate from thermal equilibrium. This density depends on the colliders: for H2–H2 collisions it is 105−6 cm−3, for H0 it is 103 cm−3.
UV fluorescence: this excitation happens in the neighborhood of stars emitting mainly UV and it depends strongly on the UV intensity. A UV photon is firstly absorbed in the Lyman/Werner bands. Then this excitation is followed by a radiative de-excitation into the ground state. Some of this de-excitation (∼12%) will go into the dissociation band while the rest will go to bound levels, resulting in a pumping of the population. The excitation temper-ature of rotational states, within a given vibrational level, is different from the tempertemper-atures among different vibrational levels, given a rotational state. The excitation diagram can thus be split in distinct diagrams with separate curves by vibrational state, as the result of the different effects on different v-levels. On the contrary, in collisional shocks, these temperatures are the same. Another signature of this kind of excitation is a significant populations level for lines with v>4. However sometimes it is difficult to distinguish between collisional excitation and fluorescence because under certain conditions they can give similar diagrams.
Formation excitation: when a H2 molecule is formed, the resulting binding energy has to be redistributed between heating of the dust grain, kinetic energy ejecting the molecule,
1.3. Interstellar medium 17
and excitation of the newly formed H2 (see Sect. 1.3.4.3). This can result in the excitation of rotational-vibrational states.
1.3.4.3 Formation and destruction
The most common formation process is grain surface catalysis. This process implies a H colliding on a dust grain, where it sticks. This requires that the grain is not too hot, as high temperatures would lower the atom adherence to the grain. The H atom migrates on the grain until it reaches a site where it is more strongly bounded (by chemisorption or physisorption). Here, it more likely sticks long enough to encounter another H atom and reacts to create H2 releasing a 4.5 eV energy. This energy heats the grain (resulting in a IR emission from dust later), ejects the molecule and/or gives vibrational energy to the molecule which is later radiated away as NIR emission.
The most efficient H2destruction is via the absorption of UV-photons. However, the photon absorption leads to dissociations only in 12% of the cases while in most of the cases it produces fluorescence excitation.
Starting from column densities of N =1014cm−2 and then scaling as the N3/4, Lyman and Werner bands start to become optically thick. All photons that could photodissociate the molecule are absorbed in the outer layer of the cloud, shielding the H2 material within it. Dust also plays a role in shielding the molecular hydrogen from absorbing photons. Self-shielding allows H2 to survive in the UV radiation field of the diffuse ISM. This effect happens in diffuse clouds exposed to the interstellar radiation field (ISRF) and in dense clouds, close to UV sources (e.g. H ii regions, reflection nebulae around early type stars).
1.3.5 Photon dominated regions
In a photon dominated region (PDR), the UV radiation field illuminates the warm and partially ionized surface of molecular clouds. Therefore, PDRs separate the cold gas of the molecular clouds from warm, ionized gas. Here H2 is dissociated into HI. This transition region contains
atomic H as well as H2. Because of the strong relationship between dust and H2, PDRs show far-infrared emission from hot dust as well.
The two main parameters regulating the PDR properties are the UV-radiation intensity and the gas density. The UV field can be provided by discrete sources, like early O and B stars. In this case one will observe HIIregions, separated from H2 by an HI/H IIthin interface. On
the other hand if late type stars, or the ISRF, provide the radiation field, there is little or no H IIand a sharp H I/H2 interface, because of self-shielding. Dust limits UV penetration and
it is the dominating effect at AV > 2. CO is dissociated at the surface of the clouds, again,
because of self-shielding. The temperature peaks at the H/H2 interface where the high-energy photons heat the gas. After this boundary the temperature decreases to 10–100 K.
PDRs are the most important source of H2 emission. At sufficiently high densities (>104 cm−3) H2is maintained in thermal equilibrium and low levels are consistent with a Boltzmann distribution. For a complete review seeHollenbach & Tielens (1999).
1.3.6 Shock regions
Shock regions are sources of H2 emission as well. Among the causes of shocks, one can find
outflows and jets, supernovae and expanding H ii regions (Draine & McKee 1993;Hollenbach & Tielens 1997). The mechanical energy of the shock heats the gas. If the shock does not dissociate the molecules, they can become warm enough to be collisionally excited. Typical temperatures are 2000–3000 K. Orion OMC-1 (Rosenthal et al. 2000) is an example of shock-excited H2 emission.
1.4
Aims of the thesis’s work
Observing the ISM in the Galactic Centre is a challenge due to the large interstellar extinction and the large number of bright, emission line stars. High spectral and spatial resolutions are necessary to disentangle the stellar and interstellar components. Moreover, because of the high extinction due to 8 kpc of dust, the Galactic Center is observable only at longer (infrared and radio) or at shorter (hard X-rays and γ-rays) wavelengths than the visible domain. The development of new instruments and techniques at all wavelengths, over the past decades, has permitted outstanding progresses in the knowledge of the Galactic Center.
The Galactic Center presents many unanswered issues, such as the “paradox of youth” of the S-star cluster. Star formation in this extreme environment should be inhibited by the intense magnetic field and by gravity. Yet many young stars are observed in this region. For what concerns the central parsec scale, the stars were formed in a massive disk. However the question of the formation of S-stars in the central arcsecond remains unanswered.
The low accretion rate of the central BH is not explained either. At present there are no observations of the BH accretion disk. However, the observed emission (NIR and X-ray flares) comes from the close surroundings of the BH. This is the indications that there must exist an accretion structure. New instruments and experiments such as the EHT (Ricarte & Dexter 2015) and GRAVITY (Eisenhauer et al. 2008;Gillessen et al. 2010) will make the most inner region of the Galactic Center accessible.
Another open issue is the motion of the gas from one scale to the other. The problem is to understand the mechanism that causes angular momentum loss and, consequently, provokes the inward fall of the gas.
Even though the stability of the CND is still a matter of debate, if its clumps are unstable, the great velocity differences can easily result in an infall of a cloud into the Central Cavity. In this case the Minispiral would be the result of this infall when the stretched clouds, teared off from the CND – or alternatively swept away by Sgr A East – are illuminated by the strong radiation field. In this inflow process the Northern Arm will probably accrete onto the BH, unless it is eventually swept away by an energetic event, such as the Supernova explosion of one of the evolved stars of the central parsec.
In this picture, the role of the ISM in interaction with the extreme environment of the central parsec, is important to characterize this complex area. The aim of the present work is to study the ISM molecular phase (H2) in an area where the neutral CND leaves space to the ionized Minispiral. H2 is expected to be destroyed in the Central Cavity because of the strong UV radiation. However, it is observed almost everywhere.
1.4. Aims of the thesis’s work 19
More importantly, Gatley et al. (1986) indeed detected molecular gas emission inside the Central Cavity of the CND. The analysis of HCN and O i by Jackson et al. (1993) led to the detection of a large amount of neutral gas associated with the streamers of the Minispiral and several dense and distinct streamers at the edge of the CND. Yusef-Zadeh et al. (2001) detected molecular hydrogen (H2) in the inner edge of the CND.
The purpose of this work is to make a step further and extend the search and study of H2in
the central parsec, characterizing the gas distribution, dynamics and excitation with the best angular resolution. In particular, spectro-imaging data in the NIR, taken with integral-field spectrograph SPIFFI (VLT/SINFONI without the adaptive optic) has been analyzed. The observations are seeing-limited (FWHM 0.7500), and at a spectral resolution R = 1 300. In this dataset we detect half-a-dozen of rotation-vibrational H2 line which allow us to separate the gas emission from discrete sources and to study spatial distribution, dynamics and excitation of the molecular gas.
In Chapter2we present the observations, the applied calibration and the analysis methods applied, in particular the original regularized 3D-fitting method. In Chapter3 this method is applied on some of the detected H2 lines to study the distribution and dynamics of the gas. Maps of the line flux, radial velocity and line width are provided. In this same Chapter the extinction is computed through the ratio of two of the observed lines and a model to describe its local and foreground effect is proposed. In Chapter4 all detected lines are simultaneously analyzed through a more classical 1D fit to characterize the gas excitation, temperature and mass on several zones across the field and investigate the CND and Central Cavity physical conditions. In Chapter5we give a summary of the findings of this work to draw the conclusions and perspectives.
Chapter 2
Dataset and Analysis method
Contents
2.1 Dataset . . . 22
2.1.1 Integral field spectroscopy . . . 22
2.1.2 SPIFFI instrument . . . 23
2.1.3 Observations . . . 26
2.2 Calibration . . . 30
2.2.1 Relative calibration . . . 30
2.2.2 Photometric calibration . . . 32
2.2.3 Final calibration factor and uncertainty . . . 33
2.2.4 Continuum subtraction . . . 36
2.3 Analysis methods: regularized 3D-fitting of spectroscopic data . . . . 38
2.3.1 Regularized 3D-fitting . . . 39
2.3.2 Hyper-parameters tuning . . . 40
2.3.3 Uncertainties . . . 48
2.4 Instrumental line width. . . 49
2.5 Analysis methods: multiline analysis . . . 54
2.5.1 Simultaneous fit of spectral lines . . . 54
2.5.2 Uncertainties . . . 55
This chapter is devoted to the description of the dataset that we have used and the methods that we have applied.
The present work consists in the analysis of one specific NIR spectro-imaging dataset. Spatially and spectrally resolved observations are of great interest for the understanding of the Galactic Center region. The combination of spatial and spectral resolution is required to disentangle separate contributions from distinct sources which are often spatially overlapping in this crowded environment. A spectro-imaging dataset is thus well suited for the study of ISM: it allows to access detailed spectral information of a spatially extended source (such as the ISM).
In the previous Chapter it has been discussed that the observation of H2 emissions lines is possible only in a particularly warm environment. The Galactic Centre is an example of such an environment: a quick look at the dataset, before any treatment, shows that some of these H2 lines are clearly detectable in the central parsec.
The dataset spectral range covers several H2 lines but sometimes the emission has a very low signal-to-noise ratio. To overcome this problem, a new method is applied: the regularized
3D-fit (Paumard et al. 2014b). It consists in a global fit of an observed line over the field of view, taking into account the fact that neighboring pixels must be correlated.
In additions to this method a more classical fitting analysis is applied on some selected regions for lines that do not present a signal-to-noise high enough in the whole field.
2.1
Dataset
The dataset was acquired during the first observing runs of the integral field spectrograph SPIFFI (Eisenhauer et al. 2000) as a guest instrument at the VLT in March and April 2003.
Figure 2.1: Illustration of a typical integral field spectroscopy data cube. There are two spatial-dimensions and one spectral-dimension, i.e. a spectrum corresponds to every pixel of the field of vied. Credits: Stephen Todd (ROE) and Douglas Pierce-Price (JAC), http: //ifs.wikidot.com/what-is-ifs.
2.1.1 Integral field spectroscopy
Integral field spectroscopy (IFS) allows gathering spectra of a two-dimensional field of view. The dataset final format is that of a data cube, with two spatial dimensions and one spectral dimension (c.f. Fig. 2.1). It means that a spectrum corresponds to each spatial pixel of the 2D observed field.
The classical imaging spectroscopy uses scanning techniques. Wavelength scanning tech-niques are used to observe a large field of view, obtaining restricted wavelength ranges. Slit scanning instead allows to obtain a larger spectral range, but only for a small field of view. The main problem of these techniques is that data has to be taken in a temporal sequence. In the NIR, especially for the study of extended sources, this causes many difficulties because of


![[PDF] Cours de systèmes d’exploitation informatique PDF - Cours maintenance PC](data:image/gif;base64,R0lGODlhAQABAIAAAP///wAAACH5BAEAAAAALAAAAAABAAEAAAICRAEAOw==)