Short term effect of delayed-onset muscle soreness on trunk proprioception during force reproduction tasks in a healthy adult population: a crossover study
Authors informations:
Mariève Houle1, Catherine Daneau2, Arianne Lessard1, Marie-Andrée Mercier1, Martin Descarreaux1, Jacques Abboud1
1.Department of Human Kinetics, Université du Québec à Rivières, 3351 Boul. des Forges, Trois-Rivières, Qc, G8Z 4M3, Canada
2. Department of Anatomy, Université du Québec à Trois-Rivières, 3351 Boul. des Forges, Trois-Rivières, Qc, G8Z 4M3, Canada
Corresponding author: Jacques Abboud, 3351, boul. des Forges, C.P. 500, Trois-Rivières, Qc, Canada, G8Z 4M3. Telephone number: +1 (819) 376-5011 ext 3783. E-mail: [email protected]
Conflict of Interest Statement: There is no conflict of interest.
Funding: This research received funding from Natural Sciences and Engineering Research Council of Canada (NSERC). 3 4 5 6 7 8 9 10 11 12 13 14 15 16 17 18 19 20 21 22 23 24 25 26 27 28 29 30 31 32 33 34 35 36 37 38 39 40 41 42 43 44 45 46 47 48 49 50 51 52 53 54 55 56 57 58 59 60 61
Abstract: 1
Purpose: The aim of this study was to evaluate the effects of lumbar muscle delayed-onset muscle 2
soreness (DOMS) on the ability of the trunk muscles to reproduce different levels of force. 3
Methods: Twenty healthy adults (10 males and 10 females) were recruited for this study. Force 4
reproduction in trunk extension and flexion was assessed at 50 and 75% of participants’ maximal 5
isometric voluntary contraction in flexion and extension before and after a lumbar muscle DOMS 6
protocol. Trunk proprioception was evaluated and compared between these conditions using different 7
variables such as constant errors (CE), absolute errors (AE), variable errors (VE) and time to peak force 8
(TPF). For each variable, repeated measure ANOVAs were conducted. 9
Results: AE were higher when participants had to reach the target post-DOMS protocol in extension 10
compared to flexion and in presence of higher demand of force (p=0.02). For VE, results showed that 11
participants were more variable in extension than in flexion when the required force was higher (p=0.04). 12
CE variable was higher when participants had to reach the force target in extension compared to flexion 13
under the effect of DOMS (p=0.02). Results also showed that participants took less time to reach the force 14
target post-DOMS protocol in extension (0.62 ± 0.20 sec) and in flexion (0.53 ± 0.19 sec) than pre-DOMS 15
protocol in extension (0.55 ± 0.15) and in flexion (0.50 ± 0.20) (p<0.001). 16
Conclusion: Lumbar muscle DOMS affect trunk proprioception during force reproduction tasks 17
especially in trunk extension and at higher force. 18
Keys words: Delayed-onset muscle soreness, lumbar, sensorimotor control, pain, proprioception 19 20 21 22 23 24 25 26 4 5 6 7 8 9 10 11 12 13 14 15 16 17 18 19 20 21 22 23 24 25 26 27 28 29 30 31 32 33 34 35 36 37 38 39 40 41 42 43 44 45 46 47 48 49 50 51 52 53 54 55 56 57 58 59 60 61
List of abbreviations 27
DOMS: Delayed-onset muscle soreness 28
MVC: Maximum voluntary contraction 29
IPAQ: International physical activity questionnaire 30
CE: Constant error 31
AE: Absolute error 32
VE: Variable error 33
TPF: Time to peak force 34 35 36 37 38 39 40 41 42 43 44 45 46 47 48 49 50 51 52 53 54 55 56 4 5 6 7 8 9 10 11 12 13 14 15 16 17 18 19 20 21 22 23 24 25 26 27 28 29 30 31 32 33 34 35 36 37 38 39 40 41 42 43 44 45 46 47 48 49 50 51 52 53 54 55 56 57 58 59 60 61
Introduction 57
58
Delayed-onset muscle soreness (DOMS) can be defined as musculoskeletal pain and soreness and 59
as a sensation of discomfort (Cleak and Eston 1992) that lasts for several days (Weerakkody et al. 2001) 60
and that is induced by unusual intense exercises and/or eccentric contractions (Coudreuse et al. 2004; 61
MacIntyre et al. 1995; Proske et al. 2003). The DOMS effects peak between 24 to 72 hours following 62
those exercises and disappear progressively in three to five days (Cheung et al. 2003; Coudreuse et al. 63
2004). DOMS is usually associated with inflammation and muscle damage and individuals presenting 64
DOMS can experience muscle stiffness, pain and/or movement restrictions (Farias-Junior et al. 2019) and 65
a decrease of maximal muscle strength (Abboud et al. 2019). Effects of DOMS on proprioception are 66
characterized by a significant increase in errors in upper limb positioning and force reproduction tasks 67
(Proske et al. 2003), suggesting that, when muscles become sore in the presence of DOMS or following 68
paralysis, the motor command sent to muscles is not relevant to the desired outcome. Proprioception 69
includes the sense of limb position and movement, and the sense of force and effort (Jerosch and Prymka 70
1996). Proprioception can be evaluated by repositioning tasks and force reproduction tasks, which mainly 71
assess conscious proprioception (Hagert 2010). 72
Trunk proprioception in lumbar muscles as well as abdominal muscles can be altered in patients 73
with chronic or recurrent low back pain (Hodges and Richardson 1999; Rausch Osthoff et al. 2015; Tong 74
et al. 2017). However, because of within- and between- patient variability in motor behaviour (van Dieen 75
et al. 2017), drawing conclusion about the mechanism underlying proprioception alterations in this 76
population is still challenging. Lumbar muscle DOMS is therefore a relevant experimental pain model 77
because of its ability to recreate altered motor functions, such as a decrease in lumbar muscles strength 78
and an increase of fear of pain (Abboud et al. 2019; Bishop et al. 2011), which are also observed in lumbar 79
muscles of patients with chronic or recurrent non-specific low back pain (Hodges and Danneels 2019). 80
Furthermore, using DOMS as a pain model may help clarify the mechanism underlying 81
proprioception alterations in patients with low back pain. Therefore, the aim of this study was to evaluate, 82
in a healthy adult population, the effects of lumbar muscle DOMS during different force reproduction 83 4 5 6 7 8 9 10 11 12 13 14 15 16 17 18 19 20 21 22 23 24 25 26 27 28 29 30 31 32 33 34 35 36 37 38 39 40 41 42 43 44 45 46 47 48 49 50 51 52 53 54 55 56 57 58 59 60 61
conditions. We hypothesized that trunk proprioception in the direction of extension will be more altered 84
than in flexion and that this alteration will increase with higher force demand (della Volpe et al. 2006; 85
Proske et al. 2003). 86
87
Materials and Methods 88
Study design
89
We conducted a crossover study at the University [XXX] Laboratory. Recruitment and data 90
collection were completed from May to July 2018. 91
Participants
92
Twenty healthy adults, 10 females and 10 males, were recruited among the university community 93
and employees and by social medias. To be included in the study, participants had to be back pain free. If 94
they have experienced recurrent back pain or occasional pain in the last six months, they were not allowed 95
to participate in this study. Other exclusion criteria were health conditions such as neuromuscular 96
diseases, uncontrolled hypertension and heart disease, or cancer. Pregnant women were also excluded. 97
The study was approved by the University humans research ethics board (CER-18-245-07.10) and written 98
informed consent was obtained from each participant before the beginning of the experiment. Participants 99
were advised that they had the possibility to withdraw from the study at any moment. 100
Experimental protocol
101
The experimental protocol was divided into two sessions separated by 24 to 36 hours. The period 102
between the first and the second session was based on a previous study showing that pain and soreness 103
following a lumbar muscle DOMS protocol peaks between 24- and 36 hours (Abboud et al. 2019). In the 104
first session, participants were asked to fill in one questionnaire. Then, isometric muscles trunk extension 105
and flexion maximum voluntary contraction (MVC) and different force reproduction tasks were evaluated 106
for each participant. Finally, participants were asked to perform the lumbar muscle DOMS protocol. In 107 4 5 6 7 8 9 10 11 12 13 14 15 16 17 18 19 20 21 22 23 24 25 26 27 28 29 30 31 32 33 34 35 36 37 38 39 40 41 42 43 44 45 46 47 48 49 50 51 52 53 54 55 56 57 58 59 60 61
the second session, trunk extension and flexion MVC and force reproduction tasks were assessed again. 108
A timeline for clinical and physical outcome assessment is presented in Figure 1. 109
110
[Insert figure 1. about here] 111
112
Questionnaire
113
To assess level of physical activity, participants were invited to complete the short version of the 114
International Physical Activity Questionnaire (IPAQ). Reliability and validity of the IPAQ short form 115
have been tested in over twelve countries (Craig et al. 2003). This questionnaire is composed of 9 items 116
assessing the intensity of physical activity habits in the past week (Lee et al. 2011). 117
Force reproduction tasks
118
All force reproduction conditions were performed on an isokinetic device (The LIDO Active 119
Loredan Biomedical, West Sacramento, CA). Participants were semi-seated in a neutral position and they 120
were attached to the device with four belts (Figure 2). Neutral position was defined as natural spine curve, 121
hip angle was ~135° and knees were in full extension to minimize the contribution of lower limbs muscles 122
and to better isolate trunk muscles during the force reproduction tasks. In fact, it has been shown that the 123
pelvic stabilization increases the recruitment of low back muscles and decreases the contribution of hip 124
extensors during dynamic lumbar extensions (da Silva et al. 2009). One belt was placed over the chest, 125
another one was over the upper abdomen and the last two were over the hips and on the thighs. At first, 126
three MVC were realized for both flexion and extension. The highest value of MVC for flexion and 127
extension was used for the force reproduction tasks. Participants were free to experiment flexion and 128
extension on the isokinetic device to familiarize with the equipment before performing MVC. For the 129
flexion MVC, participants were told to push as hard as they can for 5 seconds against a resistance located 130
at the sternum. For the extension MVC, the middle of the resistance was placed on the eighth thoracic 131
vertebra. Then, trunk force reproduction was assessed in four conditions: trunk flexion and extension at 132 4 5 6 7 8 9 10 11 12 13 14 15 16 17 18 19 20 21 22 23 24 25 26 27 28 29 30 31 32 33 34 35 36 37 38 39 40 41 42 43 44 45 46 47 48 49 50 51 52 53 54 55 56 57 58 59 60 61
50% and 75% of MVC. Each condition of the force reproduction task was conducted both with and 133
without visual feedback. The condition’s order was randomized using computer random number generator 134
(randomization.com) to minimize possible learning effects and residual muscle fatigue. Prior to recording 135
the force reproduction task without visual feedback, practice trials within a 10% margin error of the target 136
goal were allowed to each participant to get familiar with the task. Practice trials were stopped when 10 137
consecutive trials were performed within the margin of error. Participants were then asked to reproduce 138
10 trials of the same force level without visual feedback (Figure 3) and analyses were conducted 139
considering these 10 repetitions without feedback. Participants were given a one-minute rest period 140
between conditions to limit the occurrence of muscular fatigue. For all trials, participants were asked to 141
provide a single impulse without correcting the force once the contraction was initiated. Participants were 142
instructed to perform the task as quickly as possible. 143
144
[Insert figures 2 and 3 about here] 145
146
DOMS protocol
147
First, participants completed three MVC in trunk extension on a 45-degrees Roman chair to 148
evaluate lumbar extensors maximal strength (Figure 4; (Lariviere et al. 2011; Parreira et al. 2013). They 149
had their trunk parallel to the floor in a prone position and were asked to push as hard as possible against 150
a belt installed over the participant’s shoulders. A load cell (Model IPM250; Futek Advanced Sensor 151
Technology Inc, Irvine, CA, USA) was connected to the belt and gave indications about peak torque in 152
trunk extension. The highest MVC value was used to determine a 10% external weight which was used 153
for the entire endurance DOMS protocol. Then, participants were invited to complete the DOMS protocol 154
that targeted low back muscles. The lumbar muscle endurance DOMS protocol was performed on the 45-155
degrees Roman chair in the same position used to establish MVC. In fact, participants initiated the DOMS 156
protocol in a horizontal position with their trunk parallel to the ground. This protocol consisted of 5 sets 157
of 20 repetitions of trunk flexion-extension with the 10% external weight in the hands and with two 158 4 5 6 7 8 9 10 11 12 13 14 15 16 17 18 19 20 21 22 23 24 25 26 27 28 29 30 31 32 33 34 35 36 37 38 39 40 41 42 43 44 45 46 47 48 49 50 51 52 53 54 55 56 57 58 59 60 61
minutes of rest between each set. A repetition consisted of (1) three seconds 30-degrees trunk flexion 159
from horizontal (2) three seconds of isometric contraction and (3) one-second trunk extension starting 160
from the flexion position to 30-degrees trunk extension from the horizontal (head, trunk and lower limbs 161
needed to be in a neutral alignment). There were two indicators placed to help participants to complete 162
the task adequately: one at 30-degrees trunk extension position and one at 30-degrees of trunk flexion. 163
Participants hips and ankles were stabilized using straps to minimize pelvic tilt movements, which could 164
limit the contribution of muscle groups other than paraspinal muscles during the DOMS protocol. A visual 165
and auditory feedback was provided for participants during the protocol to help them following the tempo 166
(3-3-1). Participants were motivated by verbal encouragements given by the assessors. The validation of 167
the DOMS protocol was performed in a previous study (Abboud et al. 2019). 168
169
[Insert figures 4 about here] 170
171
Pain and Soreness Assessment
172
Lumbar muscle pain and soreness were assessed via text messages or emails sent to participants 173
immediately following the first session (DOMS protocol). Text messages or emails were sent by one 174
evaluator and this evaluator was not implicated neither in the lumbar muscle DOMS protocol and in force 175
reproduction tasks. This evaluator was also naïve to expected results of the study. Data collection was 176
completed over five consecutive days, three times a day. Participants received the message at 9 am, 3 pm 177
and 9 pm (Figure 1). Participants were asked to rate the intensity of both lumbar muscle pain and lumbar 178
muscle soreness using a 0-10-point scale. They were also asked to report any other side effects while 179
answering daily text messages. During these five days, participants were asked to avoid any high intensity 180
or unusual exercise or medication aiming to reduce pain or soreness. Based on the pain and soreness 181
scores of each participant, the time it takes to higher level of pain and soreness were computed using the 182
average time until the occurrence of the highest pain and soreness scores. 183 4 5 6 7 8 9 10 11 12 13 14 15 16 17 18 19 20 21 22 23 24 25 26 27 28 29 30 31 32 33 34 35 36 37 38 39 40 41 42 43 44 45 46 47 48 49 50 51 52 53 54 55 56 57 58 59 60 61
Dependent Variables
184
Constant error (CE), absolute error (AE), variable error (VE) and time to peak force (TPF) were 185
calculated and compared between each condition (50% and 75% in extension and flexion) and each 186
session (pre-DOMS and post-DOMS). These four variables are commonly used to assess trunk 187
proprioception (Abboud et al. 2018; Boucher et al. 2015; Lee et al. 2010; McNair and Heine 1999). CE 188
was the positive or the negative difference between the force value deployed by participants and the 189
targeted force identified based on 50 or 75% of participants’ MVC in extension or in flexion. AE was the 190
absolute difference between the force value deployed by participants to reach the target and the force 191
identified as the target. VE was defined by the peak force reach consistency compared with the average 192
score of participants. TPF represented the time needed by participants to reach the force target. 193
Statistical Analysis
194
Analyses were performed using STATISTICA statistical package version 10 (Statsoft, Tulsa, 195
OK), and the level of significance was set at p ≤0.05. Normality of distribution was assessed with the 196
Kolmogorov–Smirnov test and by visual inspection. A mixed model three-way repeated measure 197
ANOVAs were conducted to assess for each dependent variable: (1) the direction effect (flexion versus 198
extension); (2) the force intensity effect (50 versus 75% MVC); (3) the DOMS effect (pre- versus post-199
DOMS); and (4) all the interaction effects. When necessary, the Tukey post-hoc test was performed as 200
the post-hoc analysis for pairwise comparisons. Effects size of significant difference were calculated using 201
partial eta-squared (0.01 = small effect; 0.06 = medium effect; 0.14 = large effect). 202 203 Results 204 Baseline demographics 205
Twenty participants (10 females and 10 males) were included in the study and completed the 206
protocol. Mean scores and standard deviation were calculated for all clinical and physical outcomes and 207
are presented in Table 1. All participants experienced pain and/or soreness in the lumbar muscles. The 208 4 5 6 7 8 9 10 11 12 13 14 15 16 17 18 19 20 21 22 23 24 25 26 27 28 29 30 31 32 33 34 35 36 37 38 39 40 41 42 43 44 45 46 47 48 49 50 51 52 53 54 55 56 57 58 59 60 61
highest pain values were observed approximately 20 hours following the DOMS protocol, while the 209
highest soreness values occurred after 30 hours. Immediately after DOMS protocol, 2 participants 210
reported a light hyperalgesia in the thigh lasting 2 days due to the contact pressure point on the inclined 211
Roman bench. 212
213
[Insert table 1. about here] 214
215
Force reproduction task
216
Dependent variable means and standard deviations for each condition during pre-DOMS and post-217
DOMS protocol are presented in Table 2. ANOVAs results showed significantly higher values for all 218
dependent variables (CE, AE, VE and TPF) in extension when compared to flexion (all ps≤0.01; Table 3 219
and Figure 5). Moreover, a significant DOMS X Direction X Force interaction was found for AE (p=0.02) 220
as illustrated in Figure 6. Results from the post-hoc test showed significantly higher AE value in extension 221
post-DOMS in comparison to flexion post-DOMS protocol at 50% (p=0.046) and 75% (p=0.01). Results 222
also showed a significant influence of force intensities (50% versus 75%), with higher value at 75% MVC 223
for AE (p=0.03) and VE (p=0.04). A significant decrease was shown in TPF (p<0.001) between pre- and 224
post-DOMS protocol. There was also a significant main effect of direction (extension versus flexion; 225
p=0.01) showing that participants were poorer in extension than in flexion to reproduce the task. A
226
significant Direction X Force intensity interaction effect for VE variable was also found (p=0.04) and 227
Tukey post-hoc revealed that participants were more variable at 75% than at 50% in extension for VE 228
(p≤0.003) but not in flexion (p=0.74). Tukey post-hoc also showed that they were more variable in 229
extension than in flexion for both forces (p=0.02 at 50% and p≤0.001 at 75%). Another significant 230
Direction X DOMS interaction effect for the CE variable was observed (p=0.02). Tukey post-hoc showed 231
that CE was higher in extension compared to flexion post-DOMS protocol (p≤0.001). Post-hoc also 232
showed that CE increased in extension post-DOMS protocol compared to flexion post-DOMS protocol 233
(p=0.03). All other results were not statistically significant (Table 3). 234 4 5 6 7 8 9 10 11 12 13 14 15 16 17 18 19 20 21 22 23 24 25 26 27 28 29 30 31 32 33 34 35 36 37 38 39 40 41 42 43 44 45 46 47 48 49 50 51 52 53 54 55 56 57 58 59 60 61
235
[Insert tables 2 and 3 about here] 236
237
[Insert figures 5 and 6 about here] 238
239
Discussion 240
The objective of the present study was to evaluate the effect of lumbar muscle DOMS on trunk 241
proprioception during different force reproduction tasks in a healthy adult population. Our hypothesis was 242
that trunk proprioception in the direction of extension would be more altered than in flexion and that this 243
alteration would increase with higher force demand. Results showed that participants (1) were more 244
variable to reproduce forces (VE) in extension than in flexion regardless of the presence of lumbar muscle 245
DOMS; (2) larger force production errors occurred for the higher level of force and more variability in 246
the produced force was present in extension than in flexion; (3) under the influence of DOMS the 247
performance to reach the force target in trunk extension was altered, while it remained unchanged in trunk 248
flexion; (4) participants were faster in the force reproduction tasks under the influence of lumbar muscle 249
DOMS. 250
Trunk Proprioception
251
Across all conditions, force production was observed to be more accurate in flexion compared to 252
extension. Such difference between extension and flexion movement accuracy can be explained by the 253
fact that participants generated higher MVC contractions in trunk extension than in flexion, leading to 254
higher target forces in extension during the force reproduction protocol (more than 2 times higher). In line 255
with this observation, results of the current study also showed differences between force accuracy at 50% 256
and 75% of MVC for both trunk flexion and extension tasks. Participants were more accurate during the 257
execution of force reproduction task at 50% of MVC than to during those performed at 75% of MVC. 258
These results taken together suggest that force variability increases as the target force increases. It has 259 4 5 6 7 8 9 10 11 12 13 14 15 16 17 18 19 20 21 22 23 24 25 26 27 28 29 30 31 32 33 34 35 36 37 38 39 40 41 42 43 44 45 46 47 48 49 50 51 52 53 54 55 56 57 58 59 60 61
been previously shown that, force variability increases linearly with force at moderate levels of force 260
(Sherwood and A. Schmidt 1980). 261
DOMS and Trunk Proprioception
262
Trunk proprioception was altered under the influence of lumbar muscle DOMS, with the 263
observation of higher AE and CE values in trunk extension in comparison to flexion. These findings 264
suggest that DOMS had a direct impact on the proprioception of muscles that have undergone eccentric 265
contractions, while the proprioception of the unaffected muscles (trunk flexors) remained unchanged. 266
Even if not directly assessed in the current study, these observations support the recent views regarding 267
the important contribution of peripheral sensory information in the production of force (Luu et al. 2011; 268
Scotland et al. 2014) and expand it to axial muscles. A recent study showed that, in healthy individuals 269
under the influence of experimental low back pain triggered by a combination of DOMS and hypertonic 270
saline solution, the increase in trunk extensor muscle activity was not accompanied by an increase in trunk 271
flexor muscle activity during postural perturbations (Larsen et al. 2017). These previous results along 272
with those of the present study suggest that minimal or no change in the control of the trunk flexor muscles 273
are necessary to achieve a desired motor outcome, such as trunk proprioception or postural control 274
(Bartlett et al. 2007). 275
However, VE variable was not affected by lumbar muscle DOMS. Such lack of DOMS effect on 276
VE could partially be explained by the participants’ overall level of physical activity. Participants were 277
considered moderately (at least 600 MET-min/week) to highly (3000 MET-min/week) active with a mean 278
score of 2.7 on the short form of the IPAQ questionnaire. It has been proposed that a higher level of motor 279
variability that is functionally related to the task is present in individuals that are physically active which 280
could favour motor performance while limiting the occurrence of muscle fatigue (Bartlett et al. 2007; 281
Robins et al. 2006). It can be hypothesized that under the influence of lumbar muscle DOMS, participants 282
were able to find a new strategy, such as variation in muscle activity, to perform the desired task. This 283
should be addressed in future research to better understand the effect of DOMS in the lumbar region. 284 4 5 6 7 8 9 10 11 12 13 14 15 16 17 18 19 20 21 22 23 24 25 26 27 28 29 30 31 32 33 34 35 36 37 38 39 40 41 42 43 44 45 46 47 48 49 50 51 52 53 54 55 56 57 58 59 60 61
Future studies should also consider exploring the relation between trunk proprioception under DOMS 285
effects and physical activity by including individuals from each active group (sedentary to very active). 286
Difference and Similarities Between DOMS and Low Back Pain
287
As expected, the present results showed that the DOMS protocol induced experimental low back 288
pain and soreness, which is consistent with previous studies (Abboud et al. 2019; Cheung et al. 2003). 289
The presence of DOMS was confirmed by lumbar pain and soreness values of 2.8 and 3.8 respectively, 290
which represent mild pain intensity and moderate soreness intensity. 291
DOMS has been used as a relevant pain model, which is able to reproduce alteration usually 292
present in patients with chronic or recurrent low back pain (Abboud et al. 2019; Bishop et al. 2011). As 293
shown in the present study, mild to moderate pain and soreness in addition to the decrease of 294
proprioception are features of DOMS, which are similar to characteristics also found in chronic or 295
recurrent patients with low back pain. DOMS has been associated with a decrease of muscle strength, 296
muscle power and range of motion due to micro muscle damage (Cheung et al. 2003; Mizumura and 297
Taguchi 2016). These muscle damages can create temporary muscles dysfunctions and perceptions 298
(location in the space and/or strength) and, in the same way, affect performance (Larsen et al. 2017; 299
Paschalis et al. 2007; Pearcey et al. 2015) such as precision of movement (decrease of joint range of 300
motion) and proprioception (Vila-Chã et al. 2011), which can affect the recruitment patterns (Larsen et 301
al. 2017; Pearcey et al. 2015; Vila-Chã et al. 2011). Alteration in trunk proprioception, such as increase 302
of errors in reproduction force task, has been also observed in patients with chronic low back pain 303
(Descarreaux et al. 2007). 304
In the present study, a significant difference in TPF for both flexion and extension tasks were 305
observed between the pre- and post-DOMS protocol. It was recently reported that movements associated 306
with pain are performed faster compared to movements without pain (Karos et al. 2017). Even if 307
participants were statistically faster in pre-DOMS condition, it should be noted that differences between 308
TPF pre- and post-DOMS protocol varied from 30 to 60 milliseconds in flexion and varied from 60 to 70 309 4 5 6 7 8 9 10 11 12 13 14 15 16 17 18 19 20 21 22 23 24 25 26 27 28 29 30 31 32 33 34 35 36 37 38 39 40 41 42 43 44 45 46 47 48 49 50 51 52 53 54 55 56 57 58 59 60 61
milliseconds in extension. In a previous study, participants had to reproduce 50% and 75% of their MVC 310
in flexion and in extension in an isometric condition with their eyes closed. The authors showed that 311
patients with chronic low back pain took ~120 milliseconds longer than the healthy group to reach the 312
force target (Descarreaux et al. 2007). Therefore, it remains unknown if changes in TPF should be 313
considered as relevant functional changes for patients with chronic or recurrent low back pain as healthy 314
participants post-DOMS protocol. Theories of short-term pain adaptations propose that changes in the 315
motor system are related to a protection mechanism, while in the long-term this adaptive behaviour may 316
lead to further problems (Hodges and Tucker 2011; van Dieen et al. 2017). Another explanation for the 317
difference between DOMS and clinical low back pain effects on TPF is the fact that participants in the 318
current study were moderately to highly active, while the group of patients with chronic low back pain in 319
Descarreaux et al., (2007) study were considered as moderately disabled. 320
Limitations and Future Recommendations
321
Participants were mostly young adults moderately to highly physically active, which could have 322
minimized the effect of DOMS. However, they reported levels of back muscle pain and soreness similar 323
to other studies using similar protocol to induce lumbar muscle DOMS (Abboud et al. 2019; Hjortskov et 324
al. 2005), which suggest the occurrence of DOMS in the lumbar muscles. Having a small group of 325
participants with similar characteristics can limit the generalization which may lead to an overestimation 326
of the current results. However, most of the differences of the current results were highly significant 327
(p=0.02 to p<0.001). Adaptations in the muscle recruitment strategy could have occurred under the 328
influence of DOMS to perform the task, as observed in patients with chronic low back pain (Abboud et 329
al. 2019; Falla et al. 2014). In addition, even if there is a rest time between force reproduction task and 330
that force reproduction tasks were randomized, it was impossible to ensure that participants did not have 331
residual fatigue during the experimentation. Future studies should assess lumbar muscle recruitment 332
strategies under the influence of lumbar muscle DOMS to confirm this theory. Future studies also should 333
assess sex-comparison to evaluate if there is differences in strategies used during force reproduction tasks. 334 4 5 6 7 8 9 10 11 12 13 14 15 16 17 18 19 20 21 22 23 24 25 26 27 28 29 30 31 32 33 34 35 36 37 38 39 40 41 42 43 44 45 46 47 48 49 50 51 52 53 54 55 56 57 58 59 60 61
335
Conclusion 336
Lumbar muscle DOMS affect lumbar muscles proprioception during force reproduction tasks 337
especially in extension at higher level of force, while this performance was unchanged in trunk flexion. 338
This study suggests that lumbar muscles proprioception in lumbar muscles has been altered in muscles 339
that have been directly affected by the DOMS effects, supporting the important contribution of the 340
peripheral sensory systems in force reproduction. DOMS represent a relevant pain model to better 341
understand function alterations and pain mechanisms present in complex anatomical systems such as the 342
trunk in patients with chronic and recurrent low back pain. 343 344 345 4 5 6 7 8 9 10 11 12 13 14 15 16 17 18 19 20 21 22 23 24 25 26 27 28 29 30 31 32 33 34 35 36 37 38 39 40 41 42 43 44 45 46 47 48 49 50 51 52 53 54 55 56 57 58 59 60 61
References
346Abboud J, Lessard A, Piché M, Descarreaux M (2019) Paraspinal muscle function and pain sensitivity 347
following exercise-induced delayed-onset muscle soreness European Journal of Applied 348
Physiology doi:10.1007/s00421-019-04117-6 349
Abboud J, Rousseau B, Descarreaux M (2018) Trunk proprioception adaptations to creep deformation 350
Eur J Appl Physiol 118:133-142 doi:10.1007/s00421-017-3754-2 351
Bartlett R, Wheat J, Robins M (2007) Is movement variability important for sports biomechanists? 352
Sports Biomech 6:224-243 doi:10.1080/14763140701322994 353
Bishop MD, Horn ME, George SZ, Robinson ME (2011) Self-reported pain and disability outcomes from 354
an endogenous model of muscular back pain BMC musculoskeletal disorders 12:35 355
Boucher JA, Abboud J, Nougarou F, Normand MC, Descarreaux M (2015) The Effects of Vibration and 356
Muscle Fatigue on Trunk Sensorimotor Control in Low Back Pain Patients PLoS One 357
10:e0135838 doi:10.1371/journal.pone.0135838 358
Cheung K, Hume P, Maxwell L (2003) Delayed onset muscle soreness : treatment strategies and 359
performance factors Sports Med 33:145-164 360
Cleak MJ, Eston RG (1992) Delayed onset muscle soreness: Mechanisms and management Journal of 361
Sports Sciences 10:325-341 doi:10.1080/02640419208729932 362
Coudreuse JM, Dupont P, Nicol C (2004) [Delayed post effort muscle soreness] Ann Readapt Med Phys 363
47:290-298 doi:10.1016/j.annrmp.2004.05.012 364
Craig CL et al. (2003) International physical activity questionnaire: 12-country reliability and validity 365
Med Sci Sports Exerc 35:1381-1395 doi:10.1249/01.Mss.0000078924.61453.Fb 366
da Silva RA, Lariviere C, Arsenault AB, Nadeau S, Plamondon A (2009) Pelvic stabilization and 367
semisitting position increase the specificity of back exercises Med Sci Sports Exerc 41:435-443 368
doi:10.1249/MSS.0b013e318188446a 369
della Volpe R, Popa T, Ginanneschi F, Spidalieri R, Mazzocchio R, Rossi A (2006) Changes in 370
coordination of postural control during dynamic stance in chronic low back pain patients Gait 371
Posture 24:349-355 doi:10.1016/j.gaitpost.2005.10.009 372
Descarreaux M, Lalonde C, Normand MC (2007) Isometric force parameters and trunk muscle 373
recruitment strategies in a population with low back pain Journal of manipulative and 374
physiological therapeutics 30:91-97 375
Falla D, Gizzi L, Tschapek M, Erlenwein J, Petzke F (2014) Reduced task-induced variations in the 376
distribution of activity across back muscle regions in individuals with low back pain Pain 377
155:944-953 doi:10.1016/j.pain.2014.01.027 378
Farias-Junior LF et al. (2019) Psychological responses, muscle damage, inflammation, and delayed 379
onset muscle soreness to high-intensity interval and moderate-intensity continuous exercise in 380
overweight men Physiology & behavior 199:200-209 381
Hagert E (2010) Proprioception of the wrist joint: a review of current concepts and possible 382
implications on the rehabilitation of the wrist Journal of Hand Therapy 23:2-17 383
Hjortskov N, Essendrop M, Skotte J, Fallentin N (2005) The effect of delayed‐onset muscle soreness on 384
stretch reflexes in human low back muscles Scandinavian journal of medicine & science in 385
sports 15:409-415 386
Hodges PW, Danneels L (2019) Changes in Structure and Function of the Back Muscles in Low Back 387
Pain: Different Time Points, Observations, and Mechanisms J Orthop Sports Phys Ther 49:464-388
476 doi:10.2519/jospt.2019.8827 389
Hodges PW, Richardson CA (1999) Altered trunk muscle recruitment in people with low back pain with 390
upper limb movement at different speeds Arch Phys Med Rehabil 80:1005-1012 391 doi:10.1016/s0003-9993(99)90052-7 392 4 5 6 7 8 9 10 11 12 13 14 15 16 17 18 19 20 21 22 23 24 25 26 27 28 29 30 31 32 33 34 35 36 37 38 39 40 41 42 43 44 45 46 47 48 49 50 51 52 53 54 55 56 57 58 59 60 61
Hodges PW, Tucker K (2011) Moving differently in pain: a new theory to explain the adaptation to pain 393
Pain 152:S90-98 doi:10.1016/j.pain.2010.10.020 394
Jerosch J, Prymka M (1996) Proprioception and joint stability Knee Surg Sports Traumatol Arthrosc 395
4:171-179 396
Karos K, Meulders A, Gatzounis R, Seelen HAM, Geers RPG, Vlaeyen JWS (2017) Fear of pain changes 397
movement: Motor behaviour following the acquisition of pain-related fear Eur J Pain 21:1432-398
1442 doi:10.1002/ejp.1044 399
Lariviere C, Da Silva RA, Arsenault AB, Nadeau S, Plamondon A, Vadeboncoeur R (2011) Specificity of a 400
back muscle roman chair exercise in healthy and back pain subjects Med Sci Sports Exerc 401
43:157-164 doi:10.1249/MSS.0b013e3181e96388 402
Larsen LH, Hirata RP, Graven-Nielsen T (2017) Pain-evoked trunk muscle activity changes during fatigue 403
and DOMS Eur J Pain 21:907-917 doi:10.1002/ejp.993 404
Lee AS, Cholewicki J, Reeves NP, Zazulak BT, Mysliwiec LW (2010) Comparison of trunk proprioception 405
between patients with low back pain and healthy controls Archives of physical medicine and 406
rehabilitation 91:1327-1331 407
Lee PH, Macfarlane DJ, Lam T, Stewart SM (2011) Validity of the international physical activity 408
questionnaire short form (IPAQ-SF): A systematic review International Journal of Behavioral 409
Nutrition and Physical Activity 8:115 410
Luu BL, Day BL, Cole JD, Fitzpatrick RC (2011) The fusimotor and reafferent origin of the sense of force 411
and weight J Physiol 589:3135-3147 doi:10.1113/jphysiol.2011.208447 412
MacIntyre DL, Reid WD, McKenzie DC (1995) Delayed muscle soreness. The inflammatory response to 413
muscle injury and its clinical implications Sports Med 20:24-40 414
McNair PJ, Heine PJ (1999) Trunk proprioception: enhancement through lumbar bracing Arch Phys 415
Med Rehabil 80:96-99 416
Mizumura K, Taguchi T (2016) Delayed onset muscle soreness: Involvement of neurotrophic factors 417
The Journal of Physiological Sciences 66:43-52 doi:10.1007/s12576-015-0397-0 418
Parreira RB, Amorim CF, Gil AW, Teixeira DC, Bilodeau M, da Silva RA (2013) Effect of trunk extensor 419
fatigue on the postural balance of elderly and young adults during unipodal task Eur J Appl 420
Physiol 113:1989-1996 doi:10.1007/s00421-013-2627-6 421
Paschalis V, Giakas G, Baltzopoulos V, Jamurtas AZ, Theoharis V, Kotzamanidis C, Koutedakis Y (2007) 422
The effects of muscle damage following eccentric exercise on gait biomechanics Gait & posture 423
25:236-242 424
Pearcey GE, Bradbury-Squires DJ, Kawamoto J-E, Drinkwater EJ, Behm DG, Button DC (2015) Foam 425
rolling for delayed-onset muscle soreness and recovery of dynamic performance measures 426
Journal of athletic training 50:5-13 427
Proske U, Weerakkody NS, Percival P, Morgan DL, Gregory JE, Canny BJ (2003) Force-matching errors 428
after eccentric exercise attributed to muscle soreness Clin Exp Pharmacol Physiol 30:576-579 429
Rausch Osthoff AK, Ernst MJ, Rast FM, Mauz D, Graf ES, Kool J, Bauer CM (2015) Measuring lumbar 430
reposition accuracy in patients with unspecific low back pain: systematic review and meta-431
analysis Spine (Phila Pa 1976) 40:E97-E111 doi:10.1097/brs.0000000000000677 432
Robins R, Wheat J, Irwin G, Bartlett R (2006) The effect of shooting distance on movement variability in 433
basketball Journal of Human Movement Studies 50:217-238 434
Scotland S, Adamo DE, Martin BJ (2014) Sense of effort revisited: Relative contributions of sensory 435
feedback and efferent copy Neuroscience letters 561:208-212 436
Sherwood D, A. Schmidt R (1980) The Relationship Between Force and Force Variability in Minimal and 437
Near-Maximal Static and Dynamic Contractions vol 12. doi:10.1080/00222895.1980.10735208 438 4 5 6 7 8 9 10 11 12 13 14 15 16 17 18 19 20 21 22 23 24 25 26 27 28 29 30 31 32 33 34 35 36 37 38 39 40 41 42 43 44 45 46 47 48 49 50 51 52 53 54 55 56 57 58 59 60 61
Tong MH, Mousavi SJ, Kiers H, Ferreira P, Refshauge K, van Dieen J (2017) Is There a Relationship 439
Between Lumbar Proprioception and Low Back Pain? A Systematic Review With Meta-Analysis 440
Arch Phys Med Rehabil 98:120-136 e122 doi:10.1016/j.apmr.2016.05.016 441
van Dieen JH, Flor H, Hodges PW (2017) Low-Back Pain Patients Learn to Adapt Motor Behavior With 442
Adverse Secondary Consequences Exerc Sport Sci Rev 45:223-229 443
doi:10.1249/jes.0000000000000121 444
Vila-Chã C, Riis S, Lund D, Møller A, Farina D, Falla D (2011) Effect of unaccustomed eccentric exercise 445
on proprioception of the knee in weight and non-weight bearing tasks Journal of 446
Electromyography and Kinesiology 21:141-147 447
Weerakkody NS, Whitehead NP, Canny BJ, Gregory JE, Proske U (2001) Large-fiber mechanoreceptors 448
contribute to muscle soreness after eccentric exercise The journal of pain 2:209-219 449 450 4 5 6 7 8 9 10 11 12 13 14 15 16 17 18 19 20 21 22 23 24 25 26 27 28 29 30 31 32 33 34 35 36 37 38 39 40 41 42 43 44 45 46 47 48 49 50 51 52 53 54 55 56 57 58 59 60 61
Table 1: Participant’s results on clinical and physical outcomes
F: female, M: Male, BMI: Body Masse Index, IPAQ-SF: International Physical Activity (short-form), MVC: Maximal Voluntary Contraction, DOMS: Delayed onset muscle soreness
Outcomes
Experimental Group
(n=20)
Mean ± SD
Demographics
Age (years) 25.5 ± 5.2F : M 10 : 10
Weight (kg) 69.6 ± 14.6
Height (m) 1.7 ± 0.1
BMI (kg/m2) 23.3 ± 2.7
IPAQ-SF 2.7 ± 0.5
Pain
Peak intensity (/10) 2.75 ± 2.27Days with pain 1.65 ± 1.27
Soreness
Peak intensity (/10) 3.80 ± 2.35Days with soreness 2.10 ± 0.91
MCV
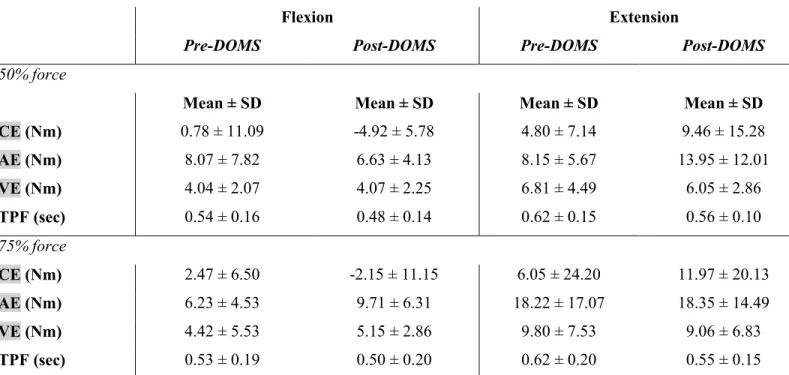
Extension pre-DOMS (Nm) 174.89 ± 78.12 Extension post-DOM (Nm) 178.53 ± 89.14 Flexion pre-DOMS (Nm) 79.60 ± 34.03 Flexion post-DOMS (Nm) 86.18 ± 33.88 4 5 6 7 8 9 10 11 12 13 14 15 16 17 18 19 20 21 22 23 24 25 26 27 28 29 30 31 32 33 34 35 36 37 38 39 40 41 42 43 44 45 46 47 48 49 50 51 52 53 54 55 56 57 58 59 60 61Table 2: Means of errors and time to peak for pre- and post-DOMS in flexion and extension
Flexion Extension
Pre-DOMS Post-DOMS Pre-DOMS Post-DOMS
50% force
Mean ± SD Mean ± SD Mean ± SD Mean ± SD CE (Nm) 0.78 ± 11.09 -4.92 ± 5.78 4.80 ± 7.14 9.46 ± 15.28 AE (Nm) 8.07 ± 7.82 6.63 ± 4.13 8.15 ± 5.67 13.95 ± 12.01 VE (Nm) 4.04 ± 2.07 4.07 ± 2.25 6.81 ± 4.49 6.05 ± 2.86 TPF (sec) 0.54 ± 0.16 0.48 ± 0.14 0.62 ± 0.15 0.56 ± 0.10 75% force CE (Nm) 2.47 ± 6.50 -2.15 ± 11.15 6.05 ± 24.20 11.97 ± 20.13 AE (Nm) 6.23 ± 4.53 9.71 ± 6.31 18.22 ± 17.07 18.35 ± 14.49 VE (Nm) 4.42 ± 5.53 5.15 ± 2.86 9.80 ± 7.53 9.06 ± 6.83 TPF (sec) 0.53 ± 0.19 0.50 ± 0.20 0.62 ± 0.20 0.55 ± 0.15
CE: constant error, AE: absolute error, VE: variable error, TPF: time to peak force, SD: standard deviation, DOMS: Delayed onset muscle soreness
Table 3: Statistical analysis for each dependent variable
CE: constant error, AE: absolute error, VE: variable error, TPF: time to peak force, SD: standard deviation, *significant p values based on ANOVA
Direction
(Di) Force (F) DOMS (Do) Di x F Di x Do F x Do Di x F x Do
CE F=10.75 F=1.32 F=0.001 F=0.003 F=6.32 F=0.22 F=0.0005 *p≤0.001 ηp2=0.36 p=0.26 p=0.97 p=0.95 *p=0.02 ηp2=0.25 p=0.64 p=0.98 AE F=26.96 F=5.61 F=3.17 F=2.76 F=0.57 F=0.02 F=6.18 *p≤0.001 ηp2=0.59 *p=0.03 ηp2=0.23 p=0.09 p=0.11 p=0.46 p=0.88 *p=0.02 ηp2=0.25 VE F=23.82 F=4.92 F=0.29 F=5.00 F=1.84 F=0.18 F=0.48 *p≤0.001 ηp2=0.56 *p=0.04 ηp2=0.21 p=0.59 *p=0.04 ηp2=0.21 p=0.19 p=0.67 p=0.50 TPF F=8.00 F=0.004 F=11.38 F=0.22 F=0.14 F=0.52 F=0.97 *p=0.01 ηp2 =0.30 p=0.95 *p≤0.001 ηp2 =0.37 p=0.64 p=0.71 p=0.48 p=0.34 4 5 6 7 8 9 10 11 12 13 14 15 16 17 18 19 20 21 22 23 24 25 26 27 28 29 30 31 32 33 34 35 36 37 38 39 40 41 42 43 44 45 46 47 48 49 50 51 52 53 54 55 56 57 58 59 60 61
Figure captions
Fig. 1. Timeline for clinical and physical outcomes.
DOMS: delayed-onset muscle soreness, MVC: maximum voluntary contraction.
Fig. 2. Position of participants on lido for trunk strength reproduction task.
Fig. 3. Example of steps of the force reproduction task.
Fig. 4. Position of participants on the 45 degrees Romain chair during the lumbar muscle DOMS protocol.
Fig. 5. Direction effect (extension vs flexion) for each dependent variable (CE, AE, VE and TPF). CE: constant error, AE: absolute error, VE: variable error, TP: time to peak, bars indicate standard deviation.
Fig. 6. ANOVA for interaction between direction, force and DOMS for the AE. Bars indicate standard errors.
4 5 6 7 8 9 10 11 12 13 14 15 16 17 18 19 20 21 22 23 24 25 26 27 28 29 30 31 32 33 34 35 36 37 38 39 40 41 42 43 44 45 46 47 48 49 50 51 52 53 54 55 56 57 58 59 60 61