HAL Id: tel-02375857
https://tel.archives-ouvertes.fr/tel-02375857
Submitted on 22 Nov 2019
HAL is a multi-disciplinary open access
archive for the deposit and dissemination of sci-entific research documents, whether they are pub-lished or not. The documents may come from teaching and research institutions in France or abroad, or from public or private research centers.
L’archive ouverte pluridisciplinaire HAL, est destinée au dépôt et à la diffusion de documents scientifiques de niveau recherche, publiés ou non, émanant des établissements d’enseignement et de recherche français ou étrangers, des laboratoires publics ou privés.
Sofia Korniliou
To cite this version:
Sofia Korniliou. Local heat transfer measurements and aspect ratio influence during flow boiling in microscale. Thermics [physics.class-ph]. Université de Valenciennes et du Hainaut-Cambresis; University of Edinburgh, 2018. English. �NNT : 2018VALE0002�. �tel-02375857�
Thèse de doctorat
Pour obtenir le grade de Docteur de l’Université de
VALENCIENNES ET DU HAINAUT-CAMBRESIS
ET L’UNIVERSITE D’ÉDIMBOURG
Discipline, spécialité selon la liste des spécialités pour lesquelles l’Ecole Doctorale est accréditée :
Mécanique - Energétique
Soutenue par Sofia, KORNILIOU. Le 12/01/2018, à Edinbourg Ecole doctorale :
Sciences Pour l’Ingénieur (SPI)
Equipe de recherche, Laboratoire :
Laboratoire d’Automatique, de Mécanique et d’Informatique Industrielles et Humaines (LAMIH-UMR CNRS 8201)
EBULLITION DANS LES MICRO CANAUX : INFLUENCE
DU RAPPORT D’ASPECT SUR LE TRANSFERT
THERMIQUE LOCAL
JURY
Président du jury
- SERGHIOU, George. MCF. Université d’Édimbourg.
Rapporteurs
- YUYING, Yan. Professeur. Université de Nottingham. - BELLETTRE, Jérôme. Professeur. LTeN, Polytech Nantes.
Examinateurs
- CARLIER, Julien. MCF-HDR. IEMN, Université de Valenciennes.
Directeur de thèse :
- SEFIANE, Khellil. Professeur. IMT, Université d’Édimbourg. .
Co-directrice de thèse :
Experimental Study on Local Heat Transfer
Coefficients and the Effect of Aspect Ratio on
Flow Boiling in a Microchannel
Sofia Korniliou
Volume 1
A thesis submitted for the degree of Doctor of Philosophy.
The University of Edinburgh.
Lay summary
Flow boiling in microchannels is a promising technology for cooling of small-scale devices such as electronic chips, power rectifiers, radar arrays, chemical microreactors that require dissipating heat fluxes of several MW m-2 while maintaining constant temperature at the surface. Although flow boiling in macroscale provides higher performance than single-phase or pool boiling heat transfer, the advantages in microscale have not been yet completely justified. This study aims to assist in the better understanding of some outstanding issues regarding flow instabilities, two-phase heat transfer mechanisms and early dryout that occur in microchannels while increasing their aspect ratios (𝑎). Fully integrated and instrumented silicon multi-microchannel heat sinks of width-to-height aspect ratios from 0.3 to 3 and hydraulic diameters 𝐷ℎ from 50 to 150 μm were developed in order to fully characterise their local heat transfer performance during flow boiling. Local wall temperature measurements were obtained from five thin nickel film temperature sensors with simultaneous pressure measurements and flow visualisation from the top. Uniform heating was achieved with a thin aluminium heater integrated at the back of the microchannels. The effect of 𝑎, mass flux, inlet subcooling temperature and bubble dynamics on two-phase flow boiling local heat transfer coefficient and pressure drop were investigated for constant heat fluxes. Severe pressure and temperature fluctuations in excess of 250 °C were measured at high 𝑎 microchannels. The heat sinks with microchannels of 𝑎 = 1.5 and 𝐷ℎ = 120 μm, achieved the maximum heat transfer performance. High spatial and temporal resolution wall temperature maps were obtained with advanced thermography technique, synchronised with simultaneous high-speed imaging and pressure measurements from integrated miniature piezoresistive pressure sensors inside a high aspect
ratio (𝑎 = 22) transparent Polydimethylsiloxane (PDMS)-based microchannel of 𝐷ℎ =192 μm.
The aim was to produce accurate two-dimensional (2D) high spatial and temporal resolution two-phase heat transfer coefficient maps across the full domain of a single microchannel using FC-72 dielectric liquid. The novel PDMS based microchannel provided measurements in the vicinity of the wall due to the transparency of PDMS to midwave infrared radiation. Synchronised flow visualisation images were related with liquid-vapour distribution of the channel base and were correlated with the two-phase heat transfer coefficient maps in order to elucidate flow boiling instabilities, film thinning during bubble confinement and wetting / rewetting phenomena during annular flow pattern.
iii
Résumé
L’ébullition en micros canaux est une technique de refroidissement très prometteuse
pour les composants en microélectronique. Ces derneirs, de plus en plus miniaturisés,
nécessitent souvent la dissipation de densités de flux importantes, pouvant atteindre
quelques MW m-2 pour maintenir des températures acceptables. L’objet de cette étude
est de mieux comprendre les instabilités des écoulements, le transfert thermique par
changement de phase tout comme l’effet des rapports de forme (a) sur l’apparition de
sites de nucléation à la surface de micro canaux. L’analyse des échanges convectifs
locaux lors de l’ébullition a été réalisée dans le cas de micro canaux de rapport de forme
allant de 0.3 à 3 et de diamètres hydrauliques allant de 50 à 150 μm. Le banc d’essai a
été instrumenté de manière à pourvoir mesurer simultanément les températures de
surface à l’aide capteurs en film mince de nickel, de capteurs de pressions instantanées
et de caméra rapide pour la visualisation du phénomène d’ébullition. Le chauffage du
fluide a été réalisé à l’aide du dépôt en couche mince d’un film résistif en aluminium
directement appliqué à la surface des micro canaux. L’étude expérimentale a permis
d’analyser les phénomènes de changement de phase par ébullition, du transfert
thermique local ainsi que la chute de pression de l’écoulement. En particulier, le travail
expérimental a permis de mettre en évidence les effets sur le transfert, du rapport de
forma a, de la température de sous refroidissement du fluide à l’entrée des canaux et de
la dynamique de formation et de grossissement des bulles. Des fluctuations importantes
de pression et de températures ont été enregistrées pour des températures de surfaces
avoisinant les 250°C. Les micro canaux avec a= 1.5 et Dh=120mm, correspondent à la
configuration la plus performante. Les mesures par thermographie infrarouge (IR)
combinées à la visualisation par caméra rapide et aux mesures des fluctuations de
pressions par capteurs piézoresitifs, ont été réalisées dans le cas de canaux en
Polydimethylsiloxane (PDMS) de grand rapport de forme (a=22) et de diamètre
hydraulique Dh =192 μm. L’objectif était d’identifier des cartographies
bidimensionnelles et instationnaires de coefficients d’échanges convectifs dans le cas
d’un micro canal utilisant un fluide diélectrique le FC72. La double visualisation par
thermographie infrarouge et par caméra CCD rapide a permis de corréler la dynamique
de l’ébullition, et notamment le grossissement des bulles, l’asséchement et ou le
mouillage des parois, aux coefficients d’échanges convectifs locaux.
Declaration
“I declare that this Thesis has been composed by me (i.e. Sofia Korniliou), the work is my own, and it has not been submitted for any other degree or professional qualification except as specified.”
v
Abstract
Flow boiling in integrated microchannel systems is a cooling technology that has received significant attention in recent years as an effective option for high heat flux microelectronic devices as it provides high heat transfer and small variations in surface temperature. However, there are still a number of issues to be addressed before this technology is used for commercial applications. Amongst the issues that require further investigation are the two-phase heat transfer enhancement mechanisms, the effect of channel geometry on heat transfer characteristics, two-phase flow instabilities, critical heat flux and interfacial liquid-vapour heat transfer in the vicinity of the wall. This work is an experimental study on two-phase flow boiling in multi- and single-rectangular microchannels. Experimental research was performed on the effect of the channel aspect ratio and hydraulic diameter, particularly for parallel multi-microchannel systems in order to provide design guidelines. Flow boiling experiments were performed using deionised water in silicon microchannel heat sinks with width-to-depth aspect ratios (𝑎) from 0.33 to 3 and hydraulic diameters from 50 μm to 150 μm. The effect of aspect ratio on two-phase flow boiling local heat transfer coefficient and two-phase pressure drop was investigated as well as the two-phase heat transfer coefficients trends with mass flux for the constant heat fluxes of 151 kW m-2, 183 kW m -2, 271 kW m-2 and 363 kW m-2. Wall temperature measurements were obtained from five integrated thin nickel film temperature sensors. An integrated thin aluminium heater enabled uniform heating with a small thermal resistance between the heater and the channels. The microfabricated temperature sensors were used with simultaneous high-speed imaging and pressure measurements in order to obtain a better insight related to temperature and pressure fluctuations caused by two-phase flow instabilities under uniform heating in parallel microchannels. The results demonstrated that the aspect ratio of the microchannels affects flow boiling heat transfer coefficients. However, there is not clear trend of the aspect ratio on the heat transfer coefficient. Pressure drop was found to increase with increasing aspect ratio. Wide microchannels but not very shallow, with 𝑎 = 1.5 and 𝐷ℎ = 120 μm, have shown good heat transfer performance, by producing modest two-phase pressure drop of maximum 200 mbar for the highest heat flux and heat transfer coefficients of 200 kW m-2 during two-phase flow boiling conditions. For the high aspect ratio, values of 2 and 3 two-phase flow boiling heat transfer coefficients were measured to be lower compared to aspect ratio of 1.5. Microchannels with aspect ratios higher than 1.5 produced severe wall temperature fluctuations for high heat fluxes that periodically reached extreme wall temperature values in excess of 250 ˚C. The consequences of these severe wall temperature and pressure fluctuations at high aspect ratios of 2 and 3 resulted in non-uniform flow distribution and temporal dryout. Abrupt increase in two-phase pressure drop
vi
occurred for 𝑎 > 1.5. The effect of the inlet subcooling was found to be significant on both heat transfer coefficient and pressure drop. Furthermore, the effects of bubble growth on flow instabilities and heat transfer coefficients have been investigated. Although the thin film nickel sensors provide the advantage of much faster response time and smaller thermal resistance compared to classic thermocouples, they do not allow for full two-dimensional wall temperature mapping of the heated surface. An advanced experimental method was devised in order to produce accurate two-dimensional heat transfer coefficient data as a function of time. Infrared (IR) thermography was synchronised with simultaneous high-speed imaging and pressure measurements from integrated miniature pressure sensors inside the microchannel, in order to produce two-dimensional (2D) high spatial and temporal resolution two-phase heat transfer coefficient maps across the full domain of a polydimethylsiloxane (PDMS) microchannel. The microchannel was characterised by a high aspect ratio (𝑎 = 22) and a hydraulic diameter of 192 μm. The PDMS microchannel was bonded on a transparent indium tin oxide (ITO) thin film coated glass. The transparent thin film ITO heater allowed the recording of high quality synchronised high - speed images of the liquid-vapour distribution. This work presents a better insight into the two-phase heat transfer coefficient spatial variation during flow instabilities with two-dimensional heat transfer coefficient plots as a function of time during the cycles of liquid-vapour alternations for different mass flux and heat flux conditions. High spatial and temporal resolution wall temperature measurements and pressure data were obtained for a range of mass fluxes from 7.37 to 298 kg m-2 s-1 and heat fluxes from 13.64 to 179.2 kW m-2 using FC-72 as a dielectric liquid. 3D plots of spatially averaged two-phase heat transfer coefficients at the inlet, middle and outlet of the microchannel are presented with time. The optical images were correlated, with simultaneous thermal images. The results demonstrate that bubble growth in microchannels differs from macroscale channels and the confinement effects influence the local two-phase heat transfer coefficient distribution. Bubble nucleation and axial growth as well as wetting and rewetting in the channel were found to significantly affect the local heat transfer physical mechanisms. Bubble level heat transfer coefficient measurements are important as previous researchers have experimentally investigated local temperature and high speed visualisation in bubbles during pool boiling conditions and not flow boiling. The effect of the confined bubble axial growth to the two-phase heat transfer coefficient distribution at the channel entrance was investigated at low mass fluxes and low heat fluxes. The 3D plots of the 2D two-phase heat transfer coefficient with time across the microchannel domain were correlated with liquid-vapour dynamics and liquid film thinning from the contrast of the optical images, which caused suspected dryout. The 3D plots of heat transfer coefficients with time provided fine details of local variations during bubble nucleation, confinement, elongated bubble, slug flow and
vii
annular flow patterns. The correlation between the synchronised high-resolution thermal and optical images assisted in a better understanding of the heat transfer mechanisms and critical heat flux during two-phase flow boiling in microchannels.
viii
Acknowledgements
I gratefully acknowledge the financial support of the UK Engineering and Physical Sciences Research Council through the grant EP/K00963X/1.
I would like to express my sincere gratitude to my supervisor, Professor Khellil Sefiane for giving me the opportunity to work in his group, supporting me and leading me through my PhD. I would like to thank Professor Khellil Sefiane for all his understanding, patience, his support and kindness. It has been a great pleasure to work with him, in supportive and encouraging environment of his research group.
I am also thankful to Professor Anthony J. Walton and his research group at the Scottish Microelectronic Centre. Particularly, I would like to acknowledge Dr. Yifan Li for fabricating and Dr. Coinneach MacKenzie Dover for fabricating the test devices I used in my research.
My sincere thanks goes to Professor Souad Harmand in the Université de Valenciennes et du Hainaut-Cambrésis (UVHC) who provided me the opportunity to use the laboratory facilities. It has been a pleasure collaborating with her group in France. The experimental setup for the synchronised infrared thermography and high-speed flow visualisation experiments was built in UVHC.
I am thankful to Dr. Coinneach MacKenzie Dover, Dr. John Christy and Dr. George Serghiou for their assistance during the writing of my thesis.
I would also like to thank the technicians at both universities particularly Mr Douglas Carmichael (University of Edinburgh) and Mr Jesse Schiffler (UVHC) for their assistance and patience.
I would like to acknowledge my friends and Ph.D. students from the Institute of Materials and Processes (IMP). I would like to give special thanks to Charithea, Rohan, James, Dimitrios, Nelly and Dr. Patrick Schmidt for their friendship and support during my PhD. I am also thankful to all my colleagues Alessio, Nick, Mengyu, Steven , Davide, Dr. Dimitris Mamalis, Dr. Alex Harisson, Dr. Alex Askounis, Dr. Ares Gomez, Dr. Pedro Saenz, Dr. Eleni Shiko and all the rest for the nice moments we spent in the group and their support and encouragement throughout the entire PhD experience. I would also like to give special thanks my colleague and friend Maryam Parsa from for LAMIH laboratory in UVHC for her assistance and support during the months I spent in France.
Finally, I would like to thank my family and my friends for their love, encouragement and support that contributed to the achievement of this work.
ix
Table of contents
Lay summary... ii Résumé ... iii Declaration ... iv Abstract ... v Acknowledgements ... viii Table of contents ... ix
List of tables ... xiii
List of figures ... xiv
Nomenclature ... xxxiii
Chapter 1 Introduction and objectives………...……...1
1.1 Introduction ... 1
1.2 Objectives... 8
1.3 Summary ... 8
1.4 Outline of the thesis ... 8
Chapter 2 Literature Review………...……....10
2.1 Introduction ... 10
2.2 The criteria for transition from macro- to micro- channels ... 11
2.3 Macroscale flow boiling two-phase heat transfer ... 13
2.4 Microscale flow boiling two-phase heat transfer ... 14
2.4.1 Effect of flow pattern on flow boiling two-phase heat transfer ... 17
2.4.2 Effect of bubble confinement on flow boiling two-phase heat transfer ... 19
2.4.3 Effect of channel shape, hydraulic diameter and cross-sectional area on flow boiling two-phase heat transfer ... 20
2.4.4 Effect of cross-sectional aspect ratio on flow boiling two-phase heat transfer ... 26
2.5 Design parameters for plate-fin heat sink configuration ... 29
2.6 Two-phase flow patterns in macroscale ... 30
2.7 Two-phase flow patterns in microscale ... 31
2.8 Nucleate boiling ... 32
2.9 Entrainment mass transfer in annular flow regime ... 35
2.10 Two-phase flow boiling instabilities ... 36
x
2.11.1 Dryout ... 42
2.12 Experimental approaches ... 44
2.13 Material selection for optically accessible and transparent to infrared microchannels ... 50
2.14 Absorption coefficient ... 51
2.15 Scope of research ... 52
2.16 Summary ... 52
Chapter3 Experimental Facility and Methodology………..………...54
3.1 Introduction ... 54
3.2 Design, microfabrication process and facility used for silicon microchannel heat sinks ... 55
3.2.1 Design of the silicon microchannels heat sinks ... 55
3.2.2 Microfabrication of silicon microchannel heat sinks ... 58
3.2.3 Housing for the silicon microchannel heat sinks ... 65
3.2.4 Experimental facility for flow boiling in silicon microchannel heat sinks ... 66
3.2.5 Data acquisition system and measurement uncertainties ... 69
3.3 Polymethylsiloxane (PDMS)-based microchannel device, microfabrication and experimental facility ... 74
3.3.1 Design of a single Polymethylsiloxane (PDMS)-based microchannel device ... 74
3.3.2 Microfabrication of Polydimethylsiloxane (PDMS) microchannel ... 75
3.3.3 Indium tin oxide (ITO) film characteristics ... 80
3.3.4 Surface emissivity measurements of ITO coated glass and PDMS for infrared thermography ... 82
3.3.6 Determination of the “penetration depth" for interfacial wall temperature measurements 84 3.3.7 Interface connections and housing for the PDMS-based microchannel ... 86
3.3.8 Experimental facility for transparent PDMS –based microchannel device ... 89
3.3.9 Data acquisition system and measurements uncertainty ... 92
3.4 Summary ... 93
Chapter 4 Effect of aspect ratio on two-phase flow boiling heat transfer in silicon
rectangular microchannels ………..…….…………..94
4.1 Introduction ... 94
4.2 Experimental setup and procedure ... 94
4.3 Data reduction ... 95
4.4 Results and discussion ... 103
4.4.1 Effect of different microchannel cross section size and aspect ratio on pressure drop .... 103
4.4.2 Effect of aspect ratio on pressure drop for constant 𝐷ℎ ... 112
4.4.3 Effect of mass flux on pressure drop of high aspect ratio microchannels of a = 2, a = 3 119 4.4.5 Two-phase pressure drop as a function of the vapour quality ... 123
xi
4.4.6. Two-phase heat transfer coefficients and flow visualisations ... 125
4.4.7 Two-phase heat transfer coefficients for 𝑎 = 3 and 𝐷ℎ= 75 µm microchannels ... 127
4.4.8 Two-phase heat transfer coefficients for 𝑎 = 2 ... 131
4.4.9 Two-phase heat transfer coefficients for 𝑎 = 1.5 ... 138
4.4.10 Effect of inlet subcooling on local heat transfer coefficients ... 142
4.4.11 Influence of increasing aspect ratio on flow instabilities ... 144
4.4.12 3D plots of heat transfer coefficients distribution along the flowstream line of the heat sink ... 153
4.4.13 Bubble growth ... 162
4.5 Conclusions ... 166
4.6 Summary ... 167
Chapter 5 High spatial and temporal resolution wall temperature measurements
with IR thermography………..………...169
5.1 Introduction ... 169
5.2 Experimental setup and procedure ... 170
5. 3 Data reduction ... 171
5. 4 Results and discussion ... 175
5.4.1 Two-phase heat transfer coefficients during flow boiling ... 175
5.4.1.1 Spatially averaged two-phase heat transfer coefficients ... 175
5.4.1.2 Local two-phase heat transfer coefficients ... 184
5.4.1.3 Maximum heat transfer rate (CHF) ... 187
5.4.1.4. Spatio-temporal two-phase heat transfer coefficients ... 190
5.4.1.5 Bubble dynamics ... 197
5.4.1.6 Pressure fluctuations ... 198
5.5 Conclusions ... 200
5.6 Summary ... 201
Chapter 6 Dual inner wall temperature mapping with synchronised flow
visualisation ……….202
6.1 Introduction ... 202
6.2 Experimental setup and procedure ... 204
6.3 Data reduction ... 204
6.4 Results and discussion ... 204
6.4.1 Evaluation of method for interfacial wall temperature measurements ... 204
6.4.2 Effect of heat flux on the spatially averaged interfacial heat transfer coefficient as a function of time for G = 36.87 kg m-2s-1, 73.74 kg m-2s-1and 110.62 kg m-2s-1 ... 205
xii
6.4.2.1 2D plots that illustrate the effect of the heat flux on time averaged interfacial heat transfer coefficients for the inlet, middle and outlet of the channel for G
= 36.87 kg m-2s-1, 73.74 kg m-2s-1and 110.62 kg m-2s-1 ... 206
6.4.2.2 3D plots of local interfacial heat transfer coefficient as a function of time at the onset of boiling (ONB)... 210
6.4.2.3 3D plots of maximum local interfacial heat transfer coefficient (HTCmax) as a function of time ... 213
6.4.2.4 3D plots of local interfacial HTC at the maximum heat flux ... 219
6.4.2.5 Investigation of two-phase heat transfer during annular flow regime ... 224
6.4.2.6 Critical heat flux ... 236
6.4.3 Interfacial wall temperature fluctuations at inlet, middle and outlet of the microchannel for G = 73.74 kg m-2 s-1 and q = 38.52 kW m-.2 ... 236
6.4.4 Interfacial two-phase heat transfer coefficient and simultaneous pressure drop fluctuations ... 242
6.4.5 Determination of the liquid-vapour distribution on the channel surface ... 244
6.4.6 Inner wall temperature distribution of the bubble during single bubble growth ... 252
6.4.6.1 Spatial variation of the interfacial two-phase heat transfer coefficients during single bubble growth in a high aspect ratio microchannel illustrated in 3D plots ... 260
6.4.6.3 Local liquid film evaporation during bubble confinement ... 267
6.4.7.1 Local wall temperature measurements as a function of time ... 270
6.4.7.2 2D & 3D plots of ℎ𝑡𝑝(𝑥, 𝑦) for 𝑞 < 45 kW m-2 ... 275
6.4.7.3 2D & 3D plots of ℎ𝑡𝑝(𝑥, 𝑦) for 𝑞 > 45 kW m-2 ... 281
6.4.7.3 2D & 3D plots of ℎ𝑡𝑝(𝑥, 𝑦) for high mass flux ... 285
6.4.7.4 Bubble dynamics ... 289
6.5 Conclusions ... 291
6.6 Summary ... 292
Chapter
7
Overall
Conclusions
and
summary
of
future
work
………..………..………..289
7.1 General Conclusions ... 294 7.2 Future recommendations ... 299 7.3 Summary ... 301 References ... 302 Appendix A ... 312 Appendix B ... 318xiii
List of tables
Table 3. 1Characteristics of the silicon microchannels heat sinks. ... 57
Table 3. 2 Measurement uncertainties. ... 73
Table 3. 3 Characteristic dimensions of the different components of the microchannel device. 74 Table 3. 4 Analytical steps for PDMS cross-linking process. ... 80
Table 3. 5 Properties of FC-72. ... 91
Table 3. 6 Summary of measurements uncertainties. ... 93
Table 4. 1 Constants and variables of the experiments... 109
Table 4. 2 Constants and variables of the experiments... 113
Table 6. 1Minimum to maximum two-phase heat transfer coefficients for the whole channel as a function of time at the ONB HCTmax and CHF conditions for the mass fluxes of ... 223
Table 6. 2 Inner wall temperature of the bubble base Tb as a function of the bubble area shown in Figure 6.40. The bubble area was measured from high- speed, images using Image J. The high quality images were obtained from the transparent ITO/glass base of the microchannels. ... 260
Table 6. 3 Two-phase heat transfer coefficients of the bubble base hb(x, y), obtained from Figure 6.42. The letters a, b, c, d represent the graphs in Figure 6.41. ... 263
Table 6. 4 Main frequency and amplitude of fluctuation deduced using FFT analysis. ... 275
Table 6. 5 summarises the 2D two-phase eat transfer coefficients (from minimum to maxim) along the microchannel as a function of time for G =14.78 kg m-2s-1 and increasing heat fluxes. The heat transfer coefficient decreases with increase of the heat flux. ... 284
Table 6. 5 Range of 2D two-phase eat transfer coefficients (from minimum to maxim) along the microchannel as a function of time for three heat fluxes and G=14.78 kg m-2s-1.. ... 284
xiv
List of figures
Chapter 1
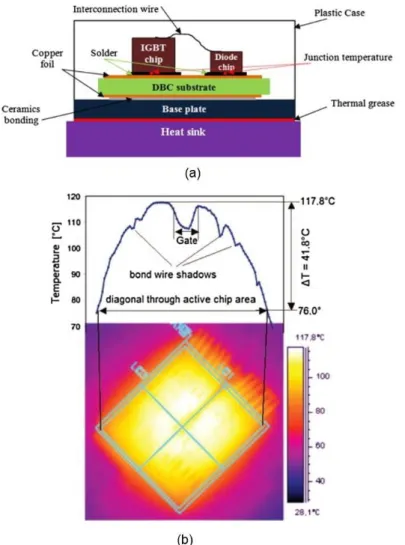
Figure 1. 1 (a) Schematic drawing of typical IGMT module produced by Mitsubishi Electronic
Corporation in 2015 and (b) temperature distribution across the diagonal of an IGMT chip. ... 2
Chapter2
Figure 2. 1 Schematic drawing for the definition of the contact angle used in the model proposed
by Tibiriçá and Ribatski ... 11
Figure 2. 2 Illustration of forced convective boiling with qualitative temperature profile and heat
transfer coefficient profile for a uniform heat flux boundary condition at a vertical tube used by Steiner and Taborek. ... 14
Figure 2. 3 Overall performance trends of small diameter (50 µm < Dh < 1000 µm) two-phase microchannel heat sinks, produced by Lee and Mudawar. . ... 15
Figure 2. 4 (a) Local flow boiling heat transfer coefficient versus local vapour quality for
increasing base heat fluxes for 𝐺 = 280.5 kg m-2s-1 and (b) local flow boiling heat transfer coefficient versus local vapour quality for increasing base heat fluxes for 𝐺 = 549.7 kg m-2s-1... 16
Figure 2. 5 Flow boiling heat transfer coefficient versus channel wall heat flux at low vapour
quality with R245fa . ... 17
Figure 2. 6 Schematics of flow regimes, with local variation of heat transfer coefficient in
mini/microchannels with uniform circumferential heat flux for (a) nucleate boiling dominant heat transfer and (b) convective boiling dominant heat transfer ... 18
Figure 2. 7 (a) Evaporation momentum force acting on the evaporating interface of a growing
bubble and (b) forces due to evaporation momentum and surface tension acting on a liquid-vapour interface of a bubble filling the microchannel cross-section ... 20
Figure 2. 8 Variation in mean heat transfer coefficients along microchannels of different shapes
. ... 22
Figure 2. 9 Effect of microchannel width on boiling (a) heat transfer coefficient of FC-72 and
(b) pressure drop versus wall heat flux at 𝐺 = 700 kg m -2 s-1 ... 24
Figure 2. 10 Three-zone model for elongated bubble flow, from the study of Revellin and Thome
xv
Figure 2. 11 Cyclic variation in boiling heat transfer coefficient from the study of Revellin and
Thome. ... 26
Figure 2. 12 Experimentally determined pressure drop across the microchannel versus aspect
ratio (𝑎), at the power of 3.5 W from the study of Singh et al. The theoretical single-phase pressure drop values are shown by dash-dot and dashed lines for the mass flow rates of 0.15 and 0.20 ml min-1 respectively. ... 28
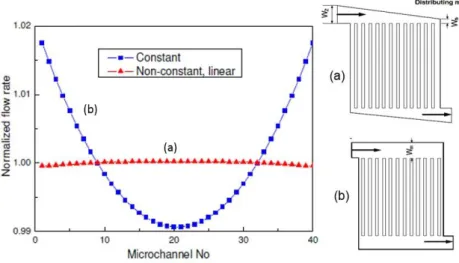
Figure 2. 13 Flow distributions with 40 parallel rectangular channels for two manifolds structures,
with (a) non-constant cross section and (b) with constant linear cross section manifold . ... 30
Figure 2. 14 (a) Flow pattern map by Ong and Thome and (b) flow patterns recorded during
FC-72 boiling in a high aspect ratio rectangular channel with 𝐷ℎ = 1454 μm, 𝐺 = 22.4 kg m−2s−1 and 𝑞 = 8.13 kW m−2 from the study of Wang et al. ... 32
Figure 2. 15 Schematic of bubble growth at the wall, (a) overall picture at macro-scale (shaded
region depicts the area covered by non-evaporating thin film) and (b) zoomed in nano- and micro-scale regions at the three-phase contact line . ... 34
Figure 2. 16 Different droplet entrainment mechanisms ... 35 Figure 2. 17 Simultaneous temperature and pressure fluctuations for two types of instabilities
HALF (high amplitude low frequency) and LAHF (low amplitude –high frequency) for the same mass flux of 208 kg m-2s-1, at the inlet temperature of 71 °C for the 40 parallel rectangular silicon microchannels of 𝐷ℎ =192 µm from the study of Bogojevic et al. for (a) 𝑞 = 210 kW m-2and (b) 𝑞 = 376 kW m-2. ... 38
Figure 2. 18 Heat transfer coefficient, time averaged as a function of heat flux for three mass
fluxes of 11.22, 22.4 and 44.8 kg m-2s-1 tested with FC-72 in a high aspect ratio microchannel with round corners and 𝐷ℎ = 550 µm . ... 40
Figure 2. 19 Heat transfer coefficients, obtained just prior to the exit of the microchannels for the
five flow rates considered in this study of Chen and Garimella ... 41
Figure 2. 20 CHF mechanisms in mini- /microchannel heat sinks. (a) DNB for HFE-7100 in heat
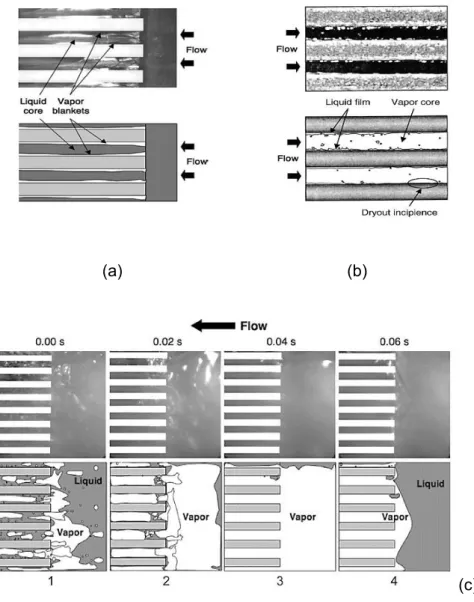
sink with 𝐷ℎ =334.1 μm for 𝐺= 341 kg m-2s-1 and q =325.8 W cm-2 , (b) Dryout incipience for R134a in a heat sink with 𝐷ℎ =348.9 μm for 𝐺= 128 kg m-2s-1 and q = 31.6 W cm-2 (adapted from
[16]) and (c) Premature CHF and flow oscillations for HFE-7100 in heat sink with 𝐷ℎ = 415.9
μm for 𝐺 = 670 kg m-2s-1 and q =250.0 W cm-2: (1) initial vapour pocket build up in upstream plenum, (2) growth of vapour mass, (3) complete blockage of inlet. ... 43
Figure 2. 21 Dryout incipience caused by (a) the formation of a hotspot under a growing bubble,
(b) near wall bubble crowding that reduces liquid film, (c) dryout under a slug and (d) liquid film dryout during annular flow at the outlet of the channel. ... 44
xvi
Figure 2. 23 (a) Tantalum deposition on borosilicate glass and (b) silicon tube used with infrared
thermography technique. ... 46
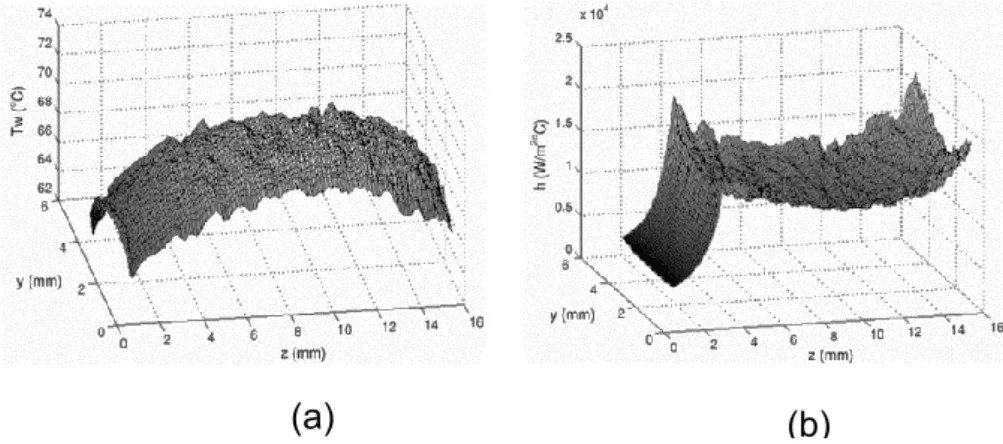
Figure 2. 24 Heater wall design used with IR thermography experiments by Yoo et al. ... 46 Figure 2. 25 Chip wall temperature and heat transfer coefficient distributions (𝑇𝑖𝑛let=30.8 °C, 𝛥𝑃 =30.41 kPa, 𝐺 = 110.1 kg m-2s-1, q =141.92 kW m-2, 𝑥𝑒 = 0.5268, 𝑅𝑒 = 65.2). Results from the study of Jinliang et al. . ... 48
Chapter 3
Figure 3. 1 (a) Geometry of the inlet and outlet manifold and (b) split view of the microchannel
heat sink device. ... 56
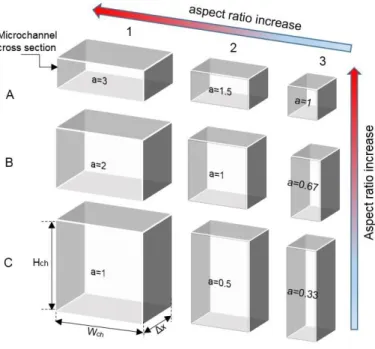
Figure 3. 2 Schematic drawing with the microchannel cross sections of the different heat sink
designs presented in table 3.1... 58
Figure 3. 3 Layout of masks used in microfabrication of silicon microchannel heat sinks. (a) Mask
for the heater and (b) mask for the temperature sensors. ... 58
Figure 3. 4 Microfabrication steps of silicon microchannels heat sink. ... 61 Figure 3. 5 (a) Diagram of the temperature sensors from the backside of the microchannels, (b)
position of temperature sensors from the front side of the microchannels heat sink and (c) schematic diagram of the four-point resistivity measurement by the temperature sensor. ... 62
Figure 3. 6 Silicon wafer with microchannel heat sinks devices, from the front side (a) and the
backside (b). The numbers 1, 2, 3 are used to distinguish the test devices with different microchannel widths of 150 µm (2), 100 µm (3) and 50 µm (1). ... 63
Figure 3. 7 (a) Backview and (b) top view of one silicon microchannels heat sink. ... 64 Figure 3. 8 Holes in the inlet and outlet manifolds of the silicon microchannel heat sinks using a
(a) drilling technique (b) powder blasting technique. ... 64
Figure 3. 9 Test section for local injection of powder with the needle during powder blasting
technique for micromachining small size holes on Pyrex glass, located at Heriot-Watt University. ... 64
Figure 3. 10 (a) Transparent cover plate from Plexiglas and (b) bottom frame from polycarbonate
block used for the electrical connections. ... 65
Figure 3. 11 Schematic of the test flow loop1. ... 67 Figure 3. 12 Photograph of the (a) experimental facility (b) test flow loop 1 with nomenclature
of some of the main devices. ... 68
Figure 3. 13 Test module, fluid thermocouples and pressure transducers located before the test
xvii
Figure 3. 14 Convective oven used for the calibration of the thin film Ni temperature sensors
integrated into the microchannels heat sink. ... 70
Figure 3. 15 Side view of the calibration assembled device. The microchannels heat sink is mounted between two Plexiglas frames and the sensor pads are connected to the power supply and the data acquisition device. TC1, TCref, TC2 are the three K-type thermocouples. ... 71
Figure 3. 16 Calibration curve of temperature sensors. ... 71
Figure 3. 17 Diagram of electrical connections to the temperature sensors. On the left side, the power supply connections are shown and the connections to the data acquisition device are shown on the right side. ... 72
Figure 3. 18 Photograph of the printed circuit board (PCB) for electrical connections of the temperature sensors and the acquisition of their output response. ... 73
Figure 3. 19 PDMS microchannel, bonded to ITO coated glass. ... 74
Figure 3. 20 Photograph of a PDMS microchannel with the two integrated NNP-301 series piezoresistive pressure sensors at the inlet and outlet. ... 76
Figure 3. 21 Schematic diagram of the circuit, of NPP-301 series pressure sensor. ... 77
Figure 3. 22 Pressure sensor and electrical connections. ... 77
Figure 3. 23 Honeywell pressure sensor HSC Series True Stability. ... 78
Figure 3. 24 Analytical graph of the electrical connections of the pressure sensors with the circuit board. ... 78
Figure 3. 25 Schematic view of integration steps of the piezoresistive pressure sensors in the PDMS microchannel near the inlet (𝑃𝑠1) and the outlet (𝑃𝑠2). ... 79
Figure 3. 26 Channel wall temperature measured with IR as a function of input power without liquid in the microchannels. ... 81
Figure 3. 27 Glass wall temperature measured with IR camera for both 1 mm and 0.17 mm thickness glass as function of input power to ITO film of 200 nm thickness. ... 81
Figure 3. 28 (a) Setup for calibration of surface emissivity and (b) thermal image from the IR used to measure the emissivity of ITO coated glass and annealed ITO coated glass in reference to the emissivity of the black paint. ... 82
Figure 3. 29 Averaged surface emissivity of non-annealed ITO glass. ... 84
Figure 3. 30 Schematic of the interfacial wall temperature measurement obtained from the PDMS side using an infrared camera. ... 85
Figure 3. 31 PDMS device (a) before the microfluidic connections and (b) after the microfluidic connections have been done. ... 86
Figure 3. 32 Schematic drawing of (a) housing with the PDMS microchannel which consists of a microchannel with integrated pressure sensors (𝑃𝑠1,𝑃𝑠2) and its support (b) the three measurement sections along the microchannel. ... 87
xviii
Figure 3. 33 Top view of PCB board base for electrical connections to the heater. The flow
visualisation window has optical access to the ITO / glass base of the microchannel. ... 88
Figure 3. 34 Two different types of temperature measurements using infrared thermography
technique used in this study, where the camera examines the wall temperature (a) from ITO/glass side (channel base) and (b) from PDMS side, interfacial wall temperature measurements. ... 88
Figure 3. 35 Schematic drawing of (a) the wall temperature measurements from the ITO/glass
base and (b) the flow loop used to facilitate wall temperature measurements PDMS side. ... 90
Figure 3. 36 Photograph of the flow loop2 (1) used for synchronised IR thermography from
PDMS top of the channel and high-speed imaging from the ITO/glass base. Photographs of the test section (1), the IR research software and LabVIEW interface (2) and the degassing reservoir for FC-72 (4) are also presented... 91
Figure 3. 37 ... 92
Chapter 4
Figure 4. 1 Comparison of predicted friction factor with existing experimental results and existing
correlation. ... 100
Figure 4. 2 Comparison of predicted friction factor with existing experimental results and existing
correlation. ... 101
Figure 4. 3 Comparison of predicted friction factor with existing experimental results and existing
correlation. ... 102
Figure 4. 4 Pressure drop averaged over time as a function of mass flux at the constant heat fluxes
of (a) q = 151 kW m-2 and (b) 185 kW m-2 for both two-phase and single-phase flow conditions for all nine microchannel heats sinks.. ... 104
Figure 4. 5 Pressure drop averaged over time as a function of mass flux at the constant heat flux
of 271 kW m-2 for both two-phase and single-phase flow conditions for all nine microchannel heat sink designs with characteristics presented in Table 3.1 of chapter 3. The inlet temperature is 25 ºC ± 1 ºC. ... 105
Figure 4. 6 Pressure drop averaged over time as a function of mass flux at the constant heat flux
of q = 151 kW m-2 for (a) constant height of 50 µm and increasing widths of 50, 100 and 150 µm constant and 𝑎 ≥ 1 (b) constant height of 100 µm and increasing widths of 50, 100 and 150 µm and 0.5 ≤ 𝑎 ≤ 1.5 and (c) constant height of 150µm and increasing widths of 50, 100 and 150 µm for two-phase and single-phase flow conditions and a ≤ 1. The inlet liquid temperature is 25 ºC ± 1 ºC. ... 106
xix
Figure 4. 7 Effect of increasing width for three constant heights of (a) 𝐻𝑐ℎ = 50 µm (a=1, 2, 3 and 𝐷ℎ.= 50 µm, 66.7 µm and 75 µm) (b) 𝐻𝑐ℎ=100 µm (𝑎 = 1.5, 1, 0.5) and 𝐷ℎ. = 120 µm, 100 µm and 66.7µm) and (c) 𝐻𝑐ℎ = 150 µm (𝑎 =1, 0.67, 0.33 and 𝐷ℎ = 150 µm, 120 µm and 75µm. .. 108
Figure 4. 8 Channel height as a function of ∆P/∆G for the three constant widths of (a) Wch =150 µm (b) 100 µm, (c) 50 µm. for the case of G < Gcr, where Gcr is the value where the ∆𝑃/∆𝐺 slope changes. ... 110
Figure 4. 9 Aspect ratio of the channel as a function of 1/𝑁 𝐴𝑐𝑟 and 𝐷ℎ. ... 111
Figure 4. 10 ∆P/∆𝐺 was plotted as a function of 1/𝑁 𝐴𝑐𝑟 where 𝑁 𝐴𝑐𝑟 is the product of the number of the microchannels 𝑁 and r𝑐𝑟 the cross sectional area of the channels. ... 111
Figure 4. 11Effect of mass flux on pressure drop values for single-phase and two-phase pressure
drop for six microchannels heat sinks of different aspect ratios but constant𝐷ℎ. The 𝐷ℎ was kept constant at 66.7, 75 and 120 µm. For 𝐷ℎ =66.7 µm 𝑎 = 0.5 and 𝑎 = 2, for 𝐷ℎ = 75 µm constant the aspect ratios were 3 and 0.33 and for the 𝐷ℎ =120µm the aspect ratios were 𝑎 = 0.67 and 𝑎 = 1.5 (a) for q=151 kW m-2 and (b) for 𝑞 =363 kW m-2 at T
inlet =25 ˚C. ... 113
Figure 4. 12 ∆𝑃/∆𝐺 slope and Dh for the two-phase region as a function of the aspect ratio of the
microchannel cross section for (a) q= 151 kW m-2 (b) q = 271 kW m-2 and (c) q = 363 kW m-2. ... 114
Figure 4. 13 Pressure drop for single and two-phase flow conditions for a constant hydraulic
diameter and changing aspect ratio as a function of mass flux for the heat fluxes of (a) q = 151 kW m-2 and (b) q =183 kW m-2 for 𝑇
𝑖𝑛let = 25 ˚C. ... 115
Figure 4. 14 Pressure drop for single and two-phase flow conditions for a constant hydraulic
diameter and changing aspect ratio as a function of mass flux for the heat flux of q = 363 kW m -2, the inlet temperature of 𝑇
inlet = 25 ºC. ... 116
Figure 4. 15 Pressure drop data for single and two-phase flow conditions for a constant hydraulic
diameter and changing aspect ratio as a function of mass flux. For the heat fluxes of (a) 𝑞 = 151 kW m-2 and (b) 𝑞 = 183 kW m-2 at 𝑇
𝑖𝑛let = 81 ºC. ... 117
Figure 4. 16 Pressure drop data for single and two-phase flow conditions for a constant hydraulic
diameter and changing aspect ratio as a function of mass flux. For the heat fluxes of (a) 𝑞 = 271 kW m-2and (b) 𝑞 = 363 kW m-2 at Tinlet = 81 ºC. ... 118
Figure 4. 17 ∆P/∆G as a function of aspect ratio and Dh for all heat fluxes for (a) 𝑇inlet = 25ºC and (b) 𝑇inlet = 81 ºC. ... 119
Figure 4. 18 Two-phase pressure drop averaged over a time interval of 5 min as a function of
mass flux for the heat fluxes of 141.74 kW m-2, 175.85 kW m-2, 266.34 kW m-2 and 364.95 kW m-2 measured for the design 2A with 𝑎 = 2 at 𝑇𝑖𝑛𝑙𝑒𝑡= 81 ºC. ... 120
xx
Figure 4. 19 Two-phase pressure drop averaged over the time interval of 5 min as a function of
mass flux for the heat fluxes of 145.31 kW m-2, 178.16 kW m-2, 273.97 kW m-2 and 384.77 kW m-2 for the design 2A with 𝑎 = 2 at 𝑇
𝑖𝑛𝑙𝑒𝑡 =25 ºC. ... 120
Figure 4. 20 Time averaged two-phase pressure drop as a function of wall temperature at T5 for
the heat fluxes of 151 kW m-2, 183 kW m-2, 271 kW m-2 and 363 kW m-2 for 𝑎 = 2 and Dh = 66.7µm for (a) 𝑇𝑖𝑛𝑙𝑒𝑡 =25 ºC and (b) 𝑇𝑖𝑛𝑙𝑒𝑡 = 81ºC . ... 121
Figure 4. 21Averaged over time two-phase pressure drop as a function of wall temperature at
... 122
Figure 4. 22. Averaged over time two-phase pressure drop as a function of wall temperature at
position 5 for the heat fluxes of 151 kW m-2, 183 kW m-2, 271 kW m-2 and 363 kW m-2 near the exit of 𝑎 =1.5, 𝐷ℎ =120 µm microchannels at 𝑇𝑖𝑛𝑙𝑒𝑡=25 ºC. ... 123
Figure 4. 23. Averaged over time two-phase pressure drop as a function of vapour quality at T5
for the heat fluxes of 151 kW m-2, 183 kW m-2, 271 kW m-2 and 363 kW m-2 near the exit of (a) a = 3, h Dh = 75 µm, Tinlet = 81 ºC (b) a =1.5, Dh = 120 µm microchannels at Tinlet=25 ºC. ... 124
Figure 4. 24 Local time averaged heat transfer coefficient calculated at location of sensor T1 as
a function of mass flow rate at 𝑇𝑖𝑛𝑙𝑒𝑡= 81 oC, at q = 271 kW m-2 for the designs with 𝑎 = 3, 2, 1.5, 1 and 0.5 and 𝐷ℎ = 75, 66, 120, 100, 66.7 μm. ... 125
Figure 4. 25 Annular flow regime recorded with the high-speed camera at 1000 Hz for 𝑚̇ = 0.084
× 10-3 kg s-1 and q = 271 kW m-2 during two-phase flow at 𝑇
𝑖𝑛𝑙𝑒𝑡= 81 oC for the designs with microchannel cross sections of 𝑎 =1.5, 1, 0.5 at a constant channel height of 100 µm and increasing channel width. ……… 126
Figure 4. 26 Local heat transfer coefficient as a function of vapour quality (a) at T1 and (b) at T5
as a function of mass flux at constant heat fluxes of 151 kW m-2K-1, 174 kW m-2K-1, 271 kW m-2K-1 and 364 kW m-2K-1 for 𝑎 = 3 and 𝐷
ℎ = 75 µm microchannels. ... 128
Figure 4. 27(a) Uniform thin film evaporation and (b) non uniform film evaporation at the inlet
of the channels for 𝐺 = 337.22 kg m-2 s-1 and 𝑞 =151 kWm-2 at 1000 Hz with 𝑎 = 3, 𝐷
ℎ= 75µm at location of sensor T5. ... 129
Figure 4. 28. Image sequence of periodic cycles of instabilities for 𝑎 = 3, 𝐷ℎ = 75µm, at the heat flux of 271 kW m-2, 𝑇
𝑖𝑛𝑙𝑒𝑡 = 25 ˚C. The observed flow patterns were annular flow, mist flow and plug flow and were recorded at 5130 Hz. The width of the microchannels is 150 µm. ... 130
Figure 4. 29 Measurements of length from high-speed visualisation images for high aspect ratio
of 𝑎 = 3 using Image J. ... 131
Figure 4. 30Local heat transfer coefficients at locations of (a) T1 (b) T2 (c)T3 (d) T4 averaged
xxi
Figure 4. 31 A sequence of optical images of one selected microchannel that shows how bubble
nucleation, confinement and flow reversal results in suspected dryout conditions along a microchannel of 𝑎 = 2, 𝐷ℎ = 66.7 µm. Flow visualisations were obtained at the position of T4 (xe = 0.0494). The optical images were recorded at q = 363 kW m-2 and G = 1,263 kg m-2s-1 at high inlet temperature ofT𝑖𝑛let = 81 ºC. The recording rate was 5000 Hz with × 5 magnification. .. 133
Figure 4. 32 Flow visualisations presented with a sequence of optical images obtained at location
of T1 that reveal the existence of different flow regimes at parallel microchannels (t = 5 ms, 10 ms and 15 ms). 𝑎 = 2, 𝐷ℎ = 66.7 μm, × 5 magnification, 5000 Hz, 𝑞 = 363 kW m-2, 𝐺 = 1263 kg m-2s-1, location of T1. Arrow shows the bulk flow direction. ... 134
Figure 4. 33 Details of the flow regimes in parallel microchannels are shown using ×10
magnification for 𝑎 = 2, 𝐷ℎ = 66.7 μm, at 5000 Hz, q = 363 kW m-2, 𝑇𝑖𝑛𝑙𝑒𝑡= 81 °C, location of sensor T1. ... 135
Figure 4. 34 A sequence of optical images that show the different flow regimes in the parallel
microchannels of 𝑎 = 2, 𝐷ℎ = 66.7 µm. Flow visualizations occurred at the location of T4 (xe = 0.0494). The optical images were obtained at 𝑞 = 383 kW m-2 and 𝐺 = 1263 kg m-2s-1 at high inlet temperature of 𝑇𝑖𝑛𝑙𝑒𝑡 = 81 ºC. The recording rate was 5000 Hz and × 5 magnification. Arrow on top of figure shows bulk flow direction. ... 135
Figure 4. 35 A sequence of optical images that show the increase of nucleation sites at higher
mass flux, along a microchannel of 𝑎 = 2, 𝐷ℎ= 66.7 µm. Images sequence captured at the location of T4 (xe = 0.0494). The optical images were obtained at 𝑞 = 440 kW m-2 and 𝐺 = 1263 kg m-2s-1 at high inlet temperature of Tinlet= 81 ºC. The recording rate was 5000 Hz and × 10 magnification
was used. Arrow on top of figure shows the bulk flow direction……… 136
Figure 4. 36 (a) Local heat transfer coefficient as a function of vapour quality at location of T5
for constant heat fluxes of 145.31 kW m-2, 178.16 kW m-2, 273.97 16 kW m-2, 384.77 16 kW m -2, for the microchannels with 𝑎 = 2. (b) Local heat transfer coefficients at T1,T 3 and T5 plotted as a function of vapour quality for the constant mass flux of 1234.57 kg m-2s-1 for 𝑎 = 2.. 137
Figure 4. 37 Image sequences obtained at 100 Hz at the location of T3 for 𝑎 = 2 and q =271 kW
m-2, 𝑎 = 2, where xe = 0.05. Arrow on top of figure shows the bulk flow direction. ………….138
Figure 4. 38 Image sequence, captured at location of T1, at 100 Hz, 𝑞 = 271 kW m-,2, 𝑎 = 2 where xe = 0.05. ... 138
Figure 4. 39 Local to-phase heat transfer coefficients as a function of exit vapour quality for two
different heat fluxes for design 1B, Dh = 120 µm, a =1.5. ... 139
Figure 4. 40 Image sequence of parallel rectangular cross section microchannels at location of
sensor T2. The images were recorded at 1000 Hz and show uniform flow distribution with occurrence of simultaneous flow regimes at all the microchannels of 𝑎 = 1.5 and 𝐷ℎ =120 µm, 𝐺
xxii
= 88.8 kg m-2s-1. 𝑇
𝑖𝑛 = 25 ºC, 1000 Hz, location of T2. The highest heat transfer coefficient values were obtained during these conditions. ... 140
Figure 4. 41 Local heat transfer coefficient at position T5 close to the microchannel exit as a
function of mass flux for four heat fluxes and 𝑇𝑖𝑛let = 25 ºC for design with 𝑎 = 1.5 and 𝐷ℎ = 120µm. ... 140
Figure 4. 42 (a) Local heat transfer coefficients as a function with vapour quality for the design
2B with 𝑎 = 1 and 𝐷ℎ= 100 μm and (b) bubble evolution with time for one microchannel at sensor T2. Confinement effect is important in microchannels heat sinks of 𝐷ℎ = 120 µm, 𝑎 =1.5. . 141
Figure 4. 43 Image sequence that show the two-phase flow regime at the location of T2 where
the highest averaged htp was obtained for 𝑎 = 1.5 and 𝐷ℎ = 120 μm microchannels heat sink at 𝐺 = 88 kg m-2s-1 q = 151 kW m-2and 𝑇𝑖𝑛𝑙𝑒𝑡= 25 °C. Arrow on top of figure shows direction of bulk flow. The images were obtained at 1000 Hz and show uniform flow simultaneously at all the microchannels. The main flow pattern observed was annular flow regime. ... 142
Figure 4. 44 Local heat transfer coefficient as a function of mass flux for inlet temperature of
𝑇𝑖𝑛𝑙𝑒t =25 ºC (a), (b) and inlet liquid temperature of 𝑇𝑖𝑛𝑙𝑒𝑡 =81 ºC for the design with 𝑎 = 3 shown in (c) and (d). ... 143
Figure 4. 45 Wall temperature fluctuations correlated with simultaneous pressure fluctuations for
(a) 𝐺 = 88.82 kg m-2s-1, 𝑞 = 151 kW m-2 and (b) 𝐺 = 247 kg m-2s-1, 𝑞 = 363 kW m-2 for 𝑇
𝑖𝑛𝑙𝑒𝑡 = 25 ºC for design 1B with 𝑎 =1.5 and 𝐷ℎ = 120 μm. ... 144
Figure 4. 46 Results for pressure drop amplitude and main frequency of two-phase pressure
oscillations, produced using FFT, 𝑇𝑖𝑛𝑙𝑒𝑡= 81 ºC, 𝑞 = 271 kW m-2, for (a) design 1A with 𝑎 = 3 and (b) for the design 2A with 𝑎 = 2 and (c) design1B with 𝑎 = 1.5. ... 145
Figure 4. 47 Wall temperature fluctuations at T1, T2, T3, T4 and T5 for the high aspect ratio
microchannels of 𝑎 = 3 at 𝑇𝑖𝑛𝑙𝑒𝑡= 81 ºC and q = 271 kW m-2. ... 146
Figure 4. 48 Image sequence that shows flow instabilities during flow boiling in microchannels
of Dh=1.5 as recorded with high speed camera at the location of T1 within a period of 36.37 s at 100 Hz for 𝑎 = 3, Tinlet = 81 ºC and q = 271 kW m-2. ... 146
Figure 4. 49 Image sequence that shows the flow instabilities, recorded with high-speed camera
at T1 at 5130 Hz for a = 3 at 𝑇𝑖𝑛𝑙𝑒𝑡= 81 ºC and q= 271 kW m-2.Arrow on top of figure shows the flow direction. ... 148
Figure 4. 50 Image sequence captured at the high frequency of 5130 Hz for G= 833.33 kg m-2 s -1, 𝑇𝑖𝑛𝑙𝑒𝑡 = 81 oC and q = 271 kW m-2 at location of T1, for the design 1A with microchannels of a = 3 and 𝐷ℎ = 75µm. ... 149
Figure 4. 51 Wall temperature fluctuations for all sensors simultaneously at q = 363 kW m-2 and G = 1222.22 kg m-2s-1 for design 1A with a= 3. 𝑇
𝑖𝑛𝑙𝑒𝑡= 81 ºC (b) inlet and outlet pressure fluctuations with time for 𝑎 = 3... 150
xxiii
Figure 4. 52 The images were captured a high frequency of 5130 Hz at location of sensor T3 for q
= 363 kW m-2, G = 1222.22 kg m-2s-1 for design 1A, at 𝑇
𝑖𝑛let = 81 ºC, 𝑎 = 3 and they show the temporal dryout. ... 151
Figure 4. 53 Amplitude as a function of the frequency of wall temperature and pressure drop
oscillations produced from FFT analysis for two designs of constant 𝐷ℎ = 66.7 μm and different aspect ratios of (a) 0.5 and (b) 2 for 𝑇𝑖𝑛𝑙𝑒𝑡 = 81 ºC at the same heat flux. ... 152
Figure 4. 54 Reynolds number (Re) as a function of the heat flux for 𝑎 = 2 and 𝑎 = 3 microchannel
heat sinks with the same 𝐷ℎ= 66.7 µm at the same mass flow rate. ... 153
Figure 4. 55 Location of temperature sensors along the flowstream line of the silicon
microchannels heat sink. ... 153
Figure 4. 56 Two-phase local heat transfer coefficients htp at T1, T3, T5 along the channel flowstream line as a function of the channel length and the mass flux for 𝑎 = 3, Dh = 75 μm and (b) for 𝑎 = 1, 𝐷ℎ = 120 μm microchannels (𝑇𝑖𝑛𝑙𝑒𝑡= 81 °C) for constant 𝑞 = 363 kW m-2. The data points are averaged over time and the connecting lines show the trends along the flowstream as a function of the length. ... 154
Figure 4. 57 3D plot of the local heat transfer coefficient calculated at T1, T3, T5 as function of
mass flux 𝐺 and position for design 1A and Tinlet= 81 ºC and 𝑞 = 271 kW m-2 ,for the design 1A with microchannels of a = 3. The points are averaged over time values. The heat transfer coefficient distribution at the microchannels heat sink changes significantly with 𝐺. ... 155
Figure 4. 58 Local wall temperature fluctuations as a function of mass flux at locations of (a)T1,
(b) T3 and (c) T5 for q = 362 kW m-2 , design 1B (a = 1.5, 𝐷
ℎ = 120 μm) at 𝑇𝑖𝑛𝑙𝑒𝑡. = 81 ˚C. ... 156
Figure 4. 59 Local wall temperature fluctuations at T1(a), T3(b), T5(c) for the highest aspect
ratio of 𝑎 = 3, 𝐷ℎ = 75µm design 1A with (d) simultaneous pressure drop oscillations for the constant heat flux of 363 kW m-2 and varying 𝐺 from 833.3 to 1611.1 kg∙m-2∙s-1. ... 156
Figure 4. 60 Pressure drop oscillations for constant 𝑞 = 363 kW m-2 and varying 𝐺 from 833.3 to 1611.1 kg∙m-2∙s-1. ... 157
Figure 4. 61 Dryout parallel instability in microchannels of high aspect ratio 𝑎 = 3 and 𝐷ℎ= 75 μm at T3. Parallel channel instabilities were observed to occur, resulting in flow reversal and temporal dryout (high amplitude oscillations) in the heat sink for 𝐺 = 833.3 kg∙m-2∙s-1and 𝑞 = 363 kW m- 2. ... 157
Figure 4. 62 Local (T1, T3, T5) wall temperature fluctuations for aspect ratio of 𝑎 = 2, design 2A
(Dh = 66.7 µm) at 𝑇𝑖nlet = 81 ºC with simultaneous pressure drop oscillations for constant q = 271 kW m-2 and varying 𝐺. ... 159
Figure 4. 63 3D plot of the local heat transfer coefficient calculated at locations of T1, T3, T5 as
xxiv
and (b) the design of 3B. The points are averaged values over time and the grey connecting lines show the trends along the flowstream line of the microchannels head sink. The heat transfer coefficient distribution at the microchannels heat sink changes significantly with 𝐺. ... 160
Figure 4. 64 Sequence of high-speed images recorded at 5000 Hz at location of T3 for the design
of 2A, 𝑎 = 2, 𝐷ℎ = 66.7 µm, the heat flux of 363 kW m-2 and 𝑇𝑖𝑛𝑙𝑒𝑡 = 81 ºC. ... 161
Figure 4. 65 3D plot of the local heat transfer coefficient at T1, T3, T5 as a function of mass flux
for the design 3B (𝑎 = 0.5, 𝐷ℎ = 66.7µm) at Tinlet = 81 ºC and for 𝑞 = 363 kW m-2,. The points are averaged over time and the lines that connect the punts show the trends along the flowstream line of the microchannels heat sink. The heat transfer coefficient distribution in the microchannels heat sink changes significantly with G. ... 162
Figure 4. 66 Sequential images of sidewall bubble growing during flow boiling for 𝐷ℎ = 120 μm and 𝑎 = 1.5, square cross section microchannel. White arrows show height of bubble and the yellow arrows show the axial growth of the elongated bubble. Arrow on top shows bulk flow direction. ... 163
Figure 4. 67 (a) Bubble height and (b) bubble diameter as a function of time for 𝑎 = 1.5
microchannels at 𝑞 = 151 kW m-2 and Tinlet = 25 ºC. ... 164
Figure 4. 68 (a) Bubble height and (b) bubble diameter as a function of normalised time for 𝑎 =
1.5 microchannels at 𝑞 = 151 kW m-2 and Tinlet = 25 ºC. ... 165
Chapter 5
Figure 5. 1 ... 175 Figure 5. 2 Temporal variation in wall temperature along the centreline as recorded for 80 s using
infrared imaging from the inlet (a), middle (c) and outlet (e) of the microchannel for 𝐺 =7.37 kg m-2 s-1 and from q =13.9 to 62.95 kW m-2. The wall temperature was averaged along the centreline in the stream-wise direction. The associated averaged heat transfer coefficients are presented in (b), (d), (f), respectively and show the different heat transfer trends during two-phase flow boiling modes at the inlet, middle and outlet sections of the microchannel ... 178
Figure 5. 3 Typical flow regimes at the inlet of the investigated high aspect ratio rectangular
microchannel. Sequence of optical images from the heater side of the inlet for 𝐺 =7.37 kg m-2s1 and 𝑞 =30.97 kW m-2 and 42.78 kW m-2. The images were cropped to show the section where the temperature measurements were carried out. ... 178
Figure 5. 4 3D plots of the heat transfer coefficient as a function of time and whole channel length
(a) for 𝑞 = 3.62 18 kW m-2 (single-phase) and 𝑞 = 61.92 kW m-2 (two-phase) (b) for q =13.9 kW m-2 and q =17.28 kW m-2 (two-phase), (c) for 𝑞 = 23.89 kW m-2 (two-phase), (d) for 𝑞 = 30.97 kW m-2 , (e) for q = 42.28 kW m-2 (two-phase), (f) for q = 47.28 kW m-2 and (g) for q = 61.95 kW m-2 (two-phase) ... 182
xxv
Figure 5. 5 3D plots of local two-phase heat transfer coefficients ℎ𝑡(𝑥) along the whole length at the centre of the microchannel centreline in the stream-wise direction with time intervals of 0.015 s for one cycle of dryout. The local values of htp (x,t) were plotted for the heat fluxes of (a) q = 30.97 kW m-2 , (b) 𝑞 = 42.28 kW m-2, and (c) 𝑞 = 61.95 kW m-2 and simultaneous flow visualisation results are shown for 𝑞 = 30.97 kW m-2. ... 185
Figure 5. 6 Local two-phase heat transfer coefficient ℎ𝑡p(𝑥, 𝑡) along the microchannel centreline in the stream-wise direction with a time interval of 0.015 s for the outlet of the microchannel for (a) 𝑞 = 30.97 kW m-2 and 𝑞 = 61.95 kW m-2 (b). ... 187
Figure 5. 7 (a) Comparison between the time averaged, two-phase heat transfer coefficient for
the PDMS microchannel inlet section with data from Wang and Sefiane for 𝐺 = 44.8 kg m2 s-1 using FC-72 with Dℎ = 571 µm rectangular high aspect ratio (a = 20) microchannel for heat fluxes from 2 to12 kW m-2 and (b) Effect of heat flux on local heat transfer coefficient at the inlet, middle and outlet of the PDMS microchannel. The heat transfer coefficients were averaged over 80 s using the same data as that used for Figures 5.2b, d and f, for all the sections separately... 189
Figure 5. 8 Comparison of the critical heat flux as a function of mass flux, from this study and
previous experimental studies as well as the calculated critical heat flux obtained by Katto correlation. ... 189
Figure 5. 9 Sequence of optical images obtained with high-speed visualisation from the
transparent ITO heater base. The two graphs below the images show the effect of partial thin film dryout on htp. The images were captured for 𝐺 = 7.37 kg m-2s-1 and 𝑞 = 30.47 kW m-2. ... 190
Figure 5. 10 2D maps of the local two-phase heat transfer coefficient htp (x, y, t) with time for, the inlet (a) and the outlet (b) of the microchannel heat sink for q = 30.97 kW m-2. ... 192
Figure 5. 11 (a) 𝑇𝑤,𝑅 (𝑥, 𝑦, 𝑡) (b) htp (x, y, t) during a cycle of dryout at 𝑞 = 42.48 kW∙m-2 at the channel outlet. The observed flow patterns were bubbly (i), slug (ii), annular (iii), annular dryout (iv), dryout (v) and liquid rewetting (vi). ... 193
Figure 5. 12 Local two–phase heat transfer coefficients (ℎ𝑡𝑝 (𝑥, 𝑦, 𝑡)) calculated for different flow regimes with 𝑞 = 42.28 kW m-2 and G = 7.37 kg m-2s -1. The three snapshots were captured from positions an axial distance of 10 to 20 mm from the inlet, where ℎ𝑡𝑝 (𝑥, 𝑦, 𝑡) was measured between 862-1544 W m-2 K-1. Bubbly-slug flow (a), annular flow (b) and annular flow with partial wall dryout (c) were the observed flow regimes. ... 194
Figure 5. 13ℎ𝑡𝑝 (𝑥, 𝑦, 𝑡) during a cycle of dryout at 𝑞 = 61.95 kW∙m-2 at the channel outlet (3). ... 195
Figure 5. 14 The relationship between local two-phase heat transfer coefficient and vapour quality
xxvi
Figure 5. 15 (a) Inset infrared images showing the clear differentiation of bubble boundaries
during bubble growth near the corner at 𝑞 = 23.89 kW m-2. (b) Wall temperature profiles along the microchannel centreline of the outlet for q = 30.97 kW m-2. ... 198
Figure 5. 16 Two-phase pressure fluctuations at the inlet (Ps1) and outlet (Ps2) of the microchannel and the averaged locally two-phase hat transfer coefficient calculated at the channel inlet section for 29 s time interval at q = 30.97 kW m-2 and G = 7.37 kg m-2 s-1. ... 200
Chapter 6
Figure 6. 1. (a) 2D wall temperature measurements obtained with liquid crystal thermography
method by Kenning for pool boiling. The photograph shows the crystal layer on the rear of the plate. The nucleation sites are related to the centres of cold spots and the rings. ... 205
Figure 6. 2 Time averaged interfacial heat transfer coefficients for inlet, middle and outlet with
increasing heat flux and time averaged pressure drop for the mass fluxes of (a) 36.87 kg m-2 s-1, (b) 73.74 kg m-2 s-1 and (c) 101.2 kg m-2 s-1. ... 207
Figure 6. 3 3D plot of the local single-phase heat transfer coefficient (ℎ𝑠𝑝,𝑛 ) spatially averaged across the channel with, as a function of time and channel length for 𝐺 = 73.74 kg m-2s-1 and 𝑞 = 27.66 kW m-2. ... 211
Figure 6. 4 3D plots of the local ℎ𝑡𝑝,𝑖𝑛 spatially averaged across the microchannel width at 9 equally spaced locations, as a function of time and channel length at ONB for (a) 36.87 kg m-2 s -1and q = 35 kWm-2(b) 73.74 kg m-2 s-1and q=36.87 kW m-2 and (c) G = 101.2 kg m-2 s-1 and q = 45.26 kW m-2. ... 212
Figure 6. 5 Optical images recorded at 200 Hz from the optically transparent ITO/glass channel
base for the.(a) inlet (b) middle and (c)outlet for G = 101.2 kg m-2 s-1and q = 45.26 kW m-2 (ONB). The arrow on the left shows the liquid flow direction. ... 213
Figure 6. 6 (a) 3D plot of the local two-phase interfacial heat transfer coefficient (ℎ𝑡𝑝,𝑖𝑛) as a function of time at 𝑞 = 43.41 kW m-2 where the maximum heat transfer coefficient occurs for 𝐺 = 36.87 kg m-2 s-1 and (b) thermal image sequences obtained with high- speed IR camera from PDMS. The thermal images show interfacial wall temperature distribution of high spatial and temporal resolution of 15 µm/pixel and 200 fps during bubbly flow, confinement, slug and annular flow regime at the inlet of the microchannel with a time interval of 0.016 s.. ... 215
Figure 6. 7 (a) 3D plot of the spatially averaged two-phase ℎ𝑡𝑝,𝑖𝑛 across the microchannel width at 9 equally spaced positions along the microchannel domain, as a function of time and length at increased heat flux after ONB at the heat flux of 𝑞 = 55.23 kW m-2 and 𝐺 = 110.62 kg m-2 s-1. ... 217
Figure 6. 8 (a) 3D plot of the spatially averaged interfacial heat transfer (ℎ𝑡𝑝,𝑖𝑛 ) across the microchannel width at 9 equally spaced positions along the microchannel domain, as a function
![Figure 2. 5 Flow boiling heat transfer coefficient versus channel wall heat flux at low vapour quality with R245fa [50]](https://thumb-eu.123doks.com/thumbv2/123doknet/14742449.755358/57.892.284.724.257.534/figure-boiling-transfer-coefficient-versus-channel-vapour-quality.webp)

![Figure 2. 8 Variation in mean heat transfer coefficients along microchannels of different shapes [67]](https://thumb-eu.123doks.com/thumbv2/123doknet/14742449.755358/62.892.271.676.395.703/figure-variation-mean-transfer-coefficients-microchannels-different-shapes.webp)
![Figure 2. 14 (a) Flow pattern map by Ong and Thome [46] and (b) flow patterns recorded during FC-72 boiling in a high aspect ratio rectangular channel with](https://thumb-eu.123doks.com/thumbv2/123doknet/14742449.755358/72.892.266.676.124.754/figure-pattern-thome-patterns-recorded-boiling-rectangular-channel.webp)