HAL Id: hal-00200276
https://hal.archives-ouvertes.fr/hal-00200276
Submitted on 7 Feb 2020
HAL is a multi-disciplinary open access
archive for the deposit and dissemination of
sci-entific research documents, whether they are
pub-lished or not. The documents may come from
teaching and research institutions in France or
L’archive ouverte pluridisciplinaire HAL, est
destinée au dépôt et à la diffusion de documents
scientifiques de niveau recherche, publiés ou non,
émanant des établissements d’enseignement et de
recherche français ou étrangers, des laboratoires
Boiling heat transfer in mini-channels: influence of the
hydraulic diameter
Bruno Agostini, André Bontemps, Barbara Watel, Bernard Thonon
To cite this version:
Bruno Agostini, André Bontemps, Barbara Watel, Bernard Thonon. Boiling heat transfer in
mini-channels: influence of the hydraulic diameter. 21st International Congress of Refrigeration, Aug 2003,
Washington, United States. �hal-00200276�
BOILING HEAT TRANSFER IN MINI-CHANNELS: INFLUENCE OF THE HYDRAULIC DIAMETER
Bruno AOOSTINI(i,3), Andre BONTEMPs(I,Z), Barbara WATEL(l,2), Bernard THONON(l)
(1) CEA-GRETh, 17 rue des Martyrs, 38054 GRENOBLE, (2) LEGIIGRETh, Universite Joseph Fourier, 17 rue des Martyrs, 38054 GRENOBLE, (3) 15 rue Denis Papin 38000 Grenoble
ABSTRACT
The present experimental study shows how the reduction of the hydraulic diameter affects the heat transfer coefficient for a boiling flow in mini-channels. Flat aluminium multipart extruded tubes composed of parallel rectangular channels with hydraulic diameters 0.77 and 2.01 mm were used with refrigerant Rl34a. It was shown that the reduction of the hydraulic diameter increased the heat transfer coefficient and favored dry-out, probably because of the thinning of the liquid layer due to the bubble confinement. However it was found that the quality averaged heat transfer coefficient was still greater than what would be obtained in macro-tubes.
1. INTRODUCT ION
New environmental policies on global warming require that emissions of gases with significant greenhouse effect should be decreased. The use of mini-channel heat exchangers (hydraulic diameter about 1 mm) contributes to achieve this pwpose thanks to higher heat transfer coefficients, thermal efficiency and a lower required fluid mass. They are widely used in condensers for automobile air-conditioning and will be used in evaporators and domestic air conditioning. However, more general use requires a better understanding of boiling heat transfer in confined spaces. In particular it is necessary to outline the effects of the confinement on heat transfer in mini-channels.
In spite of numerous publications on the experimental study of heat transfer in boiling flows, still few concern the specific study of the inftuence of the hydraulic diameter on the boiling heat transfer coefficient. Consequently classical correlations of boiling heat transfer coefficient in macro-tubes take into account the effects of the hydraulic diameter rather poorly. The Steiner and Taborek (1992) correlation includes a Dt;0.4 term based on some experimental results for hydraulic diameters as low as l mm. Ishibashi and Nishikawa (1969) experimental results within a confined annular space showed that when the bubbles were confined, the heat transfer coefficient was proportional to
Dt;0
67. Aritomi et al. (1993) obtained Dt;0·75 for boiling flows in annular spaces withDh < 4 m
m. Tran et al. (1997) proposed a correlation for flow boiling heat transfer in mini-cham1els with aDt;1
for the confinement effect. Finally, Kew and Cornwell (1994) argued that the confinement should have a sizable influence on the heat transfer coefficient when a new dimensionless number, the confinement number defined as Co = ( cr/ (D;
· g·
(p1 -
Pv))
)0·5, is greater than
0.5.2. EXPERIMENTAL APPARATUS 2.1 The test loop and test section
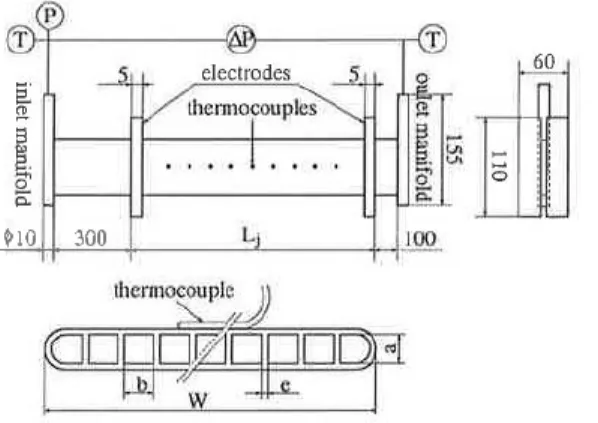
The test loop includes a liquid pump (10- 100 Uh) and a glycol-water mixture circuit for heat evacuation. Subcooled liquid enters the inlet manifold, then is vaporised in the test section and condensed in a heat exchanger by the water glycol flow. The test section, shown in figure 1, consists of two different flat tubes. The inlet and outlet manifolds are 10 Lmn diameter tubes in aU pattern at 90 degrees. The manifold diameter is five to thirteen times higher than the channel hydraulic diameter to limit fluid distribution effects. The whole test section is thermally insulated with 40 mm thick wrapping foam. For heat transfer measurements the length Lj of the tube (zone @) was heated thanks to Joule effect by passing an electric current (up to 2 800 A) from two brazed electrodes through the tube wall. Experimental conditions are summarized in table 1.
Figure 1 shows the test section and instrumentation. Wall temperatures Twj (0 < j < 9) on the tube external surface were measured with 0.5 mm diameter calibrated type E thermocouples. Fluid inlet and outlet temperatures (re spectively Tfl,i and TR,o) were measured with 1 mm diameter calibrated type K thermocouples. Calibration was carried out every 5 K between 268 and 333 K witb a Rosemount 162-CE platinum thermometer. The thermocouples used for wall temperature measurements were equally spaced and fixed with aluminium adhesive on the tube surface. Thanks to the aluminium high thermal conductivity and the tube walls low thickness (0.35 rrun) the measured temperature is equal to the wall temperature in contact with the fluid (the difference was estimated less than 0.01 K). The ftuid
Table 1: Operating conditions and uncertainties tube 1 tube2 m (kg/m2 s) 90-295 ± 1.7-8.6% 214-469 ± 3.3-8.6% q (kW/m2) 6-31.6 ±2�.1% 2.8-19.5 ± 3% Tw, T11 (K) 276-308 ± 0.2-3 K 281-307 ± 0.2-2 K � 'fsub,i (K) 1-17 ±0.1 K 1-8 ±0.1 K p; (kPa) 405 ± 3.4% 517 ±2.7%
�P
(kPa) 9.5-37.5 ± 1.2-17% 153-1570 ± 0.3-3.7% a(kWjm2 K) 0.8-10.3 ± 6-30% 0.6-32.5 ± 5-30% Xo 0.26-1 ± 1-7% 0.23-0.9 ±2-9% Co 0.46 1.15flow ascendant ascendant
inlet pressure was measured with a calibrated Rosemount type II absolute pressure sensor. Three differential pressure sensors calibrated from 0 to 7 .6, 40.5 and 182 kPa measure the pressure loss through the test section. A Rosemount Micro-motion coriolis flowmeter was used to measure the mass flux of Rl34a downstream of the pump. The heating voltage
U
and current I were measured directly through a HP 3421A multiplexer.2.2 The channel geometry
The determination of the channel dimensions has been carried out using scanning electron microscopy. The dimensions
of several channels were measured and the average and standard deviation were calculated. The uncertainty was estimated as twice the standard deviation (95 % of the measurements in this interval). The hydraulic diameter was calculated with the total flow area
(S11)
and wet perimeter (PJL) measured from electron microscopy imaging in orderto take into account the effect of the first and last channels, and the corners which are rounded, yielding Dh = 4S
11/
P11.
tube
1 2
Table 2: Geometric dimensions measurements. b [mrn] a[mm] Dh [mm] y N L [mrn] W [mrn]
3.28 1.47 2.01 0.45 11 690 40
±0.02 ±0.02 ±0.06 ±0.01 ±5
0.73 0.72 0.77 0.98 18 695 18
±0.01 ±0.01 ±0.054 ±0.03 ±2.5
3. OPERATING CONDITIONS AND PROCEDURE
e [mm] 0.35
±0.03 0.25
±0.03
Steady state values were monitored thanks to the Hewlett Packard 3421A multiplexer with a 30 minutes time lapse between each change in mass flow rate or heat flux. An averaging occurred after every 20 values and uncertainties were calculated according to Kline and McClintock (1953) and Moffat (1982, 1985) methods, with twice the standard deviation. For every fixed mass flow rate, the heat flux was adjusted in order to obtain series of outlet vapor qualities between 0.2 and 1 with a step of 0.05 approximatively. At the same time the pressure was kept constant by adjusting the quantity of fluid in the test loop for each heat flux and mass flow rate variation. The total electrical power P dissipated in the test section was calculated as the product of voltage and current. The variations of Rl34a thermopbysical properties with temperature were calculated with the REFPROP 6.01 software. Uncertainties are reported in table l.
4. DATA REDUCTION
The heat flux and power dissipated between 0 and z are calculated respectively by
u .] . z
q=- and
Q(z)=U·l·-.
S Lj (1)
The temperature of the subcooled fluid absorbing the power
Q(z)
is calculated with a heat balance:()
( )
Q(<J)
_ c,,,t(O)+c1,,t(z)
Tjt
z =TJt
0 +M. _ with CpJ =
2. .
·Cp,J (2)
This equation is implicit with
Tfl
(z) becausecp,1(z)
is a function of T11(z) so that it must be solved iteratively. The tube coordinate Zboil where bulk boiling starts is the position along the tube where the fluid bulk temperature is equal to the saturation temperature at the local pressure, since liquid pressure losses cannot be neglected in mini-channels. Therefore both the temperature and the pressure values must be iterated to determine Zboil because the single-phase pressure loss is a function ofZboil·
In order to calculate the vapor quality, the local pressure and the fluid temperature, a beat balance was used over the length dz giving
oQ= M. [x·cp,v(Tsar)
·dTsm + (1-x)·Cp,i(T.rat) dTsat +hiv(Tsat +
dTsar) ·dx]. (3)The measured total pressure drop through the test section includes the pressure drop of the single-phase liquid flow
(6.p10),
since subcooled fluid enters the tube, and the two-phase flow pressure drop. Figure 2 shows the average pressure drop gradient(
6.Pmes-
6.pt0)
I Lrp,
withLTP
= L-zwu, as a function of the outlet qualityXo-�10 300
Figure 1: The test section.
200 • 214kg/m2s 180 0 251 • 160 .. 286. 'i7 347 • 8 140 e 469"
...
"'�
120J
100...
80�
60 <lFigure 2: Measured average pressure drop gradient, Dh =
0.77 mm
The homogeneous model was chosen to model the local pressure because this model predicts that
(6.Pmes
-6.p10) I LTP
is linear with x0 when the gravity and acceleration pressure losses are negligible. This is shown on figure 2where the lines represent the predictions of the homogeneous model.
The two-phase pressure drop and the saturation temperature depend on the vapor quality so that the local pres sure, fluid temperature and quality must be calculated simultaneously with an iterative method. The details of these calculations are given by Agostini (2002).
Finally the heat transfer coefficient is calculated by (j
a(z) =
( )
( )
' 7;,, Z
-
G·m :Z5. EXPERIMENTAL RESULTS
Figures 3 and 4 show the local heat transfer coefficient as a function of the local quality for one given mass flow rate and several heat fluxes. The trends are the same for the other tested mass flow rates. The heat transfer coefficient does not depend on the heat flux given the uncertainties. For both tubes there exists a critical quality beyond which the heat transfer coefficient decreases sharply with increasing vapor quality and this critical quality is smaller for the smallest hydraulic diameter.
7000 in= 83 kg I m2 s 11000 in= 467 kg I m2 s I 6088 W 1m2 10000 -I-4440 W I m2 6000 *" 7516. 9000 X 5300. 5000 "'*' 7904 • "*"6117 • -& 8697 • 8000 -e- 6763" :;2 ... 9546. :;2 7000 -- 7644' .... 4000 s -&- 10043. "'e � 8388' - --- 10759. - 6000
�
�
-- 8725. 3000 ... 11311 • 5000 -A-10197. l:l ... 11942 • l:l 2000 � 12826. 4000 -- 11780. � 12619. ...,.._ 13442" 3000 _,__ 13131 " 1000 2000 � 14565" 0 1000 0 0.1 0.2 0 3 0.4 0.5 0.6 0.7 0.8 0.9 I 0 0.1 0.2 0.3 0.4 0.5 0.6 0.7 0.8 " "Figure 3: Local heat transfer coefficient versus local qual ity, l>), = 2.01 mm
Figure 4: Local heat transfer coefficient versus local qual ity, Dh = 0.77 mm
This critical quality was defined as the intersection of lines fitted by linear regressions when the heat transfer coefficient is plotted as a function of the local quality. This method Jed to Xcr = 0.43 ± 14% for tube 1 and Xcr = 0.19 ± 26% for tube 2. The critical quality was found to be independent of the heat flux and mass flow rate in the
tested range. It doesn't mean that there is no such dependence but rather that if Xcr depends on q and 1h, this variation does not appear because of the uncertainties.
The physical interpretation of this critical quality is easier when studying the local wall temperatures and their statistical uncertainties as a function of the local quality. The trends are the same for both tubes. In the case of tube 1 for example, for qualities lesser than the critical quality both the local wall temperatures and their uncertainties are constant as expected. Furthermore 6.Tw is about 0.2-0.3 K which is an acceptable uncertainty for temperature measurements with a boiling flow. On the contrary beyond Xcr. Tw and 6.Tw increase steadily with x to the point that
the uncertainty is multiplied by 10 at high qualities.
These phenomena are consistent with a partial dry-out of the liquid layer at the internal wall. The following
interpretation is proposed. As the vapor quality increases for a given heat flux, the thickness of the liquid layer
decreases so that dry-out occurs more easily. Below a critical thickness, corresponding to a critical quality, a periodic
dry-out alternates with a regeneration of the liquid layer. Since the wall is periodically in contact with liquid or gas,
the heat transfer undergoes important fluctuations, because of the bad heat transfer with gas. These fluctuations are all
the more important that the vapor quality is high, because a high quality means more frequent dry-outs. Finally these
heat transfer coefficient fluctuations cause the time averaged wall temperature to increase and fluctuate with quality,
so that 6.Tw increases with x.
Cornwell and Kew (1992, 1995) proposed that a new flow configuration, the confined bubble regime, is dominant
in mini-channels where the bubbles are confined between the channels walls. In such a regime, these confined bubbles
thin the liquid layer, all the more that the confinement is important. Furthermore the liquid layer should be regenerated
between two successive passing bubbles. This model could explain why the critical quality decreases with the hydraulic
diameter because of the liquid Layer breakdown \mder the confined bubbles.
In order to compare the heat transfer coefficients in tubes 1 and 2, data points must be carefully selected. For a
proper comparison, measurements with very close heat fluxes, mass flow rates, vapor qualit1es and boiling regimes for both tubes must be used. Ideally the working pressure should also be the same, but pressure has no significant
influence on the heat transfer coefficient in the convective boiling regime and the pressure difference between tube 1 and 2 is not that important (±12% of the average pressure). Furthermore Agostini et al. (2002) measurements on tube 1 showed that between 417 and 604 kPa the pressure had no sizable influence on the heat transfer coefficient, even in
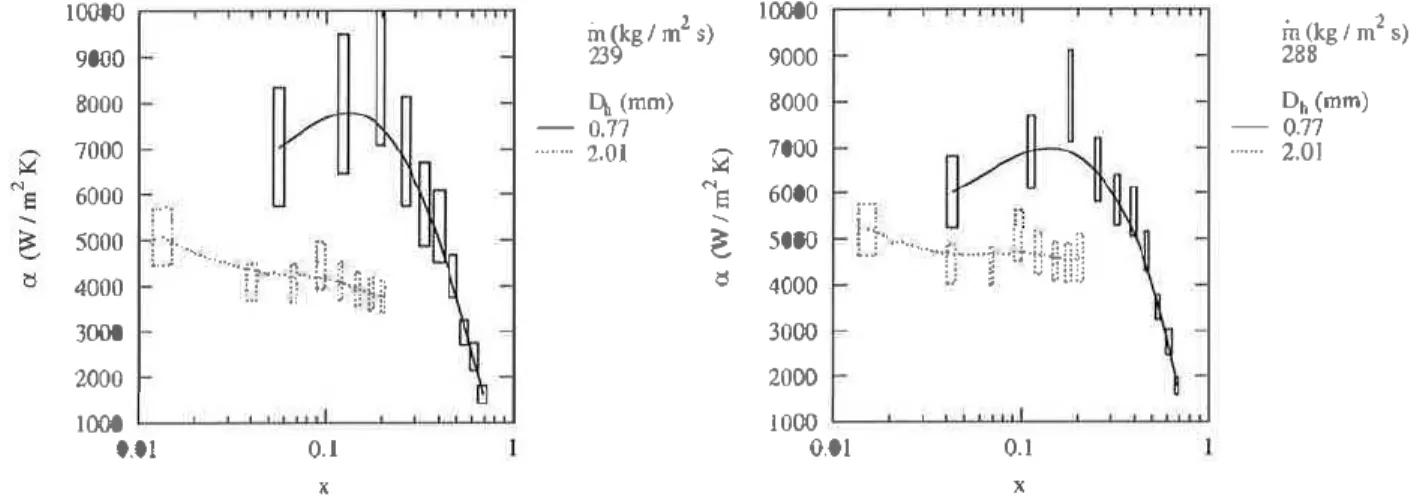
the nucleate boiling regime. Among about 750 data points available for each tube, only 8 had such characteristics. As illustrated on figures 5 and 6 the heat transfer coefficient is higher in tube 2 before any dry-out occurs. The enhancement ratio is constant for the 8 data points given the uncertainties. The average enhancement ratio is
o:n/an
= 1.74±0.31, that is(Dh;rz/ Dh,TJ)-0.6±0·1
which is, given the uncertainties, close to the values proposed byIshibashi and Nishikawa (1969) and Aritomi et al. (1993). It s i not clear how Tran et at. (1997) established the term
Dt;1
because the range of tested hydraulic diameters, 2.4-2.92 mm, is too small to build a correlation. It is probablefrom their articles that it comes from an analogy with single-phase flow classical theory and has no e)(perimental ba
sis. On the contrary the
D
h"0·
4 term proposed by the Steiner and Taborek (1992) is based on some e)(perimental data.Nevertheless the data concerning refrigerant fluids (R11 and R113) were pettormed for hydraulic diameters from 7 to
20 mm only. The lowest hydraulic diameters (from 1 to 5 mm) were tested with Helium I only so that this
Dt;0.4
factoris difficult to compare with the present results.
I 0000 ,--,--,--.-....-n.--rr-..--r-r-rTTTI 9000 8000 7000 6000 5000 4000 3000 2000
r·I
tJ·-···n····n···llhtl�
I 000 �.-_,__._�.._._._u__...__.__._...J....U...u O.QJ 0.1 X in�
kg/ m2 s) 23 Db (mm) - 0.77 ... 2.01 � M e ...�
ts 10000 9000 8000 7000 6000 5000 4000 3000 2000 1000 O.Ql :"�l+··· .. ···n-····�···1HJnrlfl
0.1 X in(kg/m2s) 288 Dh (mm) - 0.77 ... 2.01Figure 5: Influence of the confinement on the heat trans fer coefficient, th = 239 kg/ m2 s
Figure 6: Influence of the confinement on the heat trans fer coefficient, rh = 288 kg/ m2 s
Although the confinement increases the heat transfer coefficient, it was shown that dry-out had the opposite effect and was dominant in mini-channels. Thus it is possible that the average heat transfer coefficient over the boiling length is not increased compared to what would be measured in a macro-tube. In order to answer this question this average e)(perimental heat transfer coefficient divided by that predicted by Shah (1982) in a 10 rom diameter tube was represented as a function of the tested heat fluxes on figures 7 and 8. The conclusion is that even at high heat fluxes, that is high vapor qualities and important dry-out, the average heat transfer coefficient in mini-channels remains higher than what would be obtained in a macro-tube. Thus the dominant dry-out observed in mini-channels does not completely compensate for the enhancement effect due to the confinement.
6. CONCLUSIONS
The influence of the hydraulic diameter on the heat transfer coefficient in mini-channels was experimentally stud ied. It was found that partial dry-out occurred in mini-channels at lower vapor qualities than in macro-tubes. When the hydraulic diameter decreases from 2.01 to 0.77 rom, the critical quality decreases from 0.43 to 0.19. It was also experimentally shown that when the hydraulic diameter decreases from 2.01 to 0.77 rnrn, the heat transfer coefficient
coefficient is multiplied by 1.74 approximatly. However this enhancement is somehow balanced by the early occurence of dry-out. Nevertheless the heat transfer coefficient averaged on the whole boiling length remains higher than what would be obtained in a macro-tube. As a conclusion the decrease of the hydraulic diameter is an effective means of
4 3.5
�
3IJ'
... 2.5 Q. >< ll:S" 2 1.5 1 5 in (kg /m2 s) 88.80 0 117.11 • 176.63 0 236.03 • 292.40 A 10 15 20 25 30 35q (kW
I m2)Figure 7: Comparison of the average heat transfer coef ficient and that predicted by the Shah (1982) correlation, Db =2.01 nun 4 3.5 3
�
IJ'
-. 2.5 0. >< ll:S" 2 1.5 I 2 4 6 8 . 2 m(kg/m sJ 20 248 282 342 467 622 10 12 14 16 q (kW /m2) 0 • 0 • 8 • 18 20Figure 8: Comparison of the average heat transfer coef ficient and that predicted by the Shah (1982) correlation, �=0.77mm
increasing the heat transfer coefficient in boiling ftows. A more thorough study of geometric effects should allow a better understanding of the early dry-out in mini-channels.
7. NOMENCLATURE
Latin letters
a channel height (m)
b channel width (m) Greek letters
Cp specific heat capacity (1/kg K) a heat transfer coefficient (W/m2K)
Dh hydraulic diameter (m) y=a/b aspect ratio
g gravity acceleration (m/s2) p density (kgjm3)
h specific enthalpy (Jjkg) JJ. dynamic viscosity (N sjrn2)
h1v latent heat of vaporization (J/kg) () surface tension (Njm)
Lj tube heated length (m) Subscripts
La adiabatic tube length (m) boil boiling point
M mass flow rate (kg/s) cr critical
til mass flux (kgjm2 s) in inlet
N number of channels ft fluid
Pn total wet perimeter (m) liquid
p pressure (bar) lo all liquid flow
6p pressure loss (bar) mes measured
Q
thermal power (W) out outletq heat flux (Wjm2) sat saturation
sft total wet area (m2) TP two-phase flow
v specific volume (m3 /kg) v vapor
X quality w wall
z coordinate (m) Dimensionless numbers
s internal heated surface (m2) Co confinement number
T temperature (K) 4f friction factor
6'fsub,in inlet subcooling (K) w test section width (m)
REFERENCES
Agostini, B., 2002.
E
tude experimentale de !'ebullition en convection forcee de fluide refrigerant dans des mini canaux. Ph.D. thesis, Universite Joseph Fourier- Grenoble I.Agostini, B., Watel, B., Bontemps, A., Thonon, B., 2002. Ascendant flow boiling of refrigerant Rl34a in small channels. Submitted to International Journal of Heat ana Fluid Flow.
Aritomi, M., Miyata, T., Horiguchi, M., Sudi, S., 1993. Thermohydraulics of boiling two-phase flow in high conversion
light water reactors (thermohydraulics at low velocities). International Journal of Multiphase Flow, vol. 19, no. 1: pp. 51-63.
Cornwell, K., Kew, P., 1992. Boiling in small parallel channels. In Proceedings of the International Conference on Energy Efficiency in Process Technology. Elsevier Applied Science, pp. 624-638.
Cornwell, K., Kew, P. A., 1995. Evaporation in micro-channel heat exchangers. In Proceedings of the 411 U.K. National Conference on Heat Transfer. ImechE, pp. 289-294.
Ishibashi, E., Nishikawa, K., 1969. Saturated boiling heat transfer in narrow spaces. lmernational Journal of Heat and Mass Transfer, vol. 12: pp. 863-894.
Kew, P. A., Cornwell, K., 1994. Confined bubble flow and boiling in narrow spaces. In l01h lntemativnal Heat Transfer Conference. Taylor & Francis, vol. 7, pp. 473-478.
Kline, S., McClintock, F., 1953. Describing uncertainties in single-sample experiments. Mechanical Engineering: pp. 3-8.
Moffat, R., 1982. Contributions to the theory of single-sample uncertainty analysis. Journal of Fluids Engineering,
vol. 104: pp. 250-261.
Moffat, R., 1985. Using uncertainty analysis in the planning of an experiment. Journal of Fluids Engineering, vot. 107: pp. 173-182.
Shah, M., 1982. Chart correlation for saturated boiling heat transfer: equations and further study. ASHRAE Transac tions, vol. 88: pp. 185-196.
Steiner, D., Taborek, J., 1992. Flow boiling heat transfer in vertical tubes correlated by an asymptotic model. Heat Transfer Engineering, vol. 13, no. 2: pp. 43-69.
Tran, T., Wambsganss, M., Chyu, M., France, D., 1997. A correlation for nucleate flow boiling in small channels. In R. K. Shah, editor, Compact Heat Exchangers for the Process Industries. Begell House, inc., pp. 353-363.
TRANSFERTS DE CHALEUR EN EBULLITION DANS LES MIN I-CANAUX : INFLUENCE DU DIAMETRE HYDRAULIQUE
RESUME : Cette etude experimentale montre comment Ia reduction du diametre hydraulique in flue sur Ie coefficient d'echange de chaleur tors de !'ebullition en convection forcee d'un ftuide refrigerant dans des mini-canaux. Des tubes plats a canaux paralleles de diametres hydrauliques 2,01 et 0,77 ont ete etudies avec du refrigerant R134a. Nos mesures ont ntis en evidence que Ia reduction du diametre hydraulique augmentait Ie coefficient d'echange de chaleur et favorisait l'assechement, probablement a cause de J'amincissement de Ia couche liquide dfl au confinement des bulles. Cependant nous avons montrt� que le coefficient d'echange moyenne le long du tube demeure superieur a celui qui sera it obtenu dans des macro-tubes.