HAL Id: tel-01435145
https://tel.archives-ouvertes.fr/tel-01435145
Submitted on 13 Jan 2017
HAL is a multi-disciplinary open access
archive for the deposit and dissemination of sci-entific research documents, whether they are pub-lished or not. The documents may come from teaching and research institutions in France or abroad, or from public or private research centers.
L’archive ouverte pluridisciplinaire HAL, est destinée au dépôt et à la diffusion de documents scientifiques de niveau recherche, publiés ou non, émanant des établissements d’enseignement et de recherche français ou étrangers, des laboratoires publics ou privés.
implemented Lean Manufacturing and Six Sigma
methods : application to French industries
Ibrahim Alhuraish
To cite this version:
Ibrahim Alhuraish. Evaluation of the performance of organizations that implemented Lean Manufac-turing and Six Sigma methods : application to French industries. Chemical and Process Engineering. Université d’Angers, 2016. English. �NNT : 2016ANGE0018�. �tel-01435145�
Ibrahim Alhuraish
Mémoire présenté en vue de l’obtention du
grade de Docteur de l’Université d’Angers
sous le label de L’Université Nantes Angers Le Mans
Discipline : Sciences de l’ingénieur
Laboratoire : Laboratoire Angevin de Recherche en Ingénierie des Systèmes Soutenue le 05 juillet 2016
École doctorale : 503 (STIM) Thèse N° : 78429
L’évaluation des performances des
organisations implémentant les méthodes
Lean Manufacturing et Six Sigma : Application
aux industries Françaises
JURY
Rapporteurs : M. Benoît Eynard, Professeur des universités, Université de Technologie de Compiègne M. Georges Abdulnour,Professeur des universités, Université du Québec à Trois-Rivières
Examinateurs : M.Dumoulin Régis,Professeur des universités, Université d’Angers
M. Samir Lamouri, Professeur des universités, ENSAM Paris Tech
Directeur de Thèse : M. Abdessamad Kobi, Professeur à l’Institut des Sciences et Technologies de l’Ingénieur d’Angers
Remerciements
J’exprime mes profonds remerciements et toute ma gratitude à Monsieur Abdessamad Kobi, Professeur à l’Université d’Angers et directeur de thèse, qui m’a permis d’effectuer cette thèse. Pour ses conseils, son soutien, pour sa constante disponibilité, sa patience, je lui exprime mes sincères et cordiaux remerciements.
Je tiens à exprimer toute ma gratitude et remercie vivement Monsieur Christian Roblédo,
Président de l’université d’Angers et co-directeur de thèse pour son aide, sa disponibilité, ses judicieux conseils pendant toute la durée de ma thèse. Sa patience et sa pédagogie sont exemplaires. Son œil critique m’a été́ très précieux pour guider et structurer mon travail pendant toutes ces années de thèse.
Je tiens également à remercier Monsieur Benoît Eynard, Professeur des universités à l’Université
de Technologie de Compiègne, d’avoir accepté de juger ce travail de recherche, en qualité de rapporteur.
Mes remerciements s’adressent à Monsieur Georges Abdulnour, Professeur des universités à l’Université du Québec à Trois-Rivières, d’avoir accepté d’être parmi les membres du jury en tant que rapporteur et aussi de son engagement dans le comité de suivi de thèse.
Je tiens à remercier Monsieur Samir Lamouri, Professeur des universités à l’ENSAM Paris Tech, d’avoir accepté de juger ce travail de recherche, en qualité d’examinateur.
Je tiens à remercier Monsieur Dumoulin Régis, Professeur des universités, à l’Université
d’Angers, d’avoir accepté de juger ce travail de recherche et sa participation au comité de suivi de thèse.
Je ne saurais assez exprimer mes remerciements les plus sincères pour le gouvernement saoudien de m’avoir soutenu à réaliser ce travail de thèse. Mes remerciements vont également au gouvernement français qui m’a donné l'occasion d'étudier en France.
Un immense merci à ma chère famille pour leur amour et leur soutien constant et leur encouragement. Je dédie cette thèse à mon père Mohammed Alhuraish, à ma mère Sara Alhuraish qui a tout fait pour moi pendant des moments difficiles, à mes frères et sœurs Thamer, Khaled, Abudallah, Nora, Fadwa, et sans oublier ma tendre chérie Maha pour son soutien.
Un très grand merci à tous les membres du laboratoire Angevin de Recherche en Ingénierie des Systèmes (LARIS) de l'Université d'Angers pour leur conseil et leur soutien et tout le personnel de 'Institut des Sciences et Techniques de l'Ingénieur d'Angers (ISTIA). J’adresse ma cordialité aux collègues du bureau : Achraf, Khadim, Fally, Khaoula, Amine, Alejandro.
Table of Contents
1. GENERAL INTRODUCTION ... 20
1.1. RESEARCH PROBLEM ... 21
1.2. RESEARCH INVESTIGATION &QUESTION ... 22
1.3. RESEARCH OBJECTIVE ... 23
2. LITERATURE REVIEW ... 26
2.1. INTRODUCTION ... 26
2.2. HISTORY OF LEAN MANUFACTURING ... 26
2.3. LEAN MANUFACTURING ... 26
2.4. HISTORY OF SIX SIGMA ... 28
2.5. SIX SIGMA METHOD ... 30
2.6. LEAN MANUFACTURING AND SIX SIGMA TOOLS ... 33
2.7. LEAN MANUFACTURING VS.SIX SIGMA ... 45
2.7.1. Implementation Lean Manufacturing or Six Sigma Isolation ... 46
2.7.2. Begin implementing of Lean Manufacturing or Six Sigma ... 48
2.7.3. Integrate Lean Manufacturing and Six Sigma ... 49
2.8. KEY SUCCESS FACTORS FOR LEAN MANUFACTURING VERSUS SIX SIGMA ... 49
2.9. CONCLUSION ... 53
3. RESEARCH METHODOLOGY ... 56
3.1. RESEARCH DESIGN ... 56
3.2. RELIABILITY TEST ... 57
3.3. SAMPLING TECHNIQUE ... 57
3.4. TESTING THE RELIABILITY ... 58
3.5. TESTING THE NORMALITY ... 60
3.6. RESULTOFTHEDEMOGRAPHICS(DESCRIPTIVE STATISTICS) ... 63
4. ANALYSIS THE IMPACT OF LEAN MANUFACTURING AND/OR SIX-SIGMA IMPLEMENTATION ... 71
4.1. INTRODUCTION ... 71
4.2. IMPACT OF LEAN MANUFACTURING AND/OR SIX-SIGMA IMPLEMENTATION ON PERFORMANCE OUTCOMES ... 71
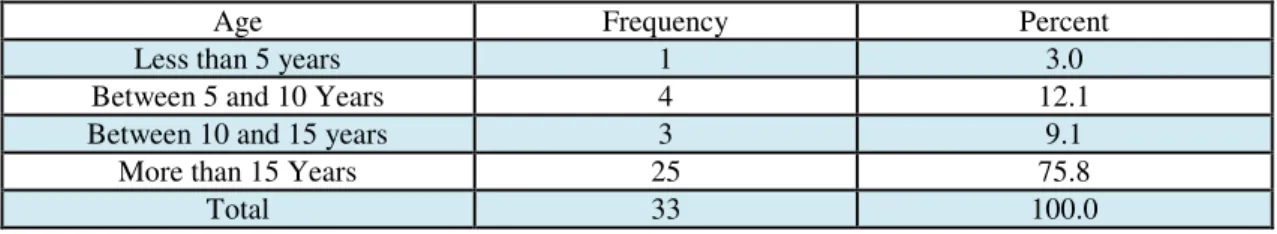
4.2.1. Age ... 83
4.2.2. Period of implementing lean manufacturing and six sigma ... 83
4.2.3. Implementing lean manufacturing and six sigma simultaneously ... 84
4.2.4. Extending lean Manufacturing and six sigma ... 97
4.2.6. Belt system ... 104
4.3. THE KEY SUCCESS FACTORS OF LEAN MANUFACTURING VERSUS SIX SIGMA .. 105
4.3.1. Compare success factors Lean Manufacturing & Six Sigma ... 107
4.3.2. The reason of the comparison of both methods could be valuable ... 114
4.4. CONCLUSION ... 116
5. THE EFFECTIVENESS OF IMPLEMENTING LEAN MANUFACTURING AND SIX SIGMA PRACTICES ... 119
5.1. INTRODUCTION ... 119
5.2. LEAN MANUFACTURING AND SIX SIGMA PRACTICES ... 119
5.3. DEGREE LEVEL OF LEAN MANUFACTURING AND SIX SIGMA IMPLEMENTATION 132 5.4. DEGREE LEVEL OF IMPLEMENTING LEAN MANUFACTURING AND SIX SIGMA PRACTICES WITHIN RESPECTIVE ORGANISATIONS ... 147
5.5. CONCLUSION ... 152
6. EVALUATION OF COMPANIES PERFORMANCE IN THE IMPLEMENTATION OF LEAN MANUFACTURING AND SIX SIGMA WITH DECISION MAKING BASED ON THE ANALYTIC HIERARCHY PROCESS ... 154
6.1. INTRODUCTION ... 154
6.2. OVERVIEW OF ANALYTIC HIERARCHY PROCESS ... 155
6.3. AHP USED FOR BEST OR OPTIMAL METHOD CHOICE ... 157
6.3.1. Evaluation companies performance based on optimal methods ... 157
6.3.2. Evaluation companies performance based on type of industry ... 178
6.4. CONCLUSION ... 186
GENERAL CONCLUSION AND FUTURE RESEARCH ... 187
List of Figure
Chapter 1
Figure 1.1: Scenario adopted for this research ... 23
Chapter 2
Figure 2.1: Lean manufacturing principles ... 29Figure 2.2: Illustration for Ishikawa Diagram ... 35
Figure 2.3: Illustration for check sheet ... 35
Figure 2.4: Typical control chart ... 36
Figure 2.5: Illustration pareto chart ... 38
Figure 2.6: Illustration process flow chart ... 39
Figure 2.7: Illustration Value stream Mapping ... 40
Figure 2.8: Illustrate Kanban card ... 44
Figure 2.9: Illustrate visual card ... 44
Figure 2.10: Illustrate of practicing one piece flow ... 44
Figure 2.11: Illustrate SMED ... 45
Figure 2.12: Diagram demonstrated the similarites between Lean and Six Sigma ... 46
Chapter 3
Figure 3.1: Classification of companies based on professional ... 64Figure 3.2: Classification of companies based on type Industry ... 64
Figure 3.3: Extending of lean manufacturing and six sigma implementation ... 68
Chapter 4
Figure 4.1: Frequency of responses enterprises on increase profit... 73Figure 4.2: Frequency of responses enterprises in reduce cost ... 74
Figure 4.3: Frequency of responses enterprises in improve quality ... 75
Figure 4.4: Frequency of responses enterprises in reduce variation... 76
Figure 4.5: Frequency of responses enterprises in improve productivity... 77
Figure 4.6: Frequency of responses enterprises in reduce time ... 78
Figure 4.7: Frequency of responses enterprises in customer satisfaction... 78
Figure 4.8: Frequency of responses enterprises in decreases inventory ... 79
Figure 4.9: Frequency of responses enterprises in improve safety environment ... 80
Figure 4.10: Frequency of responses enterprises in increases suggestions from the employees 81 Figure 4.11: Frequency of responses enterprises in involve employees ... 82
Figure 4.12: Frequency of responses enterprises in reduce turnover rate ... 83
Figure 4.13: Status of increase profit on implemented lean and six sigma simultaneously ... 86
Figure 4.14: Status of reduce cost on implemented lean manufacturing and six sigma simultaneously ... 86
Figure 4.15: Status of improve quality on implemented lean manufacturing and six sigma simultaneously ... 87
Figure 4.17: Status of improve productivity on implemented lean and six sigma simultaneously
... 88
Figure 4.18: Status of reduce time on implemented lean and six sigma simultaneously ... 89
Figure 4.19: Status of safety environment on implemented lean and six sigma simultaneously 90 Figure 4.20: Status of decrease inventory on implemented lean and six sigma simultaneously 91 Figure 4.21: Status of increase customer satisfaction on implemented lean and six sigma simultaneously ... 91
Figure 4.22: Status of increase suggestion from the employees on implemented lean and six sigma simultaneously ... 92
Figure 4.23: Status of involve employees on implemented lean and six sigma simultaneously 93 Figure 4.24: Status of reduce turnover rate on implemented lean and six sigma simultaneously ... 93
Figure. 4.25: Reasons of not implementing lean manufacturing and six sigma simultaneously 95 Figure 4.26: Reasons of implementing lean manufacturing and six sigma simultaneously... 96
Figure 4.27: Success level for lean manufacturing and six sigma implementation ... 100
Figure 4.28: Extending lean manufacturing against the success level ... 101
Figure 4.29: Extending lean manufacturing against the success level ... 102
Figure 4.30: Comparison belt systems vs. no belt system across companies performance ... 105
Figure 4.31: Comparison lean manufacturing vs. six sigma across key success factors that statistically significant ... 110
Figure 4.32: Comparison lean vs. six sigma across key success factors that statistically insignificant ... 112
Figure 4.33: Box plot showing the distribution of success level between lean manufacturing vs. six sigma ... 113
Chapter 5
Figure 5.1 Status of lean manufacturing and six sigma practices ... 120Figure 5.2: Comparsion the effectiveness of lean manufacturing six sigma practices for finacail perfroamcne. ... 126
Figure 5.3: Comparsion the effectiveness of lean and six sigma practices for opeartional perfroamcne ... 128
Figure 5.4: Comparsion the effectiveness of lean six sigma practices for innovation perfroamcne. ... 130
Figure 5.5: Comparison Between Levels of 5S implementation and Financial Performance .. 135
Figure 5.6: Comparison between Levels of kaizen implementation and Financial Performance ... 136
Figure 5.7: Comparison between Levels of Stander work implementation and Financial Performance ... 136
Figure 5.8: Comparison between Levels of TPM implementation and Financial Performance ... 137
Figure 5.9: Comparison between Levels of Tak time implementation and Financial Performance ... 138
Figure 5.10: Comparison between Levels of One Piece Flow implementation and Financial Performance ... 138
Figure 5.11: Comparison between Levels of Poka Yoke implementation and Financial Performance ... 139
Figure 5.12: Comparison between Levels of visual control implementation and Financial Performance. ... 140
Figure 5.13: Comparison between Levels of Gemba implementation and Financial
Performance. ... 140 Figure 5.14: Comparison between Levels of VSM implementation and Financial Performance
... 141 Figure 5.15: Comparison between Levels of Kanabn implementation and Financial
Performance ... 141 Figure 5.16: Comparison between Levels of check sheet implementation and Financial
Performance ... 142 Figure 5.17: Comparison between Levels of cause and effect implementation and Financial
Performance ... 142 Figure 5.18: Comparison between Levels of flow chart implementation and Financial
Performance ... 143 Figure 5.19: Comparison between Levels of FEMA implementation and Financial Performance
... 143 Figure 5.20: Comparison Between Levels of DMAIC implementation and Financial
Performance ... 144 Figure 5.21: Comparison Between Levels of SMED implementation and Financial Performance
... 144 Figure 5.22: Comparison Between Levels of regression analysis and Financial Performance 145 Figure 5.23: Comparison Between Levels of PDCA and Financial Performance ... 145 Figure 5.24: Comparison Between Levels of voice of customer and Financial Performance 146 Figure 5.25: Comparison Between Levels of DPMO and Financial Performance ... 146 Figure 5.26: Comparison between Levels of control chart and Financial Performance ... 147 Figure 5.27: Comparison between Levels of cellular layout and Financial Performance ... 147 Figure 5.28: level of practicing lean manufacturing and six sigma among three categories ... 150
Chapter 6
Figure 6.1: Hierarchical structure decision... 159 Figure 6.2: Performance Outcomes for Lean Manufacturing, Six Sigma. ... 166 Figure 6.3: Frequency the response enterprises among three categories for increase profit .... 166 Figure 6.4: Frequency the response enterprises among three category for improve quality. ... 167 Figure 6.5: Frequency the response enterprises among three categories for reduce variation. 167 Figure 6.6: Frequency the response enterprises among three categories for reduce cost. ... 168 Figure 6.7: Frequency the response enterprises among three category for suggestion from the
employees. ... 168 Figure 6.8: Frequency the response enterprises among three categories for involve employees
... 169 Figure 6.9: the response enterprises for three groups status under customer satisfaction ... 169 Figure 6.10: Frequency the response enterprises among three categories for decrease inventory.
... 170 Figure 6.11: Frequency the response enterprises among three categories for Reduce turnover
rate ... 170 Figure 6.12: Frequency the response enterprises among three categories for creates safety
environment ... 171 Figure 6.13: Frequency the response enterprises among three categories for reducing time ... 171 Figure 6.14: Frequency the response enterprises among three categories for improve
productivity ... 172 Figure 6.15: Prioritize the ratings words Excellent, above average, average, below average,
Figure 6.16: Priorities on Financial performance for each category (A, B, C). ... 174
Figure 6.17: Box plot of the overall value for financial performance ... 174
Figure 6.18: Priorities weight on operational performance for each category (A, B, C) ... 176
Figure 6.19: Box plot of the overall data value under operational performance ... 176
Figure 6.20: Priorities weight on innovation performance for each category (A, B, C) ... 177
Figure 6.21: Box plot of the overall value under innovation performance ... 178
Figure 6.22: Hierarchical structure decision... 179
Figure 6.23: Percentage of agreement status on financial performance by industry ... 181
Figure 6.24: Percentage of agreement status on Operational performance by industry ... 182
Figure 6.25: Percentage of agreement status on innovation performance by industry... 183
List of Table
Chapter 2
Table 2.1 Five phases for Six Sigma ... 31
Table 2.2 Sigma level ... 31
Table 2.3 DMAIC Process and Tools ... 32
Table 2.4 Illustrations the benefits and savings from Six Sigma implementation ... 33
Table 2.5 Voice of customer... 42
Table 2.6 Differences between Lean and Six Sigma ... 46
Table 2.7 Lean and Six Sigma needs each other ... 47
Table 2.8 Comparisons between lean and six-sigma methodology... 48
Chapter 3
Table 3.1 Measure companies performance ... 57Table 3.2 Reliability for the impact of lean manufacturing and six sigma ... 59
Table 3.3 Reliability for lean manufacturing and six sigma tools ... 59
Table 3.4 Reliability for Success factors Lean manufacturing and six sigma ... 60
Table 3.5 Test of normality for impact of implementing lean manufacturing and six sigma .... 61
Table 3.6 Test of normality for tools and technique of lean manufacturing and six sigma ... 62
Table 3.7 Test of normality for tools and technique of lean manufacturing and six sigma ... 63
Table 3.8 Age of the organizations ... 65
Table 3.9 Number of employees... 65
Table 3.9.1 Size of companies ... 65
Table 3.10 Type of certification ... 66
Table 3.11 Belts system status ... 66
Table 3.12 Implementation methods ... 67
Table 3.13 Numbers of years have enterprises implemented lean and six sigma methodologies ... 67
Table 3.14 Performance measure for all companies ... 67
Table 3.15 Extending lean and six sigma method ... 68
Table 3.16 Status level of lean manufacturing and six-sigma tools ... 69
Chapter 4
Table 4.1 Correlation among financial, operational, and innovation performance ... 72Table 4.2 The effect of lean manufacturing and six sigma implementation on increase profit . 73 Table 4.3 The effect of lean manufacturing and six sigma implementation on reduce cost ... 74
Table 4.4 The effect of Lean manufacturing and six sigma implementation on improve quality ... 75
Table 4.5 The effect of Lean manufacturing and six sigma implementation on reduce variation ... 75
Table 4.6 The effect of Lean manufacturing and six sigma implementation on improves productivity ... 76
Table 4.8 The effect of lean manufacturing and six sigma implementation on customer
satisfaction ... 78
Table 4.9 the effect of Lean manufacturing and six sigma implementation on decreases inventory ... 79
Table 4.10 the effect of Lean manufacturing and six sigma implementation on safety environment ... 80
Table 4.11 The effect of Lean manufacturing and six sigma implementation on increases suggestions ... 81
Table 4.12 the effect of Lean manufacturing and six sigma implementation on involve employees ... 82
Table 4.13 the effect of Lean manufacturing and six sigma implementation on reduce turnover rate ... 82
Table 4.14 Mean on performance outcome across period of time ... 84
Table 4.15 The status on implemented the methodologies of lean manufacturing and six sigma simultaneously ... 85
Table 4.16 Statement that SME should follow for implementing lean and six sigma ... 94
Table 4.17 Status of lean and Six Sigma and their recommended to begin implemented in case SME ... 94
Table 4.18 Citification vs. Lean manufacturing and six sigma ... 97
Table 4.19 Comparable between the extending level for lean and six sigma ... 98
Table 4.20 Comparable impact in performance of extending the level of lean and six sigma... 99
Table 4.21 Success degree of implementation lean Manufacturing, six sigma ... 100
Table 4.21.1 Estimate the level of success of each method ... 100
Table 4.22 Extending lean manufacturing against the success level ... 101
Table 4.23 Extending six sigma against the success level ... 102
Table 4.24 Extend of lean manufacturing ... 102
Table 4.25 Extend of six sigma ... 103
Table 4.26 Level of lean manufacturing success ... 103
Table 4.27 Level of six-sigma success ... 104
Table 4.28 The results of a comparison between companies that used belt systems & not used belt systems ... 104
Table 4.29 A comparable ranking the success factors of implementing Lean manufacturing and Six Sigma ... 109
Table 4.30 Wilcoxon signed ranks test for comparison the key success factors of implementing Lean vs. Six Sigma ... 110
Table 4.31 Success factors of implementing lean manufacturing ... 113
Table 4.32 Success factors of implementing six sigma ... 114
Table 4.33 Status integration of lean and Six Sigma and their recommended to begin implemented in case SME ... 115
Chapter 5
Table 5.1 Lean manufacturing and six sigma tools ... 120Table 5.2 Comparison impact performance across implemented and not implemented lean and six sigma tools ... 121
Table 5.3 Comparison impact performance across implemented and not implemented lean and six sigma tools ... 122
Table 5.4 Comparison impact performance across implemented and not implemented lean and six sigma tools ... 123
Table 5.5 Comparison impact performance across implemented and not implemented lean and
six sigma tools ... 124
Table 5.6 Comparison impact performance across implemented and not implemented lean and six sigma tools ... 125
Table 5.7 Statuses of SME and Large against Lean Manufacturing and Six Sigma ... 132
Table 5.8 Present the status of how do enterprises implemented lean and six-sigma tools ... 133
Table 5.9 Relationship between the level of lean and six sigma implementation and companies performance. ... 134
Table 5.10 Range lean manufacturing and six sgima among three groups . ... 148
Table 5.11 Degree level of lean six sigma implementation between SME and large companies ... 151
Chapter 6
Table 6.1 The results of Cronbach’s alpha ... 158Table 6.2 The AHP pairwise comparison scale ... 160
Table 6.3 Priority weights for criteria ... 161
Table 6.4 Random consistency index (RI) ... 161
Table 6.5 Overall priority weights for criteria ... 162
Table 6.6 Priority weights for criteria & subcriteria for evaluator 1 ... 162
Table 6.7 Priority weights for criteria & subcriteria for evaluator 2 ... 163
Table 6.8 Priority weights for criteria & subcriteria for evaluator 3 ... 163
Table 6.9 Priority weights for criteria & subcriteria scale for evaluator 4 ... 164
Table 6.10 Overall weights of criteria & subcriteria ... 164
Table 6.11 Comparing companies performances amongs three groups ... 165
Table 6.12 Altrtnatives with repect to each category A, B, C ... 173
Table 6.13 The weight of the alternative for financial performance ... 174
Table 6.14 The weight of the alternative for operational performance ... 175
Table 6.15 The weight of the alternative for innovation performance ... 177
Table 6.16 Alternatives with respect to Industries ... 179
Table 6.17 The weight of the alternative for financial performance based on industry ... 180
Table 6.18 The weight of the alternative for operational performance based on industry ... 182
Table 6.19 The weight of the alternative for innovation performance based on industry ... 183
Abbreviation
PDCA Plan-Do-Check-Act
TPS Toyota Production System VSM Value Stream Map
FEMA Failure Mode Effects Analysis TQM Total Quality Management
DMAIC Define Measure analysis Improve Control DPMO Defect Per Million Opportunities
VOC Voice of Customer
SMED Single Minute Exchange of Die TPM Total Productivity Maintenance CTQ Critical to Quality
Poka-yoke Mistake Proofing & Prevention MBB Master Black Belt
BB Black Belt
GB Green Belt
YB Yellow Belt
AHP Analytical Hierarchy Process CR Consistency Ratio
RI Random consistency index STD Stander deviation
The work of this thesis is resulted in the following:
Two Journal Articles:
Alhuraish, I. Robledo, C. and Kobi, A. (2016). The Key Success Factors for Lean Manufacturing versus Six Sigm. Research Journal of Applied Sciences, Engineering and Technology, 12(2): p. 169-182.
Alhuraish, I. Robledo, C. Kobi, A. and Azzabi, L (2016). Estimate of Companies Performance in the Implementation of Lean Manufacturing and Six Sigma with Analytic Hierarchy Process. International Journal of Six Sigma and Competitive Advantage (Accepted for publication).
Six International Conference:
Alhuraish, I. Robledo, C. and Kobi, A. Assessment of Lean Manufacturing and Six Sigma operation with Decision Making Based on the Analytic Hierarchy Process. IFAC conference on Manufacturing Modelling Management & Control. 28 – 30 June 2016, Troyes-France. Alhuraish, I. Robledo, C. and Kobi, A. Impacts of lean manufacturing and six sigma. In 9th ISSAT International Conference on Reliability and Quality in Design-RQD. 4 - 6 August 2016, Los Angles-United State.
Alhuraish, I. Robledo, C. and Kobi, A. The effective of lean manufacturing and six sigma implementation. IEEE Conference in Industrial Engineering and Systems Management (IESM) International, 21 – 23 October 2015, Seville-Spain, p. 453-460.
Alhuraish, I. Robledo, C. and Kobi, A. Evaluation the operational performance of implementing lean manufacturing and six sigma. International conference on industrial Engineering, 26 - 28 October 2015, Quebéc-Canada.
Alhuraish, I. Robledo, C. and Kobi, A. Key Success Factors of Implementing Lean Manufacturing and Six Sigma. 17th Toulon-Verona Conference Excellence in Services, 28 – 29 August 2014, Liverpool-United Kingdom, p. 1-16.
Alhuraish, I. Robledo, C. and Kobi, A. Lean and six sigma: a comparative study. International Conference in Quality and Dependability, 17 – 19 September 2014, Sinaia, Romania, p. 6 -10.
Résumé
Dans un marché international, de plus en plus globalisé et caractérisé par une concurrence féroce, les entreprises cherchent à améliorer l'efficacité de leurs processus et ainsi niveler les performances opérationnelles et financières. Pour atteindre ces objectives, les entreprises font appel à des méthodes de management comme le Lean Manufacturing et Six Sigma afin de parvenir à une amélioration continue des indicateurs opérationnels, financiers et d'innovation. De nos jours, le Lean Manufacturing et Six Sigma sont devenus des méthodologies indispensables pour soutenir l'amélioration de la performance avec des résultats palpables et fo ts. Cette th se po te su l’ valuatio de la ise e œuv e de Lea Ma ufa tu i g et Si Sig a au sein des entreprises françaises. Les questions auxquelles nous avons essayé de répondre sont donc :
Est-ce que les entreprises françaises bénéficient-elles des résultats de performance lors de la ise e œuv e de Lea Ma ufa tu i g et Si Sig a ?
Y-a-t-il u e a i e sp ifi ue au e t ep ises f a çaises pou la ise e œuv e de Lea Manufacturing et Six Sigma ?
Quelles sont les améliorations obtenues, au sein des entreprises françaises, via la mise e œuv e de Lea Ma ufa tu i g et Six Sigma (la qualité, la réduction des coûts et la productivité) ?
L'objectif de ce mémoire est d'évaluer les résultats de performance pour les entreprises françaises via l’i pl e tatio des thodologies Lea Ma ufa tu i g et Si Sig a. E out e, nous avons tenté de distinguer les outils qui ont permis aux entreprises étudiées une implémentation réussie de Lean Manufacturing et Six Sigma. Nous avons également visé à ide tifie les fa teu s l s de su s de leu ise e œuv e. L’ tude vise aussi à identifier s'il existe des différences et des similitudes importantes entre les facteurs de succès de Lean Manufacturing et Six Sigma. En conséquence, une comparaison des facteurs clés de succès de Lean Manufacturing et Six Sigma a été réalisée. La littérature scientifique et les pratiques dans e do ai e v le t ue la ise e œuv e « réussie » le Lean Manufacturing et Six Sigma aboutit à des meilleurs résultats en termes de performance globale des entreprises. En outre, ous avo s e a i les a a t isti ues des e t ep ises a a t is e œuv e le Lea Manufacturing et Six Sigma simultanément ou séparément, en prenant en compte les entreprises qui ont adapté des normes telles que ISO 9001 et ISO 14001.
Une analyse AHP « Analytic Hierarchy Process » a été également réalisée pour évaluer la pe fo a e de t ois at go ies d’e t ep ises (So i t s A = ise e œuv e de Lean Ma ufa tu i g et Si Sig a, B = e t ep ises etta t e œuv e la production Lean, C = les entreprises utilisant des outils limités de qualité) en termes des méthodes les plus efficientes qui ont été appliquées. Cette évaluation a été basée sur trois critères : la performance financière, la performance opérationnelle et la performance de l'innovation
Dans cette thèse, nous avons établi une enquête sous forme de questionnaire qui a été distribué au plus de 100 entreprises en France. De ce fait, nos résultats sont basés sur les données collectées des 33 entreprises qui ont répondu.
De manière globale, les résultats montrent que les entreprises appliquant Lean Manufacturing et Six Sigma sont plus efficaces en termes de l'amélioration des performances financières et opérationnelles. Par ailleurs, les entreprises qui utilisent juste une partie des pratiques de Lean Manufacturing et/ou de Six Sigma ont montré des améliorations limitées. En ce qui concerne le volet i ovatio , ous avo s o t ue l’i pl e tatio de Lea Manufacturing est suffisante pour avoir une amélioration des performances. Cette étude a aussi révélé que le Lean Manufacturing et/ou Six Sigma supportent de manière significative une amélioration de la performance de l'entreprise, et montré que de o euses e t ep ises da s l’i dust ie française ont récemme t is e œuv e le Lean Manufacturing et/ou Si Sig a. L’e u te montre que la plupart des industries françaises appliquent des outils comme le Brainstorming, le t avail sta da dis , le o t ôle visuel, le PDCA, et 5S, d’u e pa t. D'aut e pa t, peu d'entrep ises o t e o u l'i po ta e des outils statisti ues tels ue les pla s d’e p ie es, DPMO, DMAIC, et l'analyse de régression.
Cette recherche a également révélé qu'il existe des différences significatives entre les petites-moyennes entreprises et les grandes entreprises en termes d’utilisatio des outils tels que DMAIC, DPMO et One Piece Flow. En ce qui concerne les facteurs du succès pour le Lean Manufacturing et Six Sigma, nous avons mis en lumière des différences statistiquement significatives dans le iveau d'i po ta e d’adaptatio de e tai s fa teu s da s la ise e œuv e de Lea Ma ufa tu i g ou Si Sig a, pa e e ple les fa teu s « changement de la culture », « la communication » et « la participation des employés ». En outre, le résultat indique que les certifications, telles que ISO 9001 o t au u e i flue e su la ise e œuv e de Lean Manufacturing et Six Sigma en même temps. Ce tai s se teu s d’i dust ies o e l'automobile, les services, et l'électronique ont montré une efficacité excellente en matière d'i ovatio , d'e ploitatio et fi a i e. De plus, ette tude o t e l’a se e de Lea Manufacturing et/ou Six Sigma dans le secteur de la santé en France.
Au travers cette thèse, nous avons montré pour la première fois que les entreprises françaises bénéficient, comme ses semblables internationales (ex. japonaises, Etats Unis), de la mise en œuv e des thodes de Lea Ma ufa tu i g et Si Sig a afi d’aug e te le e de e t financier, la performance opérationnelle et la performance de l'innovation. Ce travail réaffirme l’i po ta e de es thodes e o e u e fois o e il a t d o t da s d’aut es pa s.
CHAPTER 1.
1. General introduction
In today’s increasingly globalized market, companies are seeking to improve competitiveness through the use of quality approach to increase efficiency in operational and financial performance. They are no longer satisfied with merely improving operations and finances in general, but also want to achieve continuous improvements in key operational and financial indicators, such as better quality of services and products, waste and cost reduction, improved customer and job satisfaction, and greater innovation. Companies are now considering improvements in quality and efficiency as the most productive route to greater competitiveness (Favaro, 2015). Quality here refers to the management of processes such that both input and output comply with best practice in terms of minimizing waste and cost and putting all resources into productive use, while efficiency refers to reducing costs and waste to achieve optimal production (Favaro, 2015). According to Romaniello et al. (2011), when companies fail to take advantage of methods designed to help improve quality, such as total quality management (TQM), lean, six sigma, agile manufacturing, and the theory of constraints, manufacturing output is poor. The recent developments of highly competitive global markets have put further pressure on companies to meet the demand for high quality in terms of production and of efficiency in customer services. In other words, any company wishing to be competitive and serviceable must implement quality management as a means of satisfying both customer and market demands.
Many companies have succeeded in achieving quality goals at low cost through the use of a number of approaches to improving quality, including total quality management (TQM), lean manufacturing, six sigma, and a number of other methods that evaluate problems and solutions utilizing various quality control philosophies. In order to achieve quality and efficiency to gain a competitive advantage, many companies today use lean and six sigma methodologies (Favaro, 2015). These two particular approaches have proven to be powerful and effective in improving quality, speed, and efficiency through lowering cost and waste while achieving customer satisfaction, and have grown in popularity during recent decades. Lean, six sigma, or the combined approach, lean six sigma, can be applied to any industry, including hospitals, electronics, and automobile manufacture, for example (George, 2002). Lean manufacturing refers to an approach designed to lower the cost and waste involved in production, with a view to maximizing output (Meade et al., 2010). Research has shown that companies that implement and practice lean manufacturing or lean production see significant improvements in operational performance (Shah and Ward, 2003). According to Montgomery and Woodall (2008), six sigma is a statistical technique that allows a scientific evaluation of processes and transactions, with the aims of reducing variability and of removing defects in operation. Lean originated from the Toyota Production System, with a focus on the elimination of waste in production, starting from the time an order is placed and ending when the order is delivered (Pojasek, 2003). Six sigma was introduced by the Motorola Corporation and is designed to eliminate variations in production and services and the processes involved so that defects are reduced and customer satisfaction is improved (Andersson et al., 2006 and Desai, 2006). Many industries have been motivated to implement both lean manufacturing and six sigma because of the great success of these approaches in improving performance by reducing costs, improving productivity, and
reducing the cycle time of an organization. However, their successful implementation depends on a company’s ability to identify opportunities for reducing costs and waste (Guarraia et al., 2008). A review of the literature reveals that the successful implementation of lean six sigma yields greater improvements in performance outcomes than lean manufacturing or six sigma alone. Lean manufacturing, which focuses on reducing waste, is not on its own sufficient to increase a company’s performance in terms of increased profit and reduced cost. Where six sigma focuses on reducing defects. However, a combination of the two methods should allow an organization to benefit from significant improvements in a short period of time at a significantly reduced cost (Mousa, 2013, George, 2002). It therefore follows that, for optimal results, organizations could consider integrating lean manufacturing and six sigma methodologies to achieve waste reduction, improvements in value, and greater customer satisfaction. The work described in this thesis focuses on both lean manufacturing and six sigma, with the aim of demonstrating their compatibility, as well as their differences, in the context of achieving continuous improvement in French industries.
This first, introductory chapter contains the research problem, the research investigation and the research objective. The second chapter provides a review of the literature on lean manufacturing and six sigma, including their history and definition, as well as the tools and key success factors involved. The third chapter describes the research methodology applied in this investigation: the research design, the sampling technique, and the tests of reliability and normality. It also discusses the implications for practical implementation and analysis of the results obtained. The fourth chapter discusses how lean manufacturing and/or six sigma can be applied in practice, including their combined implementation, as well as the key success factors involved and the variables that help to increase company performance. The fifth chapter presents and discusses the results obtained with lean manufacturing and/or six sigma tools in practice. The sixth chapter describes the integration of the analytic hierarchy process (AHP) model with lean manufacturing and/or six sigma implementation, together with the results of a statistical investigation of different categories aimed at determining effective methodologies for increasing companies’ performance outcomes. Finally, concluding remarks are given, with a summary of the research findings as well as prospects for future research.
1.1. Research problem
Many companies today seek to improve quality management as a route to better competitiveness in a globalized market where consumer demands are changing more rapidly and are more complex than ever before. Literature review has shown that in order to improve quality management, several quality methodologies are available, including lean manufacturing, and six sigma, among others. Therefore a number of problems arise for consideration in this context: Do French companies benefit in terms of performance outcomes when they implement lean manufacturing and six sigma? Is there a specific way in which French companies have implemented lean manufacturing and six sigma that accounts for their performance outcomes? Thus, do French companies implementing and extending the practice of lean and six sigma achieve improvements in quality, reduced cost, and productivity as reported in the literature? Additionally, there has been
a lack of consideration in the literature of differences in key success factors for lean manufacturing compared with six sigma. Therefore, the question arises as to the nature of the factors that are relevant for companies in achieving successful implementation of lean manufacturing and six sigma.
1.2. Research Investigation and Question
This study examines the implementation of lean manufacturing and six sigma, alone and in combination, and estimates the impact of such implementation on French industries with regard to performance outcomes. It also identifies the current status of lean manufacturing and six sigma in these industries, considering, for example, the range of implementation of these techniques. The aim is to identify the potential benefits and the relationship between performance outcomes and the extent to which lean manufacturing and six sigma are employed. Additionally, a number of important points are illustrated, among which is the controversy regarding whether the two methodologies should be applied simultaneously or separately. In addition, there is the question of comparing companies that have implemented lean manufacturing and six sigma, either simultaneously or separately, with those that are accredited with regard to standards such as ISO 9001 and ISO 14001.
The number of years over which lean manufacturing and/or six sigma have been implemented are considered, and the impact of this factor on financial and operational performance is examined. The tools and practices that are relevant to the implementation of lean manufacturing or six sigma, such as the Kaizen team, Kanban, DPMO, Visual Control, SMED, and 5S, are investigated, with the aim of identifying which are able to increase company performance. This research also seeks to identify the key success factors for implementing lean manufacturing and six sigma within French industry. The aim is to discover whether there are significant differences and similarities among the common success factors for lean manufacturing and six sigma and whether there are differences in priority among these. The respective factors that have turned out to be most critical for those companies that have successfully implemented either lean manufacturing or six sigma are investigated. Finally, the levels of success of implementation of lean manufacturing, six sigma, or both, are investigated. In summary, this research investigates the implementation of lean manufacturing and six sigma within French industry by focusing on the following questions:
What are the impacts of implementing lean manufacturing and six sigma? What are the impacts of implementing lean manufacturing only?
What are the differences in terms of benefits obtained between companies implementing both lean manufacturing and six sigma, those implementing lean manufacturing only, and those that use just a limited range of tools from lean manufacturing and six sigma? How has lean manufacturing extended through French industry?
How has six sigma extended through French industry?
Which tools and practices associated with either lean manufacturing or six sigma support reductions in cost and inventory, improvements in quality, reductions in turnover rate, improvements in profit, etc.?
As demonstrated in Figure 1, the research scenario begins with the objective of the research, namely, to evaluate the performance of these methods within French industry in terms of performance outcome, tool, success factors, etc. An extensive literature review is then conducted, selecting appropriate variables from the literature and examining the views of experts with regard to lean manufacturing and six sigma implementation. Next, appropriate research methodologies are applied to obtain empirical data, through visiting various enterprises and through the use of questionnaires. Then, results are subjected to statistical analysis such as the multicriteria decision-making method and a nonparametric test. Finally, the overall results obtained from this research are discussed in comparison with those from the literature review.
CHAPTER 2.
2. Literature Review
2.1.
Introduction
The literature review showed that several industries have achieved significantly increased incomes by implementing lean manufacturing and six sigma. The companies in France that have done so include Alstom, 3M, Essilor, Technip and Safran, Oréal, and STMicroelectronics (USINE NOUVELLE). To deploy lean manufacturing or six sigma successfully, there are various requirements, such as the use of appropriate tools and techniques and consideration of a number of key factors. Therefore, this chapter discusses the history and principles of lean manufacturing and six sigma, as well as tools, techniques, and success factors.
2.2. History of Lean Manufacturing
The origin of the lean manufacturing approach is attributed to the Toyota Motor Company (Womack, 1990). At the end of the Second World War, Japanese manufacturers faced challenges of shortages of both materials and financial and human resources (Khalil and Abu Shaaban, 2013). Toyota developed lean manufacturing with the aim of addressing their specific needs in a market that was restricted during economically troubled times. Through the use of a set of integrated practices and tools such as interchangeable parts, standard work methods, and assembly flow lines, Toyota was able to manufacture products at high speed (Manotas Duque and Rivera Cadavid, 2007). They adopted a lean production system during the 1940s to improve efficiency and gain a competitive advantage in the motor industry, which was characterized by stiff competition. They were also able to provide more value to customers. Toyota adopted lean manufacturing so that it could avoid the need to push products to its clients. Instead, the company allowed its customers to pull the products (Dora et al., 2013). Thus, customers could provide specific details about the type of cars they wanted and when they wanted them. Toyota then sourced raw materials and applied processes to ensure that cars fitting the customer specifications were manufactured and delivered in a timely manner. The roots of lean manufacturing can also be traced back to Henry Ford’s invention in 1913 of a production system for the Highland Park automobile plant, which was integrated in such a way as to facilitate the rapid manufacture of products (Manotas Duque and Rivera Cadavid, 2007). According to Mostafa et al., (2013), lean manufacturing can be considered as an important socio-technical mechanism, encompassing a number of management tools. Krafcik initially introduced the concept of lean in 1988; however, it was Womack, Jones, and Roos, with their incorporation of lean manufacturing in the Toyota Production System (TPS) in 1991, who explicitly implemented the principle of lean manufacturing in a practical context (Womack, 1990).
2.3. Lean Manufacturing
Lean manufacturing operates on a philosophy that production is maximized through the elimination or reduction of waste and cost in production. Lean manufacturing was introduced
with the aim of eliminating all the non-valued activities encountered by an organization, with lower resources and work force, in order to generate higher returns and value for the organization (Womack et al., 1990). Besides providing services, lean manufacturing enables an organization to diminish wastes associated with production of products and services, in order to manage the value chain associated with production, which consequently reduces the overall costs. Lean Manufacturing enables the organization to reduce a number of wastes, such as waiting time, quality defects, production wastes, excessive stock and wastes in the existing process (Wilson, 2010 and Womack et al., 1990). The goal of lean management is to eliminate waste. Thus the overarching philosophy of lean manufacturing is “more value with less work” because it involves producing goods and services by operating less of everything (Anvari, et al., 2011).
2.3.1. Waste
Many organizations have sought to remain competitive in the global market by adopting lean manufacturing, which reduces costs by eliminating non value added activities (Rahani and al-Ashraf, 2012). In lean manufacturing, the main aim is to reduce the costs that an organization incurs in the process of manufacturing by ensuring that the company eliminates waste. However, several types of waste throughout a company ought to be continuously eliminated. Below, the seven types of waste attack by the lean manufacturing method are listed, as identified by Toyota: Over-Production, Waiting Time, Over Processing, Transportation, Inventory, Motion and Defects (Dailey, 2003).
Over-Production means that the quantity of material produced is greater or faster than required. Material should be produced based on customer demand.
Waiting Time is the idle time that happens during the process, such as operators stood waiting to receive his or her order in the assembly line or waiting for responses from other departments etc.
Over Processing is a surplus of work that doesn’t add value to a product or service. Transportation waste is any of the material movement that does not add value to or
support immediate production.
Inventory waste is any material or work in progress or finished material that exists in the factory which is not being processed, such as waiting to deliver parts or products that have already been prepared for transport.
Motion waste is any effort or movement of people that does not contribute to added value to the product or service.
Defect waste represents the efforts needed to repair or inspect the defective items or service that led to the rework.
Through lean manufacturing, attempts to exclude the seven categories of waste are made, in a bid to minimize costs. This involves all organizational aspects including over-production, motion, transportation, waiting, inventory surplus, and defects and over-processing. All-round value takes preference in lean manufacturing. The main objective is to reduce costs, improve quality, and achieve appropriate delivery times by total elimination of waste (Wilson, 2010,
Womack et al., 1990). Efficiency and attention to detail are very important towards the achievement of productivity in such industries, and improvements in system efficiency can lead to elimination of significant waste in terms of material usage, time and labor. Lean manufacturing is a philosophical approach to managing production and consists of facilitating a system for eliminating or reducing waste and any activity that does not add value for the end customer (Dora et al., 2013). At its core, lean manufacturing is a continuous improvement technique focused on just-in-time (JIT), quality systems and team works (Wong et al., 2009). The lean philosophy is based on the concept that a resource committed to any faction that is not of value to the customer is a wasted resource. Therefore, the goal of lean manufacturing is to eliminate waste. The core schemes or principles of the lean system are presented next.
2.3.2. Lean principle
There are five steps involved in the implementation of the lean principle (See Figure 2.1) and they are summarized as follows (Taghizadegan, 2006).
1. Value, which describes customer value from the perspective of the customer.
2. Value Stream Map, which includes identifying all products or service activities and the resources used for producing them.
3. Flow, which involves creating a system in which value is added on a continuous basis, and anything that does not add value or merely creates obstacles to value is removed.
4. Pull system, which involves input that is consistent only with customer demand and expectations.
5. Perfection, which involves persistently refining processes for improving efficient operations, reducing production times, improving quality and reducing costs.
According to Åhlstrom (1998), lean manufacturing is about elimination of waste, ensuring that there are no defects, scheduling processes as per customer requirements, having excellent team leaders, continuous improvement, multifunctional teams and flexible information systems. In lean manufacturing, value is determined by the customer, and the process involves continuous identification and removal of waste in the manufacturing process (Erfan, 2010). Employees should be included in the program as well because they are the ones responsible for performing tasks (Marin-Garcia and Bonavia, 2011). Employees perform maintenance tasks of the lean manufacturing program. Success of lean manufacturing implementation is influenced by numerous factors and approaches. However, the most critical factors that contribute to success are leadership and management skills, employee skills and expertise, financial factors and an organizational culture that is supportive (Achanga et al., 2006). In lean manufacturing, the main aim is to reduce the costs that an organization incurs in the process of manufacturing by ensuring that the company manufactures the right quantity of products and delivers them to clients in time. Consequently, warehouse requirements, labor, and time are reduced (Goriwondo and Maunga, 2012). Generally, a company should be able to specify customer wants and timelines and all the processes and activities that are required to bring the product to the customer. The essential steps in lean are identification of features that create value including identification of a value stream
Together with other pioneering scientists and engineers, Smith sought to develop the six sigma concept in order to reduce variation, maximize productivity, and improve quality (Taghizadegan, 2006 and Brun, 2011). Six sigma helped Motorola realize powerful bottom-line results in their organization. They documented more than $16 billion in savings as the result of six sigma efforts. Since then, hundreds of companies around the world have adopted six sigma as a way of doing business. Owing to its numerous advantages, many successful organizations around the globe have implemented six sigma in order to facilitate corporate management, reduce the costs associated with their products, enhance customer loyalty, augment sales, and boost their competency at an organizational level (Chen, 2008). Six sigma can be considered a high-performance approach, enabling an organization to analyze the core reasons behind problems that arise and the ways in which such problems can be eliminated in organizational scenarios.
2.5. Six Sigma method
The six sigma method is related to 3.4 defects per million opportunities (DPMO) approach, with the intention of identifying and eliminating defects, so that an organization can significantly improve its quality of production (Bryefogle, 1999). Six sigma is applied in an organization as a means of solving quality problems and designing new and improved processes. The philosophical premise of six sigma is the reduction of variations in the production process (Nave, 2002). Six sigma looks to do this through continuous statistical evaluation and the removal of such variations (Bryefogle, 1999). Furthermore, six sigma can be regarded as a business mechanism that enables organizations to develop their bottom lines through evaluation of business tasks and thereby to facilitate reductions in waste as well as an enhanced level of customer satisfaction (Hekmatpanah et al., 2008). The focus of six sigma is on problem-solving, on the basis that problems cannot be solved unless they are fully understood. Therefore, six sigma is project-driven and operates on a statistical basis centered around a five-phase approach to reducing variations and thereby solving business and operational problems: define, measure, analyze, implement, and control (DMAIC) (Bryefogle, 1999 and Kwak and Anbari, 2006).
2.5.1. DMAIC
The framework steps for implementing six sigma are Define, Measure, Analysis, Improve and Control and are provided in the below Table 2.1 (McClusky, 2000). DMAIC is the most commonly used framework for problem identification and resolution in six sigma. DMAIC structures a continuous process for improvement via directing a sharp focus on the detection, analysis and resolution of root causes of process failure (Breyfogle, 1999). Six sigma can be defined as a statistical measure of the performance of a process, as an aim that reaches near perfection for performance improvements to achieve world-class performance (Pande et al., 2000). In general six sigma is a methodical and philosophical approach to problems for improving the quality of production through statistically defining and analyzing problems as a means of discovering defects per unit and the probability of a failure for implementing solutions and controls on a continuous level (Desai, 2006). It is thought that by taking this approach, six sigma that produces zero defects and the risk of defects occurring once the control phase of the DMAIC is implemented (Goriwondo and Maunga, 2012).
Table 2.1 Five phases for Six Sigma
Six sigma step Key Process
Define Define the requirement and expectations of the customer Define the project boundaries Define the process by mapping the business flow
Measure Measure the process to satisfy customer’s need Develop a data collection plan Collect and compare data to determine issue and shortfalls
Analyze Analyze the causes of defects and sources of variation Determine the variation in the process Prioritize opportunities for future improvement
Improve Develop creative alternatives and implement enhance plan Improve the process to eliminate variation
Control Develop strategy to monitor and control the improved process Control process variation to meet customer requirement Implement the improvement of systems and structures
Six-sigma methodologies are applied in an organization as processes of solving quality problems and designing new and improved processes. As a statistical measure, it defines how much variation exists in a set of data, a group of items and looks at how well you are meeting customer requirements. The sigma measure was settled to aid focus measures on the paying customers of a business, and provides a consistent way to measure and compare different processes (Pande et al., 2000). Six sigma implies 3.4 defects per million opportunities (see Table 2.2). The six sigma methodology deals with the intention that identifying and responding to 3.4 defects, the organization can significantly improve quality of production (Klefsjo et al., 2001). Six sigma requires the use of several statistical tools that focuses on the reduction of variation. These statistical tools measure each of the stages of the process evaluation, design and re-design (Zare Mehrjerdi, 2011).
Table 2.2 Sigma level
Sigma Level Defect per Million Opportunity (DPMO)
6 3.4 5 233 4 6.210 3 66.807 2 308.537 1 690.000
The objective of applying six sigma is to solve identification problems or reduce variation by implementing the DMAIC framework. The processes involved in DMAIC include several tools and techniques. Pyzdek and Keller (2003) reviewed the tools and techniques shown in Table 2.3, which require integration with each phase of the DMAIC framework.
Table 2.3 DMAIC Process and Tools
Six sigma
phase Key process Tools and technique
Define
Define the goals of the improvement activity, and incorporate into a Project Charter. Obtain sponsorship and
assemble team
Project Charter, collecting Voice of customer such as surveys, focus group Process
Map, Quality Function deployment, Supplier Input
Process Output Customer, Benchmarking, Project planning and management
tools, Pareto Analysis. Measure
Measure the existing system. Establish valid and reliable metrics to help monitor progress toward the goal(s) defined
at the previous step. Establish current process baseline performance using metric
Exploratory data analysis, Descriptive statistics, Run
chart, Pareto analysis
Analyze
Analyze the system to identify ways to eliminate the gap between the current performance of the system or process and the desired goal. Use exploratory and descriptive data analysis to help you understand the data. Use statistical
Tools to guide the analysis
Cause-effect diagrams, Tree diagram, Brainstorming, Process behavior charts, Process maps, Design of Experiments, Enumerative statistics, Inferential Statistic,
Simulation
Improve
Improve the system. Be creative in finding new ways to do things better, cheaper, or faster. Use Project Management and other planning and management tools to implement the
new approach. Use statistical methods to validate the improvement
Force field diagrams, FMEA, 7M tools, Project planning and
management tools, Prototype and pilot studies, Simulations
Control
Control the new system. Institutionalize the improved system by modifying compensation and incentive systems,
policies, and procedures, MRP, budgets, operating instructions and other management systems. You may wish
to utilize standardization such as ISO 9000 to ensure that documentation is correct. Use statistical tools to monitor
stability of the new systems
SPC, FMEA, ISO 900x Change budgets, bid models,
cost estimating models, Reporting system Source: Pyzdek and Keller, 2003
2.5.2. Benefits of Six Sigma
According to Pande et al. (2000), six sigma has a number of beneficial effects, such as enhanced success, increased company performance, and enhanced value to customers. Table 2.4 presents a summary of the general benefits to companies of implementing six sigma.
Table 2.4 Illustrations the benefits and savings from Six Sigma implementation
Company/project Metric/measures Benefit/savings Motorola (1992) In-process defect levels 150 times reduction Raytheon/aircraft integration
systems Depot maintenance inspection time Reduced 88% as measured in days GE/Railcar leasing business Turnaround time at repair shops 62% reduction
Allied Signal (Honeywell)/
laminates. plant in South Carolina Capacity Cycle time Inventory On-time delivery Up 30% Down 50% Down 50% Increased to near 100% Allied Signal (Honeywell) bendix
IQ brake pads
Concept-to-shipment cycle time Reduced from 8 months to 8 months
Hughes aircraft's missiles systems
group/wave Quality/productivity Improved 1.000%/improved 500% General electric Financial $2 billion in 1999
Motorola (1999) Financial $15 billion over 11 years Dow chemical/rail delivery project Financial Savings of $2.45 million in capital
expenditures DuPont/Yerkces plant in New
York (2000) Financial Savings of more than $25 million Telefonica de espana (2001) Financial Savings and increases in revenue
30 million euro in the first 10 months
Texas instruments Financial $600 million Johnson and Johnson Financial $ 500 million
Honey well Financial $1.2 billion
Source: Kwak and Anbari, 2006
2.6. Lean Manufacturing and Six Sigma Tools
This section discusses some of the popular tools and techniques applied in quality improvement methodologies such as those used in six sigma and lean manufacturing. Those widely used in lean manufacturing include such as Kaizen, Kanban, Brainstorming, Value stream Map (VSM), 5S, Total productivity Maintenance (TPM), Kaizen team, Work cell optimization, Mistake proofing & prevention (Poka-yoke), Gemb, PDCA, Standardized Work, Takt time, Visual Control, Once Piece Flow, Single Minute Exchange of Die (SMED). Whereas six sigma more commonly uses statistical tools such as Voice of customer (VOC), Cause and Effect Diagram, Check Sheet, Design of Experiment (DOE), Defect Per Million Opportunities (DPMO), Failure Mode and effects analysis (FMEA), Pareto Diagram, Process Flow Chart, DPMO, Control Chart.
2.6.1. Brainstorming
Brainstorming is a team concept and is applied for improving a team’s ability to be creative and efficient. This is because brainstorming facilitates liberal thinking and an unrestrained exchange of ideas. While there are several brainstorming techniques, the most popular ones are round robin (Structured) and free Wheeling (unstructured) (Basu, 2004). These two techniques are presented as follows:
Round Robin: This is a structured brainstorming process, and as such participants in a team are invited to share their individual ideas.
Free Wheeling: This is an unstructured brainstorming process in which all team members are at liberty to produce and express ideas whenever they see fit.
Brainstorming is an appropriate tool when quantitative or logistic solutions to a problem are available. The brainstorming tool is designed to stimulate an interaction of ideas that function to produce an effective combined solution (Geoge et al., 2005). One of the unique benefits of Brainstorming is its ability to facilitate whole group engagement and participation and therefore avoids a team environment where exclusion of some members occurs and others are the focal point (Basu, 2004).
2.6.2. Cause and Effect Diagram
The cause and effect diagram graphically depicts possible causes attributed to specific effects. Initially introduced by Ishikawa, this graphic depiction was frequently expressed in terms of the Ishikawa Diagram. More recently, the cause and effect diagram is more popularly referred to as a fishbone diagram (Basu, 2004). The cause and effect diagram goal is to aid in brainstorming through helping a team document and follow identified and graphically displayed ideas reflecting the root causes of a problem (George et al., 2005). The cause and affect diagram can be described as among the most popular quality improvement tools. The effect depicts a particular problem and is presented as the diagram (see Figure 2.2). The main structure of the cause and effect diagram contains six elements that are self-explanatory and are otherwise known as 6Ms. The 6Ms are Manpower, Material, Machine, Method, Measurement, and Environment (Basu, 2004). There are certain steps in the Cause and Effect process. These steps are described as follows (George, 2005):
Choosing the appropriate format that allows for the identification and analysis of cause and effect.
Clearly defining and documenting the primary effects arising out of the problem. A box situation at the right side of the diagram will frequently contain this.
Once the primary classification of causes are agreed upon, the main fishbone branches are drawn and create basic diagram on flipchart
Brainstorming occurs in the categorization of causes where sub-causes stemming from categorized causes are identified.
At this point where the sub-causes have been identified, a list compiling the sub-causes are placed on a flipchart.
After the team agrees on the top sub-causes and the top six sub-causes, the subcases are ranked in a way that corresponds with their level of importance.
Review the diagram
For each category of causes, the top sub-causes are listed on the diagram. The resulting sub-causes are known as the Root Causes.
At this point a decision is made on whether to carry out further dispersion analysis or to collect more data necessary for confirming the Root Causes.
Finally, solutions together with a plan for improvement are developed.
Figure 2.2: Illustration for Ishikawa Diagram (http://www.vertex42.com)
2.6.3. Check Sheet
The check sheet provides an easy and efficient method for documenting and identifying when transactions or activities take place. The check sheet is a form or a sheet that permits teams to document and harvest data that is observed so that patterns can be delineated (see Figure 2.3) (Basu, 2004). The simple check sheet is utilized for documenting data that does not conform and activities such as the below:
I. Machine malfunctions,
II. Activities that do not add value
III. Defects or errors observed in a process or a problem.
The check sheet form is prepared in anticipation of the subsequent documenting of data by those who are involved in or impacted by the problem or process. By taking this approach, patterns in the data are clearer, factual, and are derived from an easy to uses process that is applicable to virtually all areas of performance (Basu, 2004).
Telephone interruption
Reason Day
Mon Tues Wed Thurs Frid Total
Wrong number llll ll llll llll 11 20 Information request ll ll ll ll ll 10 Boss llll ll llll 11 l lll 19 Total 12 6 10 8 13 49