HAL Id: hal-02403373
https://hal.archives-ouvertes.fr/hal-02403373
Submitted on 14 Dec 2020HAL is a multi-disciplinary open access
archive for the deposit and dissemination of sci-entific research documents, whether they are pub-lished or not. The documents may come from teaching and research institutions in France or abroad, or from public or private research centers.
L’archive ouverte pluridisciplinaire HAL, est destinée au dépôt et à la diffusion de documents scientifiques de niveau recherche, publiés ou non, émanant des établissements d’enseignement et de recherche français ou étrangers, des laboratoires publics ou privés.
Segregation of Sn on migrating interfaces of ferrite
recrystallisation: quantification through APT
measurements and comparison with the solute drag
theory
N. Mavrikakis, W. Saikaly, D. Mangelinck, M. Dumont
To cite this version:
N. Mavrikakis, W. Saikaly, D. Mangelinck, M. Dumont. Segregation of Sn on migrating interfaces of ferrite recrystallisation: quantification through APT measurements and comparison with the solute drag theory. Materialia, Elsevier, 2020, 9, pp.100541. �10.1016/j.mtla.2019.100541�. �hal-02403373�
1 2 3 4 5 6 7 8 9 10 11 12 13 14 15 16 17 18 19 20 21 22 23 24 25 26 27 28 29 30 31 32 33 34 35 36 37 38 39 40 41 42 43 44 45 46 47 48 49 50 51 52 53 54 55 56 57 58 59 60 61
“Segregation of Sn on migrating interfaces of ferrite recrystallisation: quantification through APT measurements and comparison with the solute drag theory”
N. Mavrikakis 1,2 , W. Saikaly 2, D. Mangelinck 1,a), M. Dumont 1
1
Aix Marseille Université, CNRS, IM2NP UMR 7334, 13397, Marseille, France
2
ArcelorMittal Global R&D Gent, Belgium
a)
Author to whom correspondence should be addressed: [email protected]
Solute atoms play an important role in grain boundary migration phenomena, which are critical for understanding the microstructural evolution in metals. Here we investigate the segregation of Sn at migrating boundaries during recrystallisation in a ferritic Fe-Si-Sn alloy using atom probe tomography. Experimental evidence demonstrated a solute depletion zone ahead of the moving interface. The behaviour of Sn was rationalized with the Cahn solute drag theory. A difference in segregation between two investigated migrating interfaces was observed and could be explained by a variation in either binding energy, intrinsic velocity of each interface or in driving force.
Keywords: grain boundary segregation; interface migration; solute drag; atom probe tomography; recrystallisation
1.
Introduction
Solute enrichment at interfaces can impact remarkably grain boundary migration controlled phenomena, such as recrystallisation and phase transformations, by affecting interface mobility 1–4. Elements like P, Se, Sn etc. are prone to segregate on lattice defects in metals 5. In particular, Sn segregation has been observed in various metals 6–9 to strongly influence the material properties 10,11. The majority of experimental data on the segregation of Sn at grain boundaries 7,10,12,13 stem from Auger Spectroscopy (AES). AES is a well-suited technique for studying relatively high levels of grain boundary segregation (GBS). However, in the case of grain boundary migration phenomena that occur at a timescale of a few minutes or faster (at relatively high driving forces) and for limited diffusion
1 2 3 4 5 6 7 8 9 10 11 12 13 14 15 16 17 18 19 20 21 22 23 24 25 26 27 28 29 30 31 32 33 34 35 36 37 38 39 40 41 42 43 44 45 46 47 48 49 50 51 52 53 54 55 56 57 58 59
length, AES may not be the most appropriate method due to its limited detectability. Hence, additional techniques capable in resolving even small interfacial enrichments are needed. Among other chemical characterization techniques available, atom probe tomography (APT) has a near-atomic scale resolution and the unique feature of analysing the chemistry of matter in the three dimensions 14. In the recent years, the practice of APT has been gaining ground in the field of GBS 15, since proper quantification of segregation amount is accessible through the measurement of the Gibbsian excess number 16. At the same time, it offers the possibility of investigating the morphology of nanostructural features, such as interfaces, and gives access to elemental concentration profiles. Despite the scientific interest, no previous references were found on the segregation quantification of Sn solute with APT. Moreover, very few studies have focused on the GBS at the migrating interfaces of recrystallisation. Maruyama et. al 17 used APT to study recrystallisation under the effect of Nb solute in Fe-Nb ultra-low carbon (ULC) steels, whereas more recently Takahashi et. al 18 investigated segregation of Ti and B in interstitial-free (IF) steels. The focus of this work is to explore, the GBS behaviour of Sn solute in Fe alloys and compare it to the solute drag theory. Segregation mechanisms could be truly insightful if elucidated as a function of microstructure and grain boundary structure. Therefore, Sn segregation was analysed and quantified during the progress of static recrystallisation and in combination with grain orientation data, by employing a site-specific methodology for APT analysis.
2.
Materials and experimental
For the proper assessment of the solute effect on recrystallisation, the study was conducted on a lab processed Fe based model alloy with 5.8% Si, 0.045% Sn (at. %), while impurities limited to a total amount of about 150 at. parts per million, realised in ArcelorMittal Global R&D Gent. Si is added to stabilize α-Fe and produce a single-phase alloy to study recrystallisation only under the solute effect. Both Si and Sn concentrations are within the solid solubility values in α-Fe. The materials were processed with cold rolling to a total cold work – Von Mises true strain of about ε = 2 as described elsewhere 19. Materials in the as deformed state, were subjected to a static recrystallisation annealing at 973K in a BAHR dilatometer, to achieve a partially recrystallized microstructure. Temperature was chosen as recrystallisation kinetics are easier to follow, while there is enough time for Sn to segregate
1 2 3 4 5 6 7 8 9 10 11 12 13 14 15 16 17 18 19 20 21 22 23 24 25 26 27 28 29 30 31 32 33 34 35 36 37 38 39 40 41 42 43 44 45 46 47 48 49 50 51 52 53 54 55 56 57 58 59 60 61
at the grain boundaries 20. Following the isothermal step, samples were quenched to room temperature in order to freeze the microstructure and to ensure that no segregation occurs during cooling. Characterization was performed by determining the recrystallisation fractions in the annealed microstructures via quantitative metallography by applying the point count method 21. Subsequently, grain orientations and grain boundaries (GBs) of the polycrystalline microstructure were characterized with the electron backscatter diffraction (EBSD) technique in a JEOL JSM-7001F field-emission gun scanning electron microscope (FEG-SEM). The data were then post-processed in the OIM Analysis™ platform. In the context of this work, recrystallized (RX) grains are defined as newly formed grains bounded by high-angle grain boundaries (HAGBs, θ 15ο) with a total internal grain orientation spread not exceeding 1.8o. Finally, a grain shape criterion is applied, selecting grains with aspect ratios between 0.33 to 1, taking RX grains as near equiaxed in shape.
For the present study, a sample recrystallized at a volume fraction, XV = 0.45, was further
characterized in APT. At this stage, recrystallisation has well progressed whilst the free/un-impinged surface area of recrystallized grains is still relatively large. We focus our study on the behaviour of general GBs at the recrystallisation front, as general GB migration is suggested to be more affected by the presence of solutes than special GBs 22. For APT, specimens were prepared into sharp needles in a FEI Helios NanoLab 600 Dual Beam focused ion beam (FIB) - SEM, following the lift-out technique
23
. The sample preparation performed in the FIB was meticulous to keep the GB of interest as close to the tip apex as possible, by inspection with the secondary electrons. FIB and consequent APT analysis were conducted in a correlative microscopy manner. As the annular milling rate (using the Ga+ beam) depends on the grain characteristics (i.e. orientation, dislocation density etc.), it was possible during FIB preparation to keep track of which grain is the RX and un-RX one, respectively. In the current case, the un-RX grains have a higher dislocation density and were observed to mill at a slower rate, compared to the RX grains. Moreover, they were rather easy to identify as they had a distinct, rougher morphology (more details are given in the Supplementary Information). APT experiments were conducted in voltage mode in a LEAP 3000XHR with a detector efficiency of 0.37, a sample base temperature of 70K and pulse fraction set at 20%. Finally, the APT data were analysed in the IVAS
1 2 3 4 5 6 7 8 9 10 11 12 13 14 15 16 17 18 19 20 21 22 23 24 25 26 27 28 29 30 31 32 33 34 35 36 37 38 39 40 41 42 43 44 45 46 47 48 49 50 51 52 53 54 55 56 57 58 59
software after calibration of the reconstruction parameters from the obtained desorption maps 15. Consequently, the established method of the Gibbsian interfacial excess was followed to quantify the segregation at the interface, that yields a value of concentration insensitive to the measurement’s resolution 16.
3.
Results and discussion
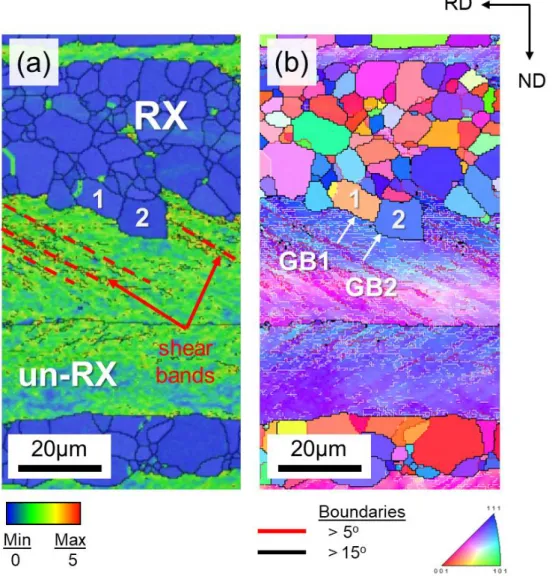
Fig. 1 shows the microstructure within the region of interest of the sample characterized by EBSD. Fig. 1a illustrates the kernel average misorientation (KAM) map where RX from un-RX regions can be clearly distinguished from their misorientation; low misorientation zones (RX) are shown in blue, while high misorientation zones (un-RX) are in green/yellow/red hue. Fig. 1b shows the inverse pole figure (IPF) orientation map along the samples normal direction (ND), white arrows designate the grains and GBs of interest. The crystallographic data of the grains and GBs are listed in Table 1. Note that grain 1 is near the {114}<148> component and grain 2 a few degrees away from the {111}<110> texture component.
1 2 3 4 5 6 7 8 9 10 11 12 13 14 15 16 17 18 19 20 21 22 23 24 25 26 27 28 29 30 31 32 33 34 35 36 37 38 39 40 41 42 43 44 45 46 47 48 49 50 51 52 53 54 55 56 57 58 59 60 61
Figure 1. Partially recrystallized microstructure, a) Kernel Average Misorientation (KAM) map, with
deformation induced shear bands shown in red dashed lines in the un-recrystallized structure and b) ND inverse pole figure (IPF) orientation mapping with the grains and grain boundaries of interest
indicated by white arrows.
The fact that the grains were adjacent to each other is convenient as the deformed matrix (un-RX) in front of the GBs is comparable (i.e. in terms of orientation, local dislocation density etc.). The misorientations of the migrating interfaces are θ = 48.2o about the [4 2] axis of rotation for grain 1 (GB1) and θ = 27.5o [ 32] for grain 2 (GB2). Finally, by examining these two grains on Fig. 1a, their alignment with a shear band of the as deformed matrix may indicate that most likely both grains nucleated at a deformation shear band 24. The chemical analysis of the two interfaces is shown in Fig.
1 2 3 4 5 6 7 8 9 10 11 12 13 14 15 16 17 18 19 20 21 22 23 24 25 26 27 28 29 30 31 32 33 34 35 36 37 38 39 40 41 42 43 44 45 46 47 48 49 50 51 52 53 54 55 56 57 58 59
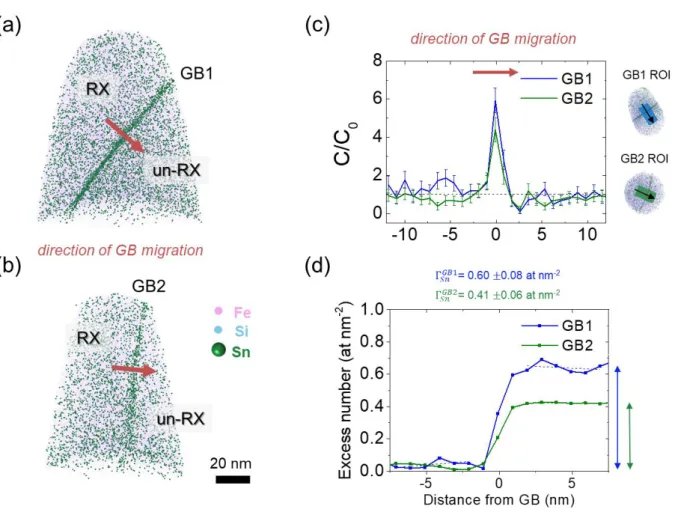
2, with the volumes obtained by APT displayed for GB1 (Fig. 2a) and for GB2 (Fig. 2b). Sn atoms are represented as green spheres and are observed to decorate the GBs, whereas for clarity only a portion of the Fe and Si atoms are represented as pink and sky-blue points, respectively. We note that some Si segregation was also observed at the migrating GBs – further discussion is made in the text (and more details are given in the Supplementary Information). Fig. 2c shows the concentration profiles for Sn solute as measured in the two GBs and the integral profiles obtained from these profiles by the method defined in ref. 25 are shown in Fig. 2d.
Figure 2. APT volumes with the atom distribution for Sn, Fe and Si. Sn segregates at the grain
boundaries of the recrystallization front, red arrows indicate the direction of migration. a) GB1 θ = 48.2o [4 2], b) GB2 θ = 27.5o [ 32], c) concentration profiles perpendicular to the interface for the two
1 2 3 4 5 6 7 8 9 10 11 12 13 14 15 16 17 18 19 20 21 22 23 24 25 26 27 28 29 30 31 32 33 34 35 36 37 38 39 40 41 42 43 44 45 46 47 48 49 50 51 52 53 54 55 56 57 58 59 60 61
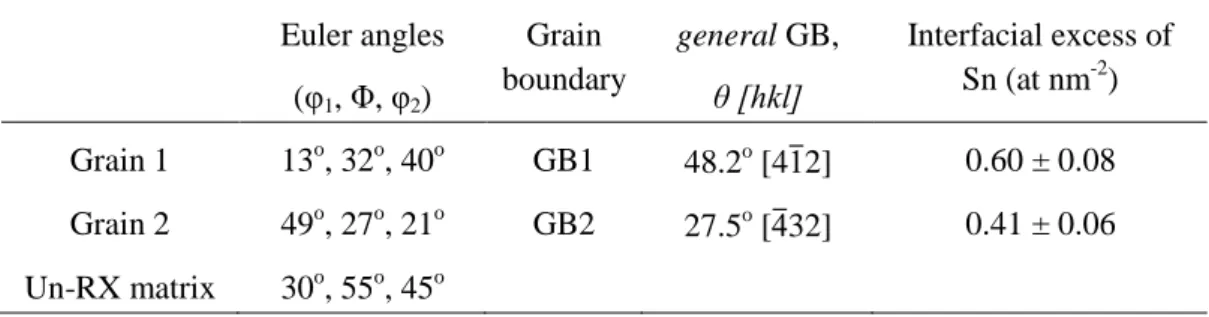
Table 1. Grain boundary crystallographic information as obtained from the EBSD orientation mappings and the values of interfacial segregation for Sn as analysed with APT.
Euler angles (φ1, Φ, φ2) Grain boundary general GB, θ [hkl] Interfacial excess of Sn (at nm-2) Grain 1 13o, 32o, 40o GB1 48.2o [4 2] 0.60 ± 0.08 Grain 2 49o, 27o, 21o GB2 27.5o [ 32] 0.41 ± 0.06 Un-RX matrix 30o, 55o, 45o
The Gibbsian excess of Sn atoms at the interface was found for GB1 as 0.60 ± 0.08 at. nm-2
while GB2 showed a lower amount of 0.41 ± 0.06 at. nm-2. For means of comparison with
literature, the excess number is converted into at. %, equivalent Sn monolayer, by dividing the excess number by the density of (110) iron plane. The measured Sn excess then equals 3.5 and 2.4 at. % for GB1 and GB2, respectively, that corresponds to a GB enrichment factor, of about 78 and 53 times
the bulk concentration. Earlier studies with AES, reported segregation levels at 700ºC for Sn at GBs of Fe-Sn alloys. Seah and Hondros 7 measured a Sn enrichment factor, of 46 to 122 times the bulk
concentration, while Lejček et al. 13
reported a value of 138 times the bulk. These values compare well with the present study if one also takes into account that the timescale for segregation was much greater in the previous works and thus, a higher interfacial segregation can be expected. Unfortunately, there are no relevant data found in literature on Sn segregation for shorter times. GBS studies of Nb 17 and Ti, Mn 18 in Fe during recrystallisation, revealed Gibbsian excess numbers of comparable magnitude, ranging between 0.4 and 1.0 at. nm-2.
Meanwhile, in Fig. 2c it is interesting to observe that the experimental concentration profiles for both interfaces as measured in APT display some interesting peculiarities. Although there is some scatter in the data (σ = ± 0.035 at. %) it can be observed that the Sn profile has an asymmetric character,
1 2 3 4 5 6 7 8 9 10 11 12 13 14 15 16 17 18 19 20 21 22 23 24 25 26 27 28 29 30 31 32 33 34 35 36 37 38 39 40 41 42 43 44 45 46 47 48 49 50 51 52 53 54 55 56 57 58 59
exhibiting a minimum in Sn concentration at the vicinity of the GB. This minimum is at the side of the un-RX matrix, as shown by the direction of GB migration in Fig. 2. It is thus ahead of the moving interface, since the growth occurs from the RX grain towards the un-RX matrix. These observations are in accordance with the theoretical concentration profiles predicted by the solute drag theory 1,3.
The most prevailing theoretical description of solute drag is the one from Cahn 3, while Hillert and Sundman expanded it for the case of interphase boundary 26. In the classical solute drag theories it is assumed that the interface migrates with a steady velocity V and that the segregation profile is not changed during the boundary migration (steady state). According to Cahn, the concentration profile across the migrating interface is calculated by considering the flux of atoms across the boundary given by (1) where x is the position from the centre of the boundary (x = 0 at the GB), C(x) is the concentration of solute, E(x) is the interaction energy of solute-grain boundary and D(x) a diffusion coefficient of the solute, normal to the boundary, as defined by Cahn and will be so forth referred to as trans-interface diffusion coefficient.
The general solution of Eq. 1 is the following 3
(2)
for D constant it can be simplified to:
(3)
Whereas for a non-moving interface, V = 0, equation (1) simplifies to
1 2 3 4 5 6 7 8 9 10 11 12 13 14 15 16 17 18 19 20 21 22 23 24 25 26 27 28 29 30 31 32 33 34 35 36 37 38 39 40 41 42 43 44 45 46 47 48 49 50 51 52 53 54 55 56 57 58 59 60 61
where is the bulk concentration of solute. According to CSD, solutes exert a drag force , on a migrating boundary that first increases with velocity (low velocity limit) until a maximum at = 1; then it decreases (high velocity limit) and has an inflection point at . The unified expression to estimate the drag force valid for both the low and high velocity extremes is given by 3:
(5)
with and parameters that are approximately inversely proportional to diffusivity 3. The CSD theory was applied on the experimental concentration profiles, using the wedge-shape model of binding energy, ( ) [3]. In this approach, the binding energy exhibits a linear variation from the minimum value, E0 (negative for the case of solute adsorption) at x = 0, to a null value at the GB limit
(E(x) = 0 for x = ± δ/2). Velocity under the effect of Sn was experimentally estimated (with EBSD) from the average recrystallized (RX) grain size evolution as a function of annealing time, as = 220 nm s-1 at XV = 0.45. Finally, regarding the trans-interface diffusion coefficient, ( ), it has been
generally accepted that ( ) is more closely related to the bulk than the GB diffusion coefficient 27–29
. This diffusion coefficient is expected to be higher than the bulk diffusion coefficient of Sn in α-Fe,
= 1.27·10-1 m2 s-1 ∙
20
. Following other authors in literature 30,28, it is assumed that the trans-interface diffusion coefficient is the product of the bulk diffusion coefficient and a numerical factor: , with 5. The parameters of the CSD model were adjusted to fit the
experimentally obtained Gibbsian interfacial excesses at the two migrating interfaces taking T = 973K, C0 = 0.045 at. % and an interface half-width δ = 2.5 nm. The interface width is certainly overestimated
compared to a value of about 1 nm usually used for migrating interfaces. However, considering that APT induces some broadening of the concentration profiles, a convolution effect results in a larger apparent segregation width 31,32.
Two approaches were followed to determine the variables E0 and V for each C(x), as the measured
interfaces revealed varying segregated content of Sn. The first approach assumes that the interface velocities at the two GBs are similar and equal to the mean interface velocity ( = 220 nm s-1). In
1 2 3 4 5 6 7 8 9 10 11 12 13 14 15 16 17 18 19 20 21 22 23 24 25 26 27 28 29 30 31 32 33 34 35 36 37 38 39 40 41 42 43 44 45 46 47 48 49 50 51 52 53 54 55 56 57 58 59
this case the ratio is held constant and the fit is done for each grain boundary to determine the value of
, on the basis that binding energy may vary along the boundary and for different grain boundary
structures, potentially due to changes in atomic structure 33. For the given parameters and used in the CSD model, the values of binding energies, 0 were estimated at about –29.1 ± 1.0 kJ mol
-1
and –26.7 ± 1.9 kJ mol-1 for GB1 and GB2 respectively. A higher interaction energy for GB1 could be related to boundary misorientation that is higher for GB1 than for GB2, such misorientation dependence has been previously reported 34,35. The values are reasonable as compared to the ones available in literature. Seah has estimated the binding energy of Sn in Fe-Sn to be around –20 kJ mol-17, while on a similar study to the present one, for Nb in Fe-Nb, a binding energy was estimated about –28.9 kJ mol-1
36,28
. It is noted that in the study of Maruyama et al. the Nb concentration at migrating boundary is found at similar levels with the present results for Sn.
In the second approach, the
value was held constant to the mean value estimated for the two
interfaces (E0 = – 27.9 kJ mol
-1
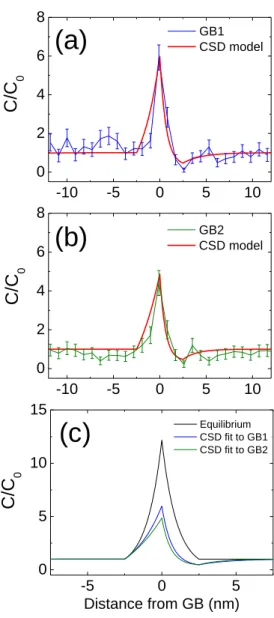
) while the ratio is used to fit the experimental results by varying the intrinsic velocity at the interface, to account for the condition that the two GBs are moving at different velocities 37. The velocities were estimated as = 170 nm s-1 for GB1 and = 270 nm s-1 for GB2. The estimated velocity of GB1 is slightly lower than the estimated mean velocity ( = 220 nm s-1), whereas that of GB2 is higher. The result of the fit using the CSD is shown in Fig. 3a-b, essentially the fit after both procedures lead to the same result. There is a very reasonable agreement with the APT experimental profiles. The influence of interface velocity can be evaluated in the two GBs as a consequence of solute drag for either boundary, as shown in the fitted profiles in Fig. 3c.
1 2 3 4 5 6 7 8 9 10 11 12 13 14 15 16 17 18 19 20 21 22 23 24 25 26 27 28 29 30 31 32 33 34 35 36 37 38 39 40 41 42 43 44 45 46 47 48 49 50 51 52 53 54 55 56 57 58 59 60 61
Figure 3. Concentration profiles from APT in comparison to the Cahn’s solute drag model. a) for
GB1, b) for GB2 and c) the equilibrium profile together with the one affected by solute drag accounting for a difference in interface velocity magnified at the migrating interface.
The drag force exerted by Sn solutes (at T=973K) was estimated using Eq. 5 for the given values of diffusivity and binding energy. By substituting in Eq. 5 with the fitted values of intrinsic velocities from the APT analysed migrating boundaries, the solute drag forces on these boundaries can be estimated as . ∙ 08 J m-3 for 170 nm s-1 (GB1) and .6∙ 08 J m-3 for 270 nm s-1 (GB2). These values are not far from the maximum drag force of 2. ∙ 08 J m-3 for = 1 that is predicted for GB velocities
-10 -5 0 5 10 0 2 4 6 8
C
/C
0 GB1 CSD model -10 -5 0 5 10 0 2 4 6 8C
/C
0 Distance from GB (nm) GB2 CSD model(a)
(b)
-5 0 5 0 5 10 15C
/C
0 Distance from GB (nm) Equilibrium CSD fit to GB1 CSD fit to GB2(c)
1 2 3 4 5 6 7 8 9 10 11 12 13 14 15 16 17 18 19 20 21 22 23 24 25 26 27 28 29 30 31 32 33 34 35 36 37 38 39 40 41 42 43 44 45 46 47 48 49 50 51 52 53 54 55 56 57 58 59
of the order of 1200 nm s-1. The present experimental conditions (i.e. strain in the as-deformed state, annealing temperature) correspond to the low velocity limit of CSD theory. Therefore, the boundary with a lower excess (GB2) migrates at a higher velocity than the average grain growth kinetics and thus, the drag force from the solute will be stronger. Regarding the effect of Si atoms on the migrating boundaries (segregation shown by the APT data); its effect is considered to be of secondary importance as Sn has been shown to be the element that essentially retards boundary migration during recrystallization 38 (more details are given in the Supplementary Information).
Considering now the comparison to the solute drag theory, it needs to be born in mind that the Cahn theory assumes a steady-state condition that is the ideal case. Nevertheless, the majority of the literature applies it as it simplifies the mathematical description of boundary migration process. On the other hand, the non-steady state case is less treated in the literature. Recently Zhang et al. 39 discussed the appropriacy of a steady-state assumption with a theoretical phase-field method approach, their calculations showed that the steady-state assumption may overestimate the solute concentration at the migrating boundary. In the current work, besides the mathematical simplicity, the steady-state assumption is considered to be a reasonable case as the experimental and theoretical profiles fit well for reasonable values of the intrinsic boundary variables ( ).
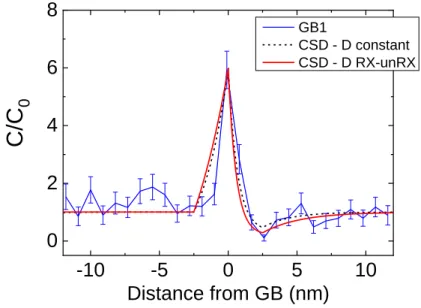
Finally, the complexity of the deformed structure also needs to be considered. Since the driving force of recrystallisation is not constant 24 and it varies with the heterogeneities of the deformed lattice as the motion of the boundary proceeds 40, the difference in excess number at the GB could also be affected by the growth history of the two interfaces. Moreover, the experimental profiles of Fig. 3a-b are observed to fit better to the theory for the un-RX side of the interface. This could be related to a higher diffusion coefficient in the not recrystallized structure compared to the recrystallized grain, as a higher dislocation content could enhance diffusion via dislocation pipes 41. In order to illustrate such an effect, Eq. 2 has been applied with a diffusion coefficient 3 times higher for the un-RX grain ( 600 nm2 s-1) than for the RX one ( 200 nm2 s-1). Fig. 4 shows that a better fit can be
obtained by such a treatment than for a constant ( 400 nm2
1 2 3 4 5 6 7 8 9 10 11 12 13 14 15 16 17 18 19 20 21 22 23 24 25 26 27 28 29 30 31 32 33 34 35 36 37 38 39 40 41 42 43 44 45 46 47 48 49 50 51 52 53 54 55 56 57 58 59 60 61
side of the interface. However further work will be needed to really quantify the difference in diffusivities between the two grains.
-10
-5
0
5
10
0
2
4
6
8
C/
C
0Distance from GB (nm)
GB1 CSD - D constant CSD - D RX-unRXFigure 4. The experimental concentration profile for GB1 fitted to the Cahn’s solute drag model using
a constant diffusion coeffient across the interface (dashed line) or a different diffusion coefficient for each side of the interface (solid line). The diffusion coefficient for the un-RX side is taken three times
the RX side with the transition at 0.
4.
Conclusions
The present work gives an insight of solute drag acting on moving interfaces from the experimental point of view and in comparison, with well-established physical interpretations of the phenomena. Sn solute segregation was measured quantitatively at the grain boundaries of Fe alloys by means of APT. The application of a site-specific methodology, using the combination of EBSD, FIB and APT characterization assisted in the quantification of interfacial segregation of Sn and link to grain boundary structure. The values of Sn segregation were obtained for two GBs during static recrystallisation and the profile of Sn concentration at the migrating interface was well described by the steady state solute drag theory expressed by Cahn. The Gibbsian excess number of solutes at two migrating interfaces yielded that the segregation amount varied. This difference could be explained by
1 2 3 4 5 6 7 8 9 10 11 12 13 14 15 16 17 18 19 20 21 22 23 24 25 26 27 28 29 30 31 32 33 34 35 36 37 38 39 40 41 42 43 44 45 46 47 48 49 50 51 52 53 54 55 56 57 58 59
a variation in grain boundary binding energy, intrinsic velocity at which each interface migrates or driving force. For the studied conditions, the solute drag effect of Sn at the moving grain boundaries during static recrystallisation is suggested to be strong, with Sn expected to reduce greatly the mobility of general GBs.
Acknowledgements
This project (ANRT – Project no 1073-2015) was possible with the support of National Association of Research and Technology and the funding from ArcelorMittal Maizières Research SA. Special thanks to Dr. G. Da Rosa for fruitful discussions. The authors would also like to acknowledge the support in the experimental part, from Dr. A. Campos and Dr. M. Cabié of Centre Pluridisciplinaire de Microscopie électronique et de Microanalyse (CP2M) as well as Dr. M. Descoins of Institut Matériaux Microélectronique Nanosciences de Provence (IM2NP), Marseille.
1 2 3 4 5 6 7 8 9 10 11 12 13 14 15 16 17 18 19 20 21 22 23 24 25 26 27 28 29 30 31 32 33 34 35 36 37 38 39 40 41 42 43 44 45 46 47 48 49 50 51 52 53 54 55 56 57 58 59 60 61
Appendix A. FIB preparation for APT
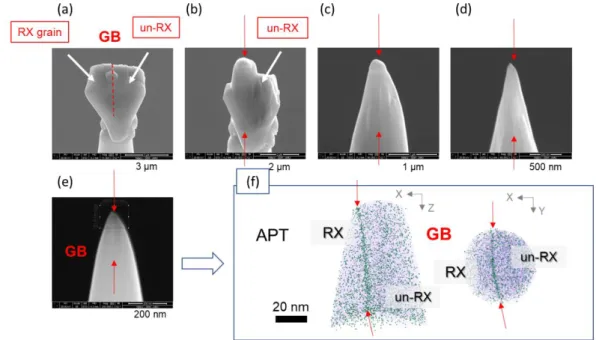
Fig. A.1(a-f) shows the correlative manner of FIB sample preparation and APT analysis to follow the GB of interest and identify the recrystallized grain (RX grain) and the not-recrystallized grain (un-RX). During annular milling in the FIB, secondary electron (SE) images were collected systematically. The RX – unRX grains demonstrated a different milling response as a result in the very different dislocation density within these two grains; the un-RX side had a rougher morphology during milling (Fig. 1b). The final prepared tip contained the GB in an off-centre configuration making it easier to compare at the end of the APT analysis the SE images to the obtained 3D-atom volume.
Figure A.1 The sequence of SE images collected during the FIB preparation of APT tips containing a GB. (a-e) show the tip at different stages of the milling procedure to keep track of the RX and un-RX
1 2 3 4 5 6 7 8 9 10 11 12 13 14 15 16 17 18 19 20 21 22 23 24 25 26 27 28 29 30 31 32 33 34 35 36 37 38 39 40 41 42 43 44 45 46 47 48 49 50 51 52 53 54 55 56 57 58 59
Appendix B. FIB preparation for APT
Table A.1 shows the Gibbsian excess values, Γi of the segregation elements. Sn atoms are clearly
observed to segregate at both GBs, while relatively small enrichment of Si atoms is also observed especially at GB1. GB1 also has some C segregation that was harder to visualise in GB2. The Si enrichment factor at the grain boundary may be considered inconsequential at this stage, with .
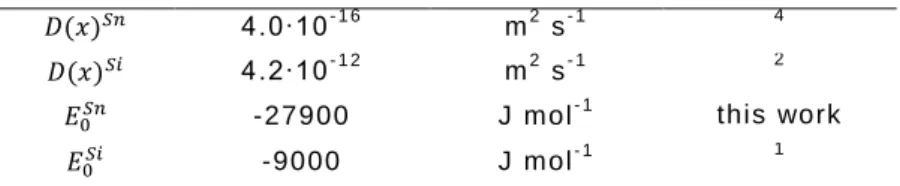
Table A.2 gives the solute-boundary binding energies and diffusion coefficients at 700ºC of Sn and Si in bulk α-Fe. With these data the solute drag forces, Pi can be estimated; for the GB velocity regime in
this study PSi is one order of magnitude lower than PSn. For the present conditions the drag force from
Sn solutes is of the order of 108 J m-3, while the drag from Si is much weaker of about 106 J m-3 due to a lower solute-boundary binding energy and faster diffusion coefficient for Si in α-Fe 1,2.
Additionally, in a previous comparative work that was focused on the recrystallization evolution, a reference model alloy of Fe-5.8 at.%Si was used to evaluate the effect of the addition of Sn3, where it is shown that the material’s behavior, during recrystallization, changed dramatically with the addition of Sn. Hence, it is considered that the Si effect on the migrating interfaces is expected but is considered to be negligible compared to the Sn solute effect as demonstrated in the recrystallization kinetics in 3.
Table A.1 Grain boundary segregation values for the various elements.
Grain
boundary [hkl]
Segregation e xcess number, (at nm- 2)
Sn C Si
GB1 48.2o [124] 0.60 ± 0.08 0.27 ± 0.05 3.77 ± 0.28
GB2 27.5o [234] 0.40 ± 0.06 0.44 ± 0.03 1.83 ± 0.25
Table A.2 Trans-interface diffusion coefficients at 700ºC and grain boundary binding energies used in the drag force calculation. 4.0∙10- 1 6 m2 s- 1 4 4.2∙10- 1 2 m2 s- 1 2 -27900 J mol- 1 this work -9000 J mol- 1 1
1 2 3 4 5 6 7 8 9 10 11 12 13 14 15 16 17 18 19 20 21 22 23 24 25 26 27 28 29 30 31 32 33 34 35 36 37 38 39 40 41 42 43 44 45 46 47 48 49 50 51 52 53 54 55 56 57 58 59 60 61
Figure A.2 APT volumes with the atom distributions at GB1 and GB2 after heat-treatment at 700ºC for 10 seconds, a,e) shows an overall view of the volumes, while the distribution of elements is shown
in b,f) for Sn, c,g) for C and d,h) for Si atoms.
Figure A.3 The concentration profiles across the migrating recrystallisation interfaces (GB1 and GB2), while the RX and un-RX side of the interface is indicated on the plot.
Appendix references
1
C. Qiu, H.S. Zurob, and C.R. Hutchinson, Acta Materialia 100, 333 (2015).
2
R.J. Borg and D.Y.F. Lai, Journal of Applied Physics 41, 5193 (1970).
3
N. Mavrikakis, P.R. Calvillo, W. Saikaly, M. Descoins, D. Mangelinck, and M. Dumont, IOP Conf. Ser.: Mater. Sci. Eng. 375, 012016 (2018).
4
1 2 3 4 5 6 7 8 9 10 11 12 13 14 15 16 17 18 19 20 21 22 23 24 25 26 27 28 29 30 31 32 33 34 35 36 37 38 39 40 41 42 43 44 45 46 47 48 49 50 51 52 53 54 55 56 57 58 59
References
1K. Lücke and K. Detert, Acta Metall. 5, 628 (1957).
2
K.T. Aust and J.W. Rutter, Trans AIME (1959).
3
J.W. Cahn, Acta Metall. 10, 789 (1962).
4
L.S. Shvindlerman, G. Gottstein, and D.A. Molodov, Phys. Status Solidi -Appl. Res. 160,
419 (1997).
5
P. Lejcek, Grain Boundary Segregation in Metals (Elsevier, 2010).
6
K.T. Aust and J.W. Rutter, Trans. Met. Soc. AIME 215, 119 (n.d.).
7
M.P. Seah and E.D. Hondros, Proc. R. Soc. Math. Phys. Eng. Sci. 335, 191 (1973).
8
G. Graiss, G. Saad, A. Fawzy, and M.A. Kenawy, Czechoslov. J. Phys. 41, 149 (1991).
9
S.G. Song, J.S. Vetrano, and S.M. Bruemmer, Mater. Sci. Eng. A 232, 23 (1997).
10
M. Godec, M. Jenko, H.J. Grabke, and R. Mast, ISIJ Int. 39, 742 (1999).
11
J.-Y. Li, F. Fang, D.-X. Su, S. Zhang, and Y.-L. Chen, Procedia Eng. 81, 1271 (2014).
12
S. Suzuki, K. Kuroki, H. Kobayashi, and N. Takahashi, Mater. Trans. JIM 33, 1068 (1992).
13
P. Lejček, P. Šandera, J. Horníková, J. Pokluda, and M. Godec, Appl. Surf. Sci. 363, 140
(2016).
14
T.F. Kelly and M.K. Miller, Rev. Sci. Instrum. 78, 031101 (2007).
15
B. Gault, M.P. Moody, J.M. Cairney, and S.P. Ringer, Atom Probe Microscopy (Springer
New York, New York, NY, 2012).
16
B.W. Krakauer and D.N. Seidman, Acta Mater. 46, 6145 (11).
17
N. Maruyama, G.D.W. Smith, and A. Cerezo, Mater. Sci. Eng. A 353, 126 (2003).
18
J. Takahashi, J. Haga, K. Kawakami, and K. Ushioda, Ultramicroscopy 159, 299 (2015).
19
N. Mavrikakis, C. Detlefs, P.K. Cook, M. Kutsal, A.P.C. Campos, M. Gauvin, P.R.
Calvillo, W. Saikaly, R. Hubert, H.F. Poulsen, A. Vaugeois, H. Zapolsky, D. Mangelinck, M.
Dumont, and C. Yildirim, Acta Mater. 174, 92 (2019).
20
D.N. Torres, R.A. Perez, and F. Dyment, Acta Mater. 48, 2925 (2000).
21
P.O. Rossi and C.M. Sellars, Acta Mater. 45, 137 (1997).
22
P. Lejček and V. Havlova, Mater. Sci. Eng. A 462, 446 (2007).
23
K. Thompson, D. Lawrence, D.J. Larson, J.D. Olson, T.F. Kelly, and B. Gorman,
Ultramicroscopy 107, 131 (2007).
24
M.H. F.J. Humphreys, Recrystallization And Related Annealing Phenomena, 2nd ed.
(ELSEVIER Ltd, 2004).
25
P. Maugis and K. Hoummada, Scr. Mater. 120, 90 (2016).
26
M. Hillert and B. Sundman, Acta Metall. 24, 731 (1976).
27
C.R. Hutchinson, A. Fuchsmann, and Y. Brechet, Metall. Mater. Trans. A 35, 1211 (2004).
28
C.W. Sinclair, C.R. Hutchinson, and Y. Bréchet, Metall. Mater. Trans. A 38, 821 (2007).
29
1 2 3 4 5 6 7 8 9 10 11 12 13 14 15 16 17 18 19 20 21 22 23 24 25 26 27 28 29 30 31 32 33 34 35 36 37 38 39 40 41 42 43 44 45 46 47 48 49 50 51 52 53 54 55 56 57 58 59 60 61 30
N. Maruyama and G.D.W. Smith, Mater. Sci. Forum 467–470, 949 (2004).
31
D. Blavette, P. Duval, L. Letellier, and M. Guttmann, Acta Mater. 44, 4995 (1996).
32
F. Vurpillot, A. Bostel, and D. Blavette, Appl. Phys. Lett. 76, 3127 (2000).
33
M. Greenwood, C. Sinclair, and M. Militzer, Acta Mater. 60, 5752 (2012).
34
T. Watanabe, T. Murakami, and S. Karashima, Scr. Metall. 12, 361 (1978).
35
G. Gottstein, D.A. Molodov, L.S. Shvindlerman, D.J. Srolovitz, and M. Winning, Curr.
Opin. Solid State Mater. Sci. 5, 9 (2001).
36
N. Maruyama, G.D.W. Smith, and A. Cerezo, Mater. Sci. Eng. A 353, 126 (2003).
37
K. Grönhagen and J. Ågren, Acta Mater. 55, 955 (2007).
38
N. Mavrikakis, P.R. Calvillo, W. Saikaly, M. Descoins, D. Mangelinck, and M. Dumont,
IOP Conf. Ser. Mater. Sci. Eng. 375, 012016 (2018).
39
C.-Y. Zhang, H. Chen, J.-N. Zhu, W.-B. Liu, G. Liu, C. Zhang, and Z.-G. Yang, Scr. Mater.
162, 44 (2019).
40
R.B. Godiksen, Z.T. Trautt, M. Upmanyu, J. Schiøtz, D.J. Jensen, and S. Schmidt, Acta
Mater. 55, 6383 (2007).
41