HAL Id: tel-02088169
https://tel.archives-ouvertes.fr/tel-02088169
Submitted on 2 Apr 2019
HAL is a multi-disciplinary open access archive for the deposit and dissemination of sci-entific research documents, whether they are pub-lished or not. The documents may come from teaching and research institutions in France or abroad, or from public or private research centers.
L’archive ouverte pluridisciplinaire HAL, est destinée au dépôt et à la diffusion de documents scientifiques de niveau recherche, publiés ou non, émanant des établissements d’enseignement et de recherche français ou étrangers, des laboratoires publics ou privés.
Bioinformatic and modelling approaches for a
system-level understanding of oxidative stress toxicity
Elias Zgheib
To cite this version:
Elias Zgheib. Bioinformatic and modelling approaches for a system-level understanding of oxidative stress toxicity. Quantitative Methods [q-bio.QM]. Université de Technologie de Compiègne, 2018. English. �NNT : 2018COMP2464�. �tel-02088169�
Par Elias ZGHEIB
Thèse présentée
pour l’obtention du grade
de Docteur de l’UTC
Bioinformatic and modelling approaches for a
system-level understanding of oxidative stress toxicity
Soutenue le 18 décembre 2018
Spécialité : Bio-ingénierie et Mathématiques Appliquées : Unité
de Recherche Biomécanique et Bio-ingénierie (UMR-7338)
B
IOINFORMATIC AND MODELLING APPROACHES
FOR A SYSTEM
-
LEVEL UNDERSTANDING OF
OXIDATIVE STRESS TOXICITY
A
THESIS SUBMITTED TO THEU
NIVERSITE DET
ECHNOLOGIE DEC
OMPIEGNES
ORBONNEU
NIVERSITESLABORATOIRE DE BIO-MECANIQUE ET BIOINGENIERIE UMRCNRS7338–BMBI
18
TH OFD
ECEMBER2018
For the degree of Doctor
Spécialité : Bio-ingénierie et Mathématiques Appliquées
Elias ZGHEIB
SUPERVISED BY
Prof. Frédéric Y. BOIS
J
URY MEMBERSMme. Karine AUDOUZE
Rapporteur
Mr. Vincent FROMION
Rapporteur
Mme. Cécile LEGALLAIS
Examiner
Mr. Maxime CULOT
Examiner
2
TABLE OF CONTENTS
Table of Contents ... 2 Acknowledgements ... 5 List of Abbreviations ... 7 List of Figures ... 9 List of Tables ... 14 1 Introduction ... 16 2 Bibliography ... 24 2.1 Toxicology ... 24 2.1.1 Definition of Toxicity ... 242.1.2 Predictive Toxicology: Prevention ... 24
2.1.3 Birth of Toxicology ... 25
2.1.4 Limitations of Traditional Toxicology ... 25
2.1.5 A Paradigm Shift in Toxicology ... 26
2.1.6 Modern Toxicology ... 33
2.2 Biology Underlying Toxicology ... 38
2.2.1 Oxidative Stress, Nrf2 and some Associated Pathways ... 39
2.2.2 Systems Biology – SB ... 45
2.2.3 Adverse Outcome Pathways – AOP ... 47
2.3 Mathematical Considerations ... 49
2.3.1 Ordinary Differential Equations – ODE – Systems ... 49
2.3.2 Michaelis-Menten – MM – Kinetics... 51
2.3.3 The Hill Equation ... 53
2.3.4 Bayesian Statistical Tools ... 57
2.3.5 Model’s Calibration ... 61
3 Construction of Systems Biology Model of Nrf2 Control of Oxidative Stress ... 64
3.1 Starting Models ... 64
3.1.1 The model of ‘Hamon et al. (2014)’ ... 64
3.1.2 The model of ‘Geenen et al. (2012) and Reed et al. (2008)’ ... 65
3.2 Methods ... 66
3.2.1 Remodelling Hamon’s model ... 66
3.2.2 Assembling two models ... 71
3.3 Results ... 74
4 SB and other Tools for the Development of quantitative AOPs ... 78
4.1 Study Context ... 78
3
4.2.1 Experimental data ... 80
4.2.2 Chronic Kidney Disease – CKD – AOP ... 81
4.2.3 Dose-Response based qAOP ... 82
4.2.4 Bayesian Network – BN – qAOP ... 83
4.2.5 The Systems Biology – SB – Model ... 85
4.2.6 Parameter Estimation ... 87
4.2.7 Uncertainty propagation ... 89
4.2.8 Software ... 89
4.3 Results ... 90
4.3.1 Dose-Response based qAOP Model ... 90
4.3.2 Bayesian Network – BN – qAOP Model ... 93
4.3.3 System biology – SB – Model ... 95
4.4 Discussion ... 101
4.5 Conclusion ... 107
5 Investigation of Nrf2, AhR and ATF4 Activation in Toxicogenomic Databases .... 109
5.1 The General Approach... 109
5.2 Material and Methods ... 111
5.2.1 Generation of Target Gene Lists ... 111
5.2.2 Construction of a Chemical-Effects Transcriptomics Database... 112
5.2.3 Data Sources ... 114
5.2.4 Bioinformatics Methods ... 116
5.2.5 Pathway’s Signature-Based Prioritization of Chemicals ... 120
5.3 Results ... 123
5.3.1 Pathways’ Global Signatures ... 123
5.3.2 Pathways’ Stratified Signatures in Liver ... 127
5.3.3 Human Liver Category: Pathway’s Signature-Based Prioritization of Chemicals ... 132
5.4 Discussion ... 136
5.1 Conclusion ... 139
6 Thesis Summary and Conclusion ... 140
Dissemination Activities ... 144
References ... 145
7 Appendix – Supplementary Material ... 162
7.1 Supplementary Information for Chapter 3... 162
7.2 Supplementary Information for Chapter 4... 170
7.2.1 Experimental Data ... 170
7.2.2 Statistical Dose-Response based qAOP Model ... 175
4
7.2.4 SB Model Validation ... 188
7.2.5 Effectopedia Implementation ... 192
7.3 Supplementary Information for Chapter 5... 194
7.4 The Nrf2 SB Model Code ... 198
Abstract ... 217
5
ACKNOWLEDGEMENTS
First and foremost I want to thank my supervisor Frédéric Y. Bois for his time and support. He was always ready to help and give constructive advice when I needed; and when I was behind in work or skills, he showed patience and kindness. I am grateful for his fundamental and uplifting contribution to my professional life. I owe him a lot in this area, it has been an honor to be his PhD student.
I thank Karine Audouze and Vincent Fromion for accepting to be my thesis rapporteurs and Cécile Legallais and Maxime Culot for being part of the jury.
The research leading to the results mentioned in this thesis has received support from the Innovative Medicines Initiative Joint Undertaking (IMIJU) under grant agreement number 115439, resources of which are composed of financial contribution from the European Union’s Seventh Framework Programme (FP7/2007-2013) and EFPIA companies’ in kind contribution. This manuscript reflects only the author’s views and neither the IMI JU nor EFPIA nor the European Commission are liable for any use that may be made of the information contained therein.
For their work and contribution to the administrative part of the thesis, I thank Salima Aaras-Andaloussi, Catherine Marque, Catherine Lacourt, Alexandra Cousin, Stéphanie Rossard, Joelle Chaumette from UTC.
I thank members of METO (Models for Ecotoxicology and Toxicology) research unit of INERIS: senior scientists (Céline Brochot, Rémy Beaudouin, Enrico Mombelli, Cléo Tebby and Florence Zeman) and PhD students (Claudio-Ileana Cappelli, Marc Codaccioni, Viviane David, Paul Quindroit, Wang Gao, Ségolène Siméon and Delphine). Even if I was not officially a part of METO, they did all the efforts possible to make me feel like one of them and make my visits to INERIS pleasant.
6
I thank Paul Jennings for receiving me in his laboratory in the Medical University of Innsbruck (Austria) back in fall 2015. I also thank Alice Limonciel and Anja Wilmes who helped me a lot in my work in Innsbruck. Paul, Alice and Anja actively participated to the analysis, writing and correction of an important part of two journal articles related to the thesis. I thank all people who stood by my side and shared with me cheerful and difficult moments of my extra-professional time during these four years. Their presence and support contributed directly or indirectly to the success of this project: In Lebanon (Jennifer Daou, Valérie Daou, Christian Khoury, Samir Khouzam, Eliane Makhoul, Habib, Céline & Melissa Safi, Myriam Saliba), in Compiègne (Sally Al Kantar, Mohammad-Ali Assaad, Nancy Chaaya, Jean-Baptiste Gachignard, Rita Maalouf, Jacqueline Maximilian, Hugues Richard de Monti, Halim Tannous), in Paris region (Ariane & Bertrand Chevalier-Chantepie, Arnauld de Genouillac, Philippe de Maistre, Digóenes Flima, Andreas Garshol Sørensen, Mildred-Jeanne and Manfred Hawran, Timothée Jolivet, Clément Lescat, Christophe Roger), in Lille (Marthe & Rémi Dujardin, Patrick Gonçalves, Brice Laureau, Anne-Claire Lozier, Nicolas Maury, Agathe Purcell, Camille & Paul) and Stéphanie & Maxime Dechelette.
Most of all, I thank my parents Kamil & Salwa without whom nothing of all of this would have been possible. I would like to thank my dearest sisters and brothers-in-law for they love and support, Clara & Doumit Sfeir and Nancy & Jean Tabet. Jean Tabet was the first person to encourage me to go forward, embark in a thesis project and discover the world of research.
Success and progress are to be celebrated with people we love, or in their memory – Julian A. Khoury (1993 – 2014).
7
LIST OF ABBREVIATIONS
AhR: aryl hydrocarbon receptorAO: adverse outcome
AOP: adverse outcome pathway ARE: antioxidant response element ARNT: AhR nuclear translocator ATF4: activating transcription factor 4 ATP: adenosine triphosphate
BN: Bayesian network
CAC: chemical activation capacity ChIP: chromatin immunoprecipitation CKD: chronic kidney disease
CYP: cytochrome P450
DBN: dynamic Bayesian network DCF: 2’,7’-dichlorofluorescein
carboxy-DCF: 6-carboxy-2’,7’-dichlorofluorescein DRE: dioxin response element
ER: endoplasmic reticulum FC: fold changes
GCL: glutamate cysteine ligase
GCLC: glutamate cysteine ligase catalytic subunit GCLM: glutamate cysteine ligase modifier subunit γGC: gamma-glutamyl-cysteine
GPX: glutathione peroxidase GR: glutathione reductase
8
GS: glutathione synthetase GSH: glutathione
GST: glutathione S-transferase HTS: high-throughput screening ITS: integrative testing strategy KBrO3: potassium bromate
KE: key event
Keap1: kelch-like-ECH-associated protein 1 KER: key events relationship
MCMC: Markov chain Monte Carlo MIE: molecular initiating event MM: Michaelis-Menten
MRP: multidrug-resistance protein
Nrf2: nuclear factor (erythroid-derived 2)-like 2 nucNrf2: nuclear Nrf2
ODE: ordinary differential equation
OECD: organization for economic cooperation and development PERK: RNA (PKR)-like endoplasmic reticulum kinase
qAOP: quantitative adverse outcome pathway RFU: relative fluorescence units
ROS: reactive oxygen species SB: systems biology
TF: transcription factor
nucX-AhR: the nuclear complex formed by the association of a xenobiotic X and AhR QIVIVE: quantitative in vitro-in vivo extrapolation
9
LIST OF FIGURES
Figure 1. Schematic representation of two theoretical interacting AOPs. Through a
timeline, different sections correspond to AOP levels (boxes represent the events, some examples are available in the lower part; arrows correspond to KERs).
Figure 2. Timeline illustrating the birth and development of toxicology from first in
vivo experiments by Paracelsus up to HTS initiatives in the European Union and the United States of America (Zgheib et al., 2017).
Figure 3. Standard Microplates of (A) 96-, (B) 384-, and (C) 1536-well formats
respectively.
Figure 4. Schematic representation of the Nrf2 signaling pathway in basal unstressed
condition as well as under its activation by oxidative (or electrophilic) stress (Taguchi et al., 2011).
Figure 5. Plot of enzymatic reaction’s velocity v against substrates concentration [S] in
10 different cases for Hill’s coefficient α gradually increasing from 1 (hyperbolic: Michaelis-Menten case) to 10 (all other curves (2 to 10) are S-shaped) (Duke, Modeling Cooperativity).
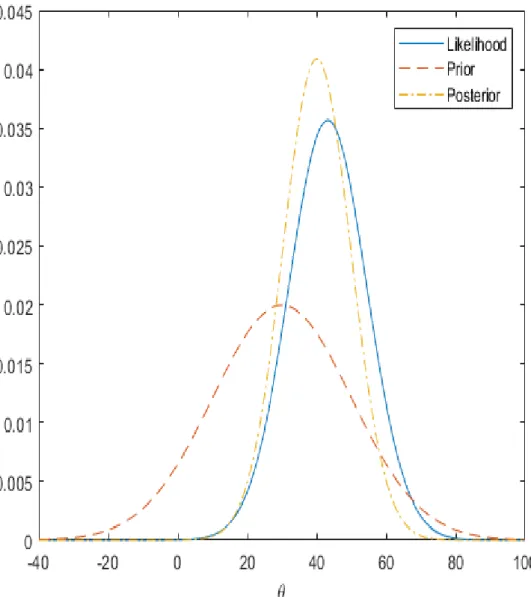
Figure 6. Prior, likelihood and posterior distributions for θ. The ‘posterior inference’ is
a formal compromise between the ‘observed evidence’ (likelihood), summarizing the ‘prior distribution’ of the data alone (Bayesian Analysis for a Logistic Regression Model - MATLAB & Simulink Example).
Figure 7. Schematic overview of the assembled SB model. This model covers both
transcriptional and biochemical aspects of GSH synthesis and metabolism and its control by the Nrf2-Keap1 signaling pathway. The blue compartment is cytosol and the red one is nucleus. Blue arrows show reactant(s):product(s) exchange during biochemical or transport reactions, and red arrows indicate enzymatic catalysis (diamond heads) or gene transcription (round heads). In the nucleus, red boxes represent genes and arrows indicate gene activation. Names
10
of genes are in orange, of mRNA are in green, of enzymes are in purple, of other proteins and metabolites in blue and of extracellular constants in yellow.
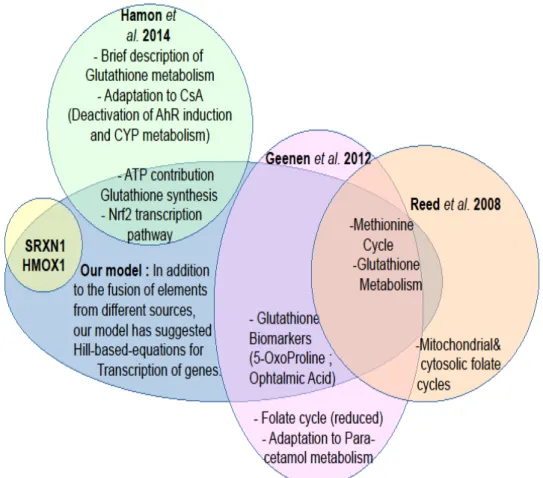
Figure 8. Venn diagram showing the contribution (overlapping areas) of different
source models (i.e. Hamon et al. (2014) in green, Geenen et al. (2012a) in pink and Reed et al. (2008) in orange) to our final assembled SB model (in blue) describing the control of oxidative stress by the Nrf2-Keap1 signaling pathway. This diagram also shows the parts of each model that were left out (non-overlapping areas). Two more genes (i.e., SRXN1 and HMOX1) that are often used as activation markers for Nrf2 pathway were added to the model (yellow).
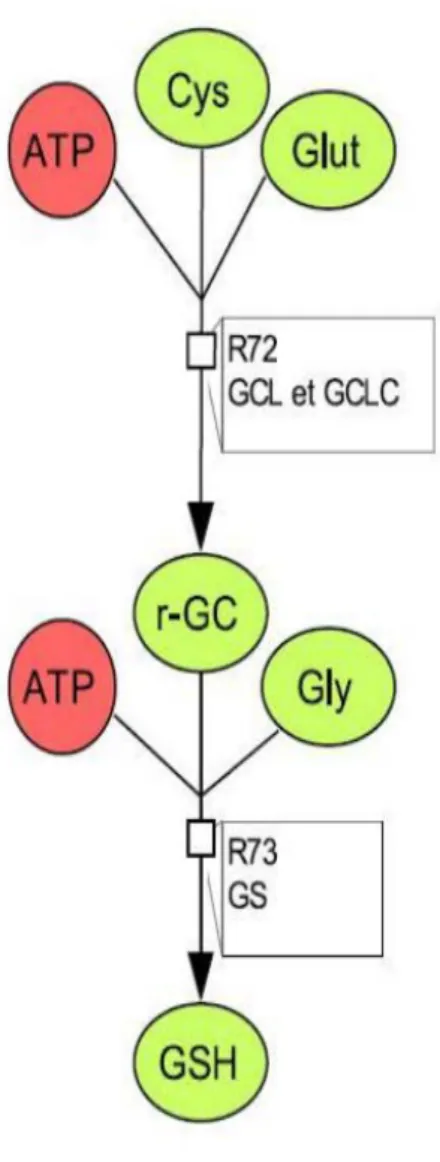
Figure 9. γGC and GSH synthesis reactions according to Geenen et al. (2012a) (left)
and to Hamon et al. (2014) (right). [Cys = cysteine, Glut = glutamate, glc and r-GC = gamma-glutamyl-cysteine; other acronyms are explained in the ‘List of abbreviations’].
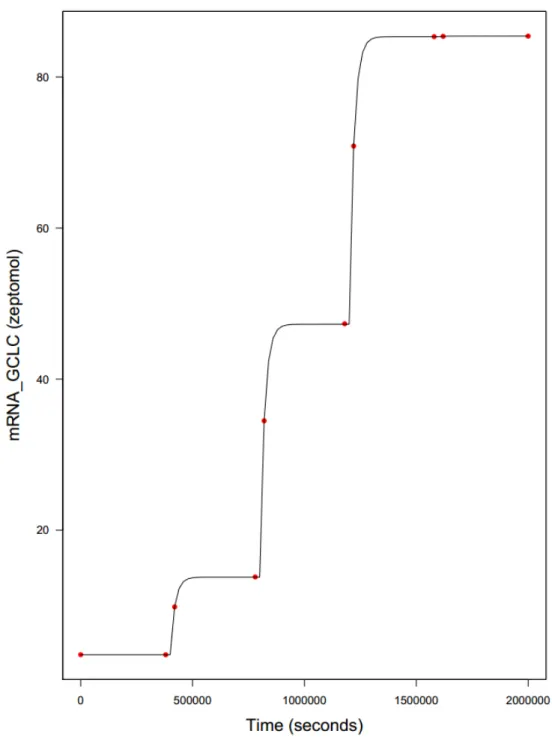
Figure 10. MCMC curve fitting of GCLC mRNA (example of gene activated by one
single TF) rate equivalency by time according to virtual exposure scheme presented in Table 3 applied on both Hamon's (red dots) and Hill-based (black curve) SB models.
Figure 11. MCMC curve fitting of MRP mRNA (example of gene activated by two TFs)
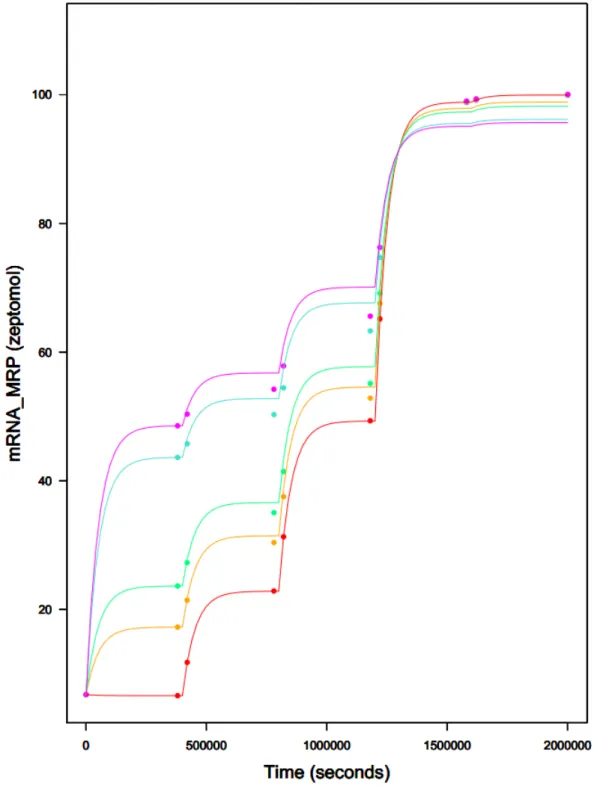
rate equivalency by time according to virtual exposure scheme presented in Table 3 applied on both Hamon's (colored dots) and Hill-based (colored curves) SB models. nucNrf2 dose increase is operated over time (every 400,000 seconds) and nucX-AhR dose is displayed on different curves (0 (red), 0.5 (orange), 1 (green), 10 (blue) and 100 (magenta) zeptomols of nucX-AhR).
Figure 12. A CKD AOP diagram. KERs are represented by arrows.
Figure 13. Structure of the DBN qAOP for CKD. KBrO3 concentration and the GSH readout do not vary with time, while the DCF and lactate readouts were observed at different time intervals. The arrows indicate probabilistic dependencies.
Figure 14. KBrO3 and DCF specific reactions of the SB model. Other abbreviations: extGSH is extra-cellular glutathione; cytGSH: cytosolic glutathione; extGSSG: extra-cellular
11
oxidized glutathione; cytGSSG: cytosolic oxidized glutathione. Reactions are represented by red circles: a. the oxidation of extGSH by KBrO3; b. oxidation of carboxy-DCF by ROS; c. DCF bleaching; d. oxidation of carboxy-DCF by KBrO3; e. oxidation of cytGSH by KBrO3.
Figure 15. Fit of the KBrO3 - GSH data (circles; each color represents one of the replicates) using the three qAOP models developed. The black line corresponds to the empirical model (equation 4.1). The best fit (solid line) is shown along with 20 additional random fits (gray), showing the uncertainty of the model predictions. The black dashed line represents the best fit obtained the DBN qAOP. The red line shows the best fit for the SB model.
Figure 16. Fit (top row) and predictions (bottom row) of the dose-response based qAOP
for the DCF (measured in RFU) (left) and lactate (right) readouts. The best fit surfaces (gray) are plotted along with all individual data (colored dots). The predicted chemical-independent relationships (in red) for GSH - time - DCF, or GSH - time - lactate were obtained by inversion of the qAOP equations (see ‘Supplementary Material 7.2.2’). The maximum posterior parameter values given in Table S5 were used to draw the figures.
Figure 17. Fit (top row) and predictions (bottom row) of the DBN qAOP for the DCF
(measured in RFU) (left) and lactate (right) readouts. The best fit surfaces (gray) are plotted along with the data mean (black dots) and all individual data (colored dots). The predicted chemical-independent relationships (in red) are shown for GSH - time - DCF and GSH - time - lactate. The maximum posterior parameter values given in Table S7 were used to draw the figures.
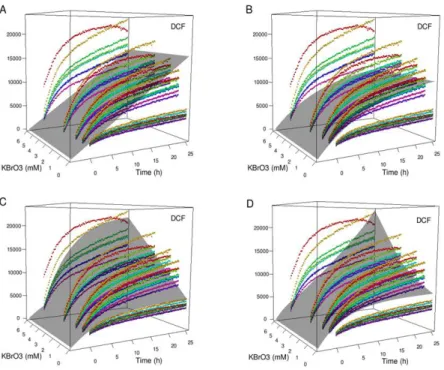
Figure 18. Best fits of SB model (gray surfaces) to the DCF RFU data (colored dots),
for different levels of complexity: (A) action of KBrO3 on external GSH and formation of DCF by ROS; (B) same as A with the addition of DCF bleaching; (C) same as B with the addition of a direct formation of DCF by KBrO3; (D) same as B, but with the addition of an action of KBrO3 on internal GSH.
12
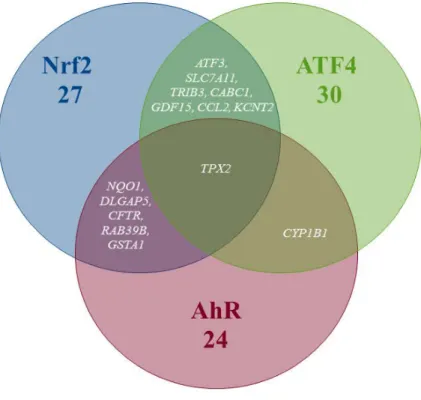
Figure 19. Venn diagram of the number of genes of each of the three studied pathways
(AhR, Nrf2 and ATF4) and their overlapping zones, included in the analysis.
Figure 20. Methods summarizing workflow
Figure 21. Geometric representation of chemical specificity and potency for the Nrf2
and AhR pathways. K represents a chemical and its coordinates are (CACAhR, K, CACNrf2, K). K also defines the vector 𝑶𝑶𝑶𝑶������⃗28T linking the origin O (0, 0) to point K. The absolute value of the cosine of the angle α between 𝑶𝑶𝑶𝑶������⃗28T and a pathway’s axis can be used to measure the specificity of a chemical for the given pathway (the smaller α, the more specific the chemical). On the other hand, the overall activation potency of a chemical increases proportionally with the length of 𝑶𝑶𝑶𝑶������⃗28T. Points A, B and C represent three other chemicals with different specificities and potencies for pathways’ activation (see text).
Figure 22. Venn diagram of the number of genes per pathway’s global signatures and
names of genes of overlapping zones.
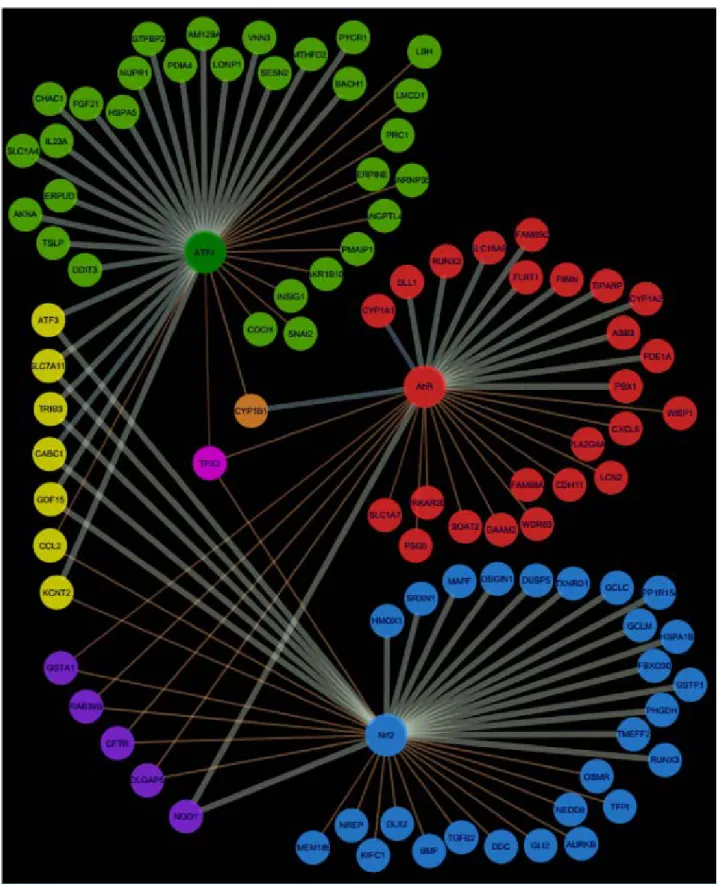
Figure 23. Network representation of AhR, Nrf2 and ATF4 pathway signatures and
their overlapping zones.
Figure 24. Venn diagrams of the number of genes per pathway’s stratified signatures
and names of genes of overlapping zones. Categories: (A) All liver data, (B) Rat Liver in vitro data, (C) Rat Liver in vivo data, (D) Human Liver in vitro data. *Refers to genes that were known to be part of the same overlapping zone according to Table S11 lists. White is the color of gene names that appear in an overlapping zone of only one of the four categories studied, and black is the color of gene names that appear in more than one category (two, three or four).
Figure 25. Distribution of chemicals by potency (Y-axis: module �𝑶𝑶𝑶𝑶������⃗�28T of the vector linking the origin O(0,0) to the chemical’s point in a 3D space) and specificity to the AhR pathway (X-axis: the absolute value of the |𝒄𝒄𝒄𝒄𝒄𝒄(𝜶𝜶)| of the angle between 𝑶𝑶𝑶𝑶������⃗28Tand the AhR axis in a 3 D space). Chemicals are represented by their rank in the alphabetically ordered list.
13
Chemicals that are both strong (horizontal blue dashed line: �𝑶𝑶𝑶𝑶������⃗� > 𝟎𝟎. 𝟓𝟓 ) and ATF4 specific (vertical blue dashed line: 𝒄𝒄𝒄𝒄𝒄𝒄 (𝜶𝜶) = 𝟏𝟏
√𝟑𝟑) are in red and their names are listed in the legend on
the right.
Figure 26. Distribution of chemicals by potency (Y-axis: module �𝑶𝑶𝑶𝑶������⃗�28T of the vector linking the origin O(0,0) to the chemical’s point in a 3D space) and specificity to the Nrf2 pathway (X-axis: the absolute value of the |𝒄𝒄𝒄𝒄𝒄𝒄(𝜶𝜶)| of the angle between 𝑶𝑶𝑶𝑶������⃗28T and the Nrf2 axis in a 3D space). Chemicals are represented by their rank in the alphabetically ordered list. The only chemical that is both strong (horizontal blue dashed line: �𝑶𝑶𝑶𝑶������⃗� > 𝟎𝟎. 𝟓𝟓 ) and Nrf2 specific (vertical blue dashed line: 𝒄𝒄𝒄𝒄𝒄𝒄 (𝜶𝜶) = 𝟏𝟏
√𝟑𝟑28T) Sulindac, is in red and it is listed in the legend on the right.
Figure 27. Distribution of chemicals by potency (Y-axis: module �𝑶𝑶𝑶𝑶������⃗�28Tof the vector linking the origin O(0,0) to the chemical’s point in a 3D space) and specificity to the ATF4 pathway (X-axis: the absolute value of the |𝒄𝒄𝒄𝒄𝒄𝒄(𝜶𝜶)| of the angle between 𝑶𝑶𝑶𝑶������⃗28T and the ATF4 axis in a 3D space). Chemicals are represented by their rank in the alphabetically ordered list. Chemicals that are both strong (horizontal blue dashed line: �𝑶𝑶𝑶𝑶������⃗� > 𝟎𝟎. 𝟓𝟓 ) and ATF4 specific (vertical blue dashed line: 𝒄𝒄𝒄𝒄𝒄𝒄 (𝜶𝜶) = 𝟏𝟏
√𝟑𝟑28T) are in red and their names are listed in the legend on the right.
14
LIST OF TABLES
Table 1. The 36 partners of the StemBANCC project listed in alphabetical order after
the names of the two leaders: F. Hoffmann-La Roche Ltd and University of Oxford.
Table 2. Toxicity-testing options defined by the ‘Toxicity testing in the 21st century: A
vision and a strategy’ report (National Research Council, 2007) in order to enhance the paradigm shift in toxicity research (Zgheib et al., 2017).
Table 3. Virtual exposure scheme applied on both Hamon's (old) and Hill-based (new)
SB models to perform MCMC curve fitting and establish equivalency between them. Genes that are activated by a single TF (i.e., CYP, GS, GCLC and GCLM) were exposed to five doses (one dose per time-point) ranging from 0 to 100 zeptomol doses of their TF (i.e, nucNrf2 or nucX-AhR). Genes that are activated by both TFs (i.e., Nrf2, GST, GPX and MRP) were exposed to five different and separate combinations of doses per time-point (25 combinations are possible). All exposures are in zeptomol.
Table 4. Hill parameter values (maximum posterior values) for gene transcription in the
SB assembled model of the Nrf2 control of oxidative stress. These values were obtained by MCMC simulations. Since calibration was performed with virtual data, we were not interested in the mean and the standard deviation of the distributions (not mentioned).
Table 5. Prior distributions of the parameters of the SB qAOP calibrated with the DCF
data.
Table 6. Summary of the posterior distribution of the five SB model parameters
describing the action of KBrO3 on the formation of DCF. The best parameterization (setting kGSHc,KBrO3at zero) is presented.
Table 7. Assessment of the SB model fit to the KBrO3 - time - DCF data using various criteria and for increasing model complexity. The various steps explain the main text of ‘Methods 4.2.5’. Step 1 is omitted since it does not require DCF data (parameter kGSHe,KBrO3,
15
quantifying the action of KBrO3 on extra-cellular GSH, was independently calibrated from the GSH data and set to its maximum likelihood value in all cases). The other parameters were introduced as follows: Step 2: action of KBrO3 on external GSH and formation of DCF by ROS (parameter kDCF,ROS); Step 3: adding DCF bleaching (parameter kbl); Step 4a: adding a
direct formation of DCF by KBrO3 (parameter kDCF,KBrO3); Step 4b: same as step 3, plus adding
an action of KBrO3 on internal GSH (parameter kGSHc,KBrO3); Step 5: all parameters added. Table 8. Number of chemicals used in each experimental category.
Table 9. Chosen pathway specific chemical through the dataset.
Table 10. Number of conditions (chemicals, concentrations, time-points) tested per
category.
Table 11. Pathway’s global signatures for AhR, Nrf2 and ATF4 pathways and the
signatures of their overlapping zones for all available data. Gray background indicates genes that appear in the signature of the pathway from previous studies (Table S11) and confirmed here. Non-grayed out values are novel allocations from this analysis.
Table 12. AhR, Nrf2 and ATF4 pathways’ signatures stratified in liver data and by all
liver data sub-categories (‘Rat Liver in vitro’ data, ‘Rat Liver in vivo’ data and ‘Human Liver in vitro’ data).
16
1
INTRODUCTION
A xenobiotic is an extrinsic chemical that is foreign to a certain living organism and its metabolism (Croom, 2012). Xenobiotics, either natural or artificially conceived, can be components of daily life’s ordinary objects (e.g. clothes, food, drugs, jewels, paintings, skincare products, plastic cups, pesticides etc.). Upon exposure, interactions between xenobiotics and biomolecules may elicit a perturbation in local biology and impair critical physiological functions of the organism. In fact, for some xenobiotics (e.g. pharmaceuticals), despite the strictly regulated toxicological control they undergo, unexpected adverse reactions may emerge leading to their failed licensing or even post-licensing withdrawal from market (Geenen et al., 2012). Thus, potential toxic impact of xenobiotics on human health is becoming of major clinical and socio-economic concern.
Toxicology can be defined as the science that examines the negative biological repercussions of xenobiotics on l iving organisms (Gundert-Remy et al., 2015). The main societal goal of toxicology is to develop reliable predictions of the human health impact of exposures to chemicals even before such events occur (Pelkonen, 2010). However, traditional toxicology, either in vivo or partially in vitro, has multiple limitations: high cost, low productivity, ethically equivocal protocols etc. (Zgheib et al., 2017). Furthermore, new understanding of biology shows more and more that the mechanisms that underlie toxicity are complex and involve multiple biological processes and pathways (Liu et al., 2011; Park et al., 2000). Considering traditional toxicology’s limitations and the complex underlying biological reality, does toxicology today have real chances to become a predictive science? If yes, through which channels would it be possible?
17
‘Systems biology’ (SB) is a relatively new discipline that provides a framework for investigating the interactions between the separate parts of biological systems in order to understand their functioning and detect any new emergent properties (Geenen et al., 2012). By integrating data concerning molecules and their interactions into an understanding of network behavior, SB provides insights into underlying mechanisms and basis of susceptibility to xenobiotics (Waters and Fostel, 2004) and creates a holistic view of biological systems (Chandra, 2009).
To handle and analyze complex biological systems and complex networks, Goelzer et al. (2008) showed how they can be broken down into sets of elementary functional modules. In the same spirit, signaling pathways and ‘adverse outcome pathways’ (AOP) are new emerging concepts that suggest broadening the toxicology framework to a system-wide level (Vinken, 2013) and help in the design of complex biology network models (Wittwehr et al., 2017) by summarizing them into more tractable components (Edwards et al., 2015). Practically, an AOP is a chemical-independent description of a linear path from a ‘molecular initiating event’ (MIE) to an eventual ‘adverse outcome’ (AO) at the organism or population level. In between, there can be any number of intermediate critical and measurable ‘key events’ (KEs) connected by ‘key events relationships’ (KERs). In typical AOP diagrams, KEs are represented by boxes and KERs by single one-directional arrows connecting them. (Allen et al., 2014; Ankley et al., 2010; Edwards et al., 2015; LaLone et al., 2017; Villeneuve et al., 2014). Figure 1 shows a schematic representation of two interacting AOPs: Boxes represent important events of an AOP (MIE, KEs or AO) with examples of each, and arrows are KERs.
18
Figure 1. Schematic representation of two theoretical interacting AOPs. Through a timeline,
different sections correspond to AOP levels (boxes represent the events, some examples are available in the lower part; arrows correspond to KERs).
AOPs and SB are some of the tools that can assist toxicology in moving from being a descriptive activity to becoming a more predictive mechanistic science (Materi and Wishart, 2007). For this purpose, AOPs and SB may either be used separately or combined. For example, a SB model can become a primary node, somewhere between a MIE and a KE in an AOP, setting the foundation for considering higher order questions of adaptive or compensatory responses and cross-talks among various pathways (Ankley et al., 2010). The theme of this doctoral thesis is the combination of these two approaches for safety assessment of chemicals.
The StemBANCC1 Project (2012-2018) was to develop an accessible and sustainable bio-bank of high quality well characterized patient-derived induced pluripotent stem cells lines that should speed up the drug development process and make therapies more adapted to specific human patients. Part of StemBANCC effort was devoted to demonstrating the use of such cells for drug safety research. StemBANCC was a five years European research project that started
19
in October 2012 and finished in March 2018. It was a collaboration between researchers from pharmaceutical companies, academic institutions and small and medium enterprises (Table 1). StemBANCC academic researchers received funding from the European Union’s Innovative Medicines Initiative2. Pharmaceutical companies involved provided in-kind contributions. The characterization of induced pluripotent stem cells in terms of genetic, protein, and metabolic profiles, with the help of bioinformatics and SB models, was also an important part of StemBANCC.
Within StemBANCC, our group was in charge of modeling in drug safety aspects. Our contribution to the project consisted mainly in defining and implementing mathematical models of transport and cellular effects of tested molecules. This PhD work focuses on the development of a SB model for a major toxicity pathway: the ‘nuclear factor (erythroid-derived 2)-like 2’ (Nrf2) pathway. The Nrf2 pathway is a very important adaptive response to oxidative stress (Andrews et al., 1993). Oxidative stress, linked to the over-production of ‘reactive oxygen species’ (ROS), is a major cause of chemical-induced injury and associated chronic diseases (e.g. cancer, Parkinson's disease etc.) (Kong et al., 2014). Implicated in xenobiotics' metabolism and transport, Nrf2 contributes to and modulates ROS scavenging by ‘glutathione’ (GSH) (Leclerc et al., 2014).
Our SB model was to be calibrated with induced pluripotent stem cells experimental data from StemBANCC partners. Having not received in time induced pluripotent stem cells data from the StemBANCC consortium, we have finally been constrained to calibrate our model with data produced with “ordinary” kidney in vitro human cells (RPTEC/TERT1) from a StemBANCC partner, the Medical University of Innsbruck (Prof. Paul Jennings, now based in Vrije Universiteit Amsterdam).
20
Apart the introduction, the present document is presented in four sections followed by a conclusion. First, Bibliography, is a literature review of each of the three aspects of the project: (i) toxicology (definition, history and transition to modern toxicology), (ii) biological context (oxidative stress, Nrf2 pathway, system-level approaches (SB and AOPs) to study biology) and (iii) computational tools used. The next section describes the building of a SB model (of the Nrf2 control of oxidative stress) for the development of a quantitative AOP. Then, in the following section, the SB model we conceived is calibrated and compared to two other mathematical approaches to quantitative AOPs. Finally, the last section, published as Zgheib et al. (2018), is a transcriptomic-based analysis of the cross-talks between Nrf2 and two other toxicity pathways: the ‘activating transcription factor 4’ (ATF4) branch of the unfolded protein response and the dioxin response i.e. ‘aryl hydrocarbon receptor’ (AhR) pathway.
The works of this doctoral thesis resulted in two published articles, a third paper that is currently in press and three posters. The first article, a literature review of ‘high-throughput methods for toxicology and health risk assessment’, was published in the ‘Environnement Risque Santé’ journal (Zgheib et al., 2017). The SB model constructed in ‘chapter 3’ was presented in two posters (StemBANCC general assembly and steer committee meetings). The analysis performed in ‘chapter 4’ is currently in submission as a journal article. Finally, ‘chapter 5’, the product of the work accomplished during the scientific visit to the laboratory of Prof. Paul Jennings (Medical University of Innsbruck, StemBANCC partner), was published in the ‘Frontiers in Genetics’ journal (impact factor 4.151) (Zgheib et al., 2018).
21
Table 1. The 36 partners of the StemBANCC project listed in alphabetical order after the
names of the two leaders: F. Hoffmann-La Roche Ltd and University of Oxford.
Institute Name City Country Logo
L
ea
d
er F. Hoffmann-La
Roche Ltd Basel Switzerland
L
ea
d
er
University of Oxford Oxford United Kingdom
AbbVie Deutschland GmbH
Wiesbaden -
Delkenheim Germany
AstraZeneca Södertälje Sweden
Boehringer Ingelheim
International GmbH Ingelheim Germany
Charité
Universitätsmedizin Berlin Germany
Concentris Research
Management Fürstenfeldbruck Germany
Eli Lilly Basingstoke United Kingdom
Gurdon Institute,
University of Cambridge Cambridge United Kingdom
Helmholtz Zentrum
München Neuherberg Germany
Hannover Medical
22 Innsbruck Medical
University Innsbruck Austria
Institut National de la Santé et de la Recherche Médicale Paris France Institut National de l'Environnement Industriel et des Risques
Verneuil-en-Halatte France
Janssen Research &
Development Beerse Belgium
King’s College London London United Kingdom
Linköping University Linköping Sweden
Medical Research Council - Functional Genomics Unit
Swindon United Kingdom
Merck Serono Darmstadt Germany
Natural and Medical
Sciences Institute Reutlingen Germany
Novo Nordisk AS Bagsvaerd Denmark
Orion Corporation Espoo Finland
Pfizer Limited Kent United Kingdom
Region Hovedstaden
23 Sanofi-Aventis
Recherche & Développement
Chilly-Mazarin France
Tel Aviv University Tel Aviv Israel
The Hebrew University
of Jerusalem Jerusalem Israel
Univercell-Biosolutions Toulouse France
University College
London London United Kingdom
Université de Genève Genève Switzerland
Université de Lausanne Lausanne Switzerland
Université de Technologie de Compiègne
Compiègne France
University of
Birmingham Birmingham United Kingdom
University of Edinburgh Edinburgh United Kingdom
University of Luebeck Luebeck Germany
24
2
BIBLIOGRAPHY
2.1 TOXICOLOGY
2.1.1 Definition of Toxicity
In certain conditions, a xenobiotic may induce perturbation in local biology and impair critical physiological functions of the organism (Hooper et al., 2013). The organism’s homeostatic defense against such chemical effects includes many biological processes from metabolic biotransformation, to cellular trans-membrane transport and activation of immune responses (Geenen et al., 2012). Toxicity occurs when physiological homeostatic regulatory processes are lost or deactivated, and/or when defense mechanisms are overwhelmed and are no longer efficient and sufficient for protection (Aschauer et al., 2015).
2.1.2 Predictive Toxicology: Prevention
The importance of toxicology in our days is relative to the amplitude of uncertainty and lack of information about toxicity of new and existing xenobiotics. Gathering appropriate knowledge, specific tools and various techniques, toxicology aims to spot harmful exposures, to assess their risk and to understand the mechanism of their toxicity in order to better prevent them. Prevention is possible when the toxic potential of an exposure is evaluated and accurately predicted even before the exposure occurs (Pelkonen, 2010).
25
2.1.3 Birth of Toxicology
Historically, experimental observations of toxicity, first described by Paracelsus ca. 1534, were re-framed into proper test methods during the 20th century (Trevan, 1927). Those methods mainly consisted in measuring adverse health outcomes in homogeneous animal groups at lethal or near-lethal doses and extrapolating them empirically to potentially estimate safe doses in humans (Bhattacharya et al., 2011). Since the 1940s, the basic, mainly animal-based, experimental protocols for assessing the effects of chemicals on health have changed little (Shukla et al., 2010).
2.1.4 Limitations of Traditional Toxicology
Whereas that traditional approach to toxicology has provided very important results through a century so far, it is still costly and resource-intensive (Zhu et al., 2014). In numbers, the global yearly expenses on animal experimentation reach about €10 billion, 20% of which for toxicology alone, sacrificing 100 million animals worldwide every year (Hartung, 2009). Moreover, animal studies are low-throughput, too slow to screen the more than 80,000 chemicals already commercialized, for which little toxicity information exists (Taboureau and Audouze, 2017), and the new chemical entities reaching the market every year (National Toxicology Program, 2004). In addition, animal to human transposition is not always reliable and is affected by many uncertainties. We are not 70 kg rats: basal metabolic rates and metabolic pathways are among the major species-specific differences making inter-species transposition difficult and imprecise (Kongsbak et al., 2014; Rangarajan and Weinberg, 2003). Besides, the extrapolation from the high-dose effects to low-dose responses is very difficult to validate. Finally, standardized animal tests make it difficult to take into account metabolic differences between different age groups and inter-subject variability in human populations (Szymański et al., 2011), even though progress has been recently made in that area (Zgheib et al., 2017).
26
2.1.5 A Paradigm Shift in Toxicology
The aforementioned hurdles created pressure to develop human-cell-based models. A need for a paradigm shift in toxicology started to emerge around 1980 (Rowan, 1983). The 3R's principle of replacement, reduction and refinement (Russell and Burch, 1959) had not gotten much echo in toxicology until that moment, at which scientific and technological advances, financial, ethical and legislative imperatives converged. Advances in molecular biology, cell biology (with stem cells technologies (Kitambi and Chandrasekar, 2011)), bioinformatics, SB and computational toxicology, introduced innovative methods less animal-based and with a higher-throughput productivity (Cotgreave, 2011). This new capacity to perform rapid examination of thousands of single agents or complex mixtures per day at relevant exposure levels, and the tools that make it possible, are named ‘high-throughput screening’ (HTS) (National Research Council, 2007). HTS in vitro assays using human cells allow the investigation of toxic effects in humans from different life stages and ethnicities (Inglese et al., 2006). With the support of computational mathematical methods, HTS has the potential to largely improve the human health risk assessment of xenobiotics (Bois, 2009; Krewski et al., 2009).
However, toxicological research did not evolve by virtue of innovation alone. Several initiatives from the European Union and the United States of America ran in the same direction, pushing for change since the beginning of the 21st century (Zhu et al., 2014) (Figure 2). We focus next on those efforts, noting that Japan has also followed the trend a bit later (Omoe, 2006).
27
Figure 2. Timeline illustrating the birth and development of toxicology from first in vivo
experiments by Paracelsus up to HTS initiatives in the European Union and the United States of America (Zgheib et al., 2017).
28
Regulatory and Scientific Initiatives in the European Union
o The 7th Amendment to the Cosmetics Directive
On January 15th 2003, the European 7th Amendment (2003/15/EC) to the Cosmetics Directive (76/768/EEC) restricted the use of animals in all cosmetic testing (Seidle and Stephens, 2009). It also set a time frame for the development of eventually validated alternative methods for toxicity testing (Pauwels and Rogiers, 2004). In 2009, a first restriction on acute toxicity animal-based testing took effect (Bhattacharya et al., 2011). By 2013, by European law, all new cosmetic ingredients intended for the European market had to be animal-test-free. That legislation has become a motor of change, and pushed for the development of eventually validated alternative testing strategies (Hartung, 2011).
o REACH Regulation: The Registration, Evaluation, Authorization and Restriction of Chemicals
Adopted by the European Commission in 2003, and implemented in 2007, the REACH regulation established a l ocal regulatory framework for the safety assessment of chemicals produced or imported in quantities greater than one ton per year (Foth and Hayes, 2008). It calls for the development of computational and experimental in vitro testing methods, integrated toxicity testing strategies, keeping in vivo experiments as a last resort. That comprehensive program aimed at evaluating the risks of more than 30,000 synthetic chemicals already in use in Europe by June 2018 (van Vliet, 2011). By this deadline only 20,000 chemicals were evaluated.
29 o European Union Scientific Research Projects
European actions have not only been legislative or regulatory. The FP73 and Horizon 20204 research programs have accompanied legislation consistently by pushing for the development of corresponding knowledge and technologies. The European Union has funded and launched many large-scale projects with different themes: ACuteTox Project5 in acute toxicity alternative testing, Scrtox6 Project and StemBANCC7 Project in stem cell technology, COSMOS8 in computational modeling, NOTOX9 in SB, the SEURAT-110 cluster and EU-ToxRisk11 in predictive toxicology etc.
Reports, Programs and Other Initiatives in the US
o The National Toxicology Program Road-Map
Aware of the above-mentioned development, the National Toxicology Program proposed in 2004 a road map for the future of toxicology testing entitled ‘A national toxicology program for the 21st century’ (National Toxicology Program, 2004), which called for a shift from observational methods towards more predictive, target-specific and mechanism-based alternative assays. It also placed the emphasis on tools like physiologically based pharmacokinetic modeling and quantitative structure-activity relationships to better support quantitative risk assessment. In 2005, the National Toxicology Program initiated a collaboration with the National Chemical Genomics Center to develop chemical libraries and HTS assays (Inglese et al., 2006; Shukla et al., 2010).
3https://ec.europa.eu/research/fp7/index_en.cfm [Accessed October 24th, 2018] 4http://www.horizon2020.gouv.fr/ [Accessed October 24th, 2018]
5http://www.acutetox.eu/ [Accessed October 24th, 2018] 6http://www.scrtox.eu/ [Accessed October 24th, 2018] 7http://stembancc.org/ [Accessed October 24th, 2018] 8http://www.cosmostox.eu/ [Accessed October 24th, 2018] 9http://www.notox-sb.eu/ [Accessed October 24th, 2018] 10http://www.seurat-1.eu/ [Accessed October 24th, 2018] 11http://www.eu-toxrisk.eu/ [Accessed October 24th, 2018]
30
o ToxCast Program: The Toxicity Forecaster of the Environmental Protection Agency ToxCast is a multi-year research program launched in 2007 b y the Environmental Protection Agency to run automated HTS in vitro assays and computational analyses for prioritizing further toxicity assessments of chemicals (Dix et al., 2007). It is based on bioactivity profiling of chemicals and screening changes in cells or proteins’ activity after exposure, with the ambition of picking out “remarkable” toxicity off the mass of data accumulated. Another goal is to establish causal links between eventual exposures and effects on biological pathways and targets (Environmental Protection Agency, 2007). Obviously, the latter calls for the development of high throughput exposure, toxicodynamic and toxicokinetic models (Judson et al., 2014).
o Toxicity Testing in the 21st Century: A vision and a Strategy
In 2005, t he National Research Council report entitled ‘Toxicity testing in the 21st century: A vision and a strategy’ proposed to government, academia, and industry, a paradigm shift in toxicology through the application of emerging disciplines and technologies (omics, SB, computational modeling, etc.) (Kavlock et al., 2007; National Research Council, 2007). The proposed approach advocates heavier use of mechanistically informative in vitro assays to study how chemicals interact with cellular response networks and turn them into toxicity pathways (Raunio, 2011). The report considers four options for toxicity testing summarized in
Tox21: Toxicology testing in the 21st Century
Toxicology testing in the 21st Century (Tox 21) is another collaborative testing and evaluation program that was established in 2008 via a Memorandum of Understanding between the National Toxicology Program, the National Chemical Genomics Center, and the Environmental Protection Agency, later joined by the US Food and Drug Administration. Tox21’s chemical library contains over 8,000 c hemicals of different kinds (e.g., pesticides,
31
marketed pharmaceuticals, food additives, industrial chemicals, cosmetic ingredients, chemicals found in household products and clothes etc.) (Schmidt, 2009).
Table 2: option 1 represents the statu quo and primarily relies on animal-based in vivo
tests and option 2 takes into consideration the available information on the substance studied and its mechanisms of action, and is already operational. The remaining two options respond to the ‘National Research Council’ calls at two different degrees: the extreme option 4 calls for an in vivo-free strategy (as envisioned in the legislation of the European Union for cosmetics’ ingredients), while the intermediate option 3 leaves open the possibility of using animal-based tests in complementarity to innovative mechanistic approaches (Carmichael et al., 2006).
Tox21: Toxicology testing in the 21st Century
Toxicology testing in the 21st Century (Tox 21)12 is another collaborative testing and evaluation program that was established in 2008 via a Memorandum of Understanding between the National Toxicology Program, the National Chemical Genomics Center, and the Environmental Protection Agency, later joined by the US Food and Drug Administration. Tox21’s chemical library contains over 8,000 c hemicals of different kinds (e.g., pesticides, marketed pharmaceuticals, food additives, industrial chemicals, cosmetic ingredients, chemicals found in household products and clothes etc.) (Schmidt, 2009).
Table 2. Toxicity-testing options defined by the ‘Toxicity testing in the 21st century: A vision
and a strategy’ report (National Research Council, 2007) in order to enhance the paradigm shift in toxicity research (Zgheib et al., 2017).
Criteria Option 1 in vivo Option 2 Tiered in vivo Option 3 in vivo / in vitro Option 4 in vitro
Biology Animal Animal Mostly Human Mostly Human
Concentrations used High High Multiple Multiple
Throughput Low Low Medium and High High
12 https://www.epa.gov/chemical-research/toxicology-testing-21st-century-tox21 [Accessed October 24th, 2018]
32
Quantity of animals used High Low Low None
33
2.1.6 Modern Toxicology
The field of toxicology has significantly evolved as we have seen above, with the progressive introduction of in vitro (expansion of toxicological databases substantially) and in silico methods (fine-tuning of computational methods), so that the latter now appear feasible and highly suitable (Kongsbak et al., 2014; Taboureau and Audouze, 2017). Considering the importance of this progress, we can start talking about HTS in toxicology. HTS tissue models have been developed at the interface between biotechnology, biomaterial engineering, bioinformatics and medical sciences. HTS has both qualitative and quantitative advantages. Quantitatively, HTS can be defined as the set of screening techniques that can be scaled up to test libraries of molecules at a rate exceeding thousands of structures daily in a concentration-response format using standardized protocols (Judson et al., 2013; Kavlock et al., 2007; Zhu et al., 2014). Qualitatively, a distinct advantage of HTS is its ability to test complex mixtures, combine experimental conditions and end-points to develop extensive dose-response relationships for different pathways across large concentration ranges for different exposure schedules (Astashkina et al., 2012; Boekelheide and Andersen, 2010).
Many elements contribute to the establishment of this modern approach to study toxicology. In this section, we will evoke four of the pillars of this emergent field: robotics, induced pluripotent stem cells, omics and bioinformatics.
34 Robotics
If HTS is possible, that is due to the rigorous robotic spotting technologies, the miniaturization of the assay vial (i.e., micro-plates) and automation (Rangarajan and Weinberg, 2003). The capacity of the micro-plates has significantly increased with time. From 96-well plates, originally used in virology (Feng et al., 2007), to 384- and 1,536-micro-well plates currently in use (Inglese et al., 2007), the equipment has been gradually improved to test more molecules and concentrations (van Vliet, 2011). The volume of the wells in a micro-plate has also decreased, down to volumes as low as 2μL (Mayr and Fuerst, 2008) (Figure 3).
Figure 3. Standard Microplates of (A) 96-, (B) 384-, and (C) 1536-well formats
respectively13.
35 Induced Pluripotent Stem Cells
Many features make induced pluripotent stem cells attractive for toxicity screening. Other than their uniform physiology and donor-specific genetic profile, they have unlimited self-renewal potential and are pluripotent (and therefore differentiable into various cell types such as hepatocytes, cardiomyocytes, neurons etc.) Human stem cells can be derived from embryonic cultures (isolated in the inner cell mass of the blastocyst (Bongso et al., 1994)), adult tissues (e.g., bone marrow (Pittenger, 2008), skin (Fernandes et al., 2009), liver (Gaudio et al., 2009), umbilical cord blood (Moon et al., 2008), and brain (Clarke et al., 2000) etc.), or through genetic reprogramming of easily accessible cells (e.g., skin fibroblasts, renal epithelial cells shed in urine etc.) into induced pluripotent stem cells (O’Malley et al., 2009). Although embryonic stem cells have a higher degree of pluripotency than induced pluripotent stem cells, they continue to be subject of ethical debates. Furthermore, the difficulty of inducing a reliable and efficient differentiation of all cells in one culture remains a major limitation of these techniques (Menasché, 2011), but progress is being made to alleviate that problem.
36
Omics (Transcriptomics, Proteomics, Metabolomics) and Biomarkers
In traditional toxicology, cell count and lactate dehydrogenase activity in the culture medium were at some point the only cytotoxicity endpoints measurable in vitro (Blaauboer, 2008). Nowadays, different cell death pathways are known and their activation can be followed using many cellular biomarkers (van Vliet, 2011). Omic technologies are aimed primarily at the universal detection of biomarkers, either they are genes (genomics), mRNA (transcriptomics), proteins (proteomics) or metabolites (metabolomics), in a specific biological sample in a non-targeted and non-biased manner (Horgan and Kenny, 2011). The use of omics profiling contributes to a better understanding of toxicology due to the considerable size of datasets it provides and its capacity of discovery of new more specific biomarkers. The amount of data generated by various omics technologies contributes to a better understanding of a drug's (and other chemical’s) safety profile (Gautier et al., 2013).
Bioinformatics
These days, it is not more difficult to measure the activity of a whole genome than it is that of a single gene, or even to sequence the genomes of thousands of micro-organisms or hundreds of human beings. Microscopy now offers extremely high resolution so thousands of single cells and multitude of parameters can be analyzed in parallel for each patient. Confronted with this flood of data, biologists are often at a loss because experimental planning and analysis methods need to be adapted accordingly (Systems Biology at University of Lyon — BioSyL)14. Using the increasingly large amount of biological and chemical data available and combining it with bioinformatics has become a promising approach permitting a chemical safety assessment across multiple scales of complexity from molecular to cellular and system levels in human health (Gautier et al., 2013).
37
The National Research Council works have clearly shown that extrapolated results obtained by even the most advanced in vitro methods require the development of specific mathematical models. In analogy with the commonly used ‘in vitro’ and ‘in vivo’, the term ‘in silico’ describes an analysis performed on a computer (Raunio, 2011). In toxicology, in silico techniques, also called ‘computational toxicology’, form a sub-discipline that uses computer and mathematical models to understand and predict the physio-pathological mechanisms of toxicity and their ultimate outcome as adverse effects (Cohen Hubal et al., 2010; Collins et al., 2008). In silico experiments can be carried out to test the effects of perturbations on the system and to identify the processes that control the system. Some of these experiments may only be feasible using a computer and most of them are faster and cheaper in silico than in vitro. Such “dry experiments” (computational modelling) may generate new hypotheses about the system, which can then be tested experimentally in “wet experiments” (laboratory experimentation). Computational toxicology offers remarkable possibilities by allowing the analysis of a large number of chemicals and biological interactions, yet more proof-of-concept studies are needed to demonstrate its added value and make it fully adopted by risk assessors and regulators.
38
2.2 BIOLOGY UNDERLYING TOXICOLOGY
In their review, Gautier et al. (2013) considered that studying a drug action and protein’s function in a global physiological environment may better inform us on the chemical’s toxicity. Network-level approach studies phenomena in their small details whilst linking them to a wider setting of interactions with their surroundings. In our work for example, the genesis of oxidative stress by xenobiotics and the dynamics of its control by the Nrf2 pathway, are described by a SB model that can be a node in a wider framework: for example in a ‘chronic kidney disease’ (CKD) AOP.
In this section we first cover the biological context of our mathematical models: the oxidative stress, the Nrf2-GSH response to oxidative stress, and other associated pathways (i.e., AhR and ATF4). Then, we will present in details system-level approaches used (i.e., SB and AOP).
39
2.2.1 Oxidative Stress, Nrf2 and some Associated Pathways
Cellular Metabolism of Xenobiotics
Inside the cell, an important homeostatic intracellular system of xenobiotic metabolizing enzymes families controls the intracellular levels of xenobiotics and their metabolites (Zhang et al., 2009). Some of these enzymes metabolize the xenobiotic via various reactions and some others conjugate it to other entities to detoxify it (Xu et al., 2005). Practically, upon the entry of a xenobiotic to the cell, this homeostatic system is triggered when xenosensor receptor molecules (e.g., AhR, constitutive androstane receptor, or pregnane X receptor etc.) are activated. This induces metabolizing enzymes (e.g., ‘cytochrome P450’ (CYP)) that may transform the xenobiotic into an intermediate metabolites (Nebert and Dalton, 2006). Then, the parent compound or its metabolites may activate ‘transcription factors’ (TFs) (e.g., Nrf2, ATF4 etc.) to induce so-called detoxifying enzymes (e.g., ‘glutathione-S-transferase’ (GST), ‘glutamate cysteine ligase’ (GCL) etc.) that catalyze a set of conjugation reactions that add hydrophilic conjugates to it. Finally, metabolites may be exported to the extracellular compartment by membrane-residing transporters (e.g., ‘multidrug-resistance protein’ (MRP) etc.). The role of this system is to control the amounts of xenobiotics and their metabolites that can accumulate in the cell, hopefully restricting their downstream toxicity (Zhang et al., 2009). The Nrf2 signaling pathway, like many other intracellular toxicity pathways, follows the aforementioned scheme.
40 Oxidative Stress
Under physiological conditions, the metabolism of oxygen and nitric oxide generates reactive byproducts (e.g., hydrogen peroxide, superoxide anion, etc.), aka free radicals, that are gathered under the terms of ROS and reactive nitrogen species (e.g., nitrite, nitrate, peroxynitrite etc.) respectively (Halliwell et al., 1992). The bioactivation of xenobiotics into reactive electrophilic metabolites undergoing redox cycling, is another source of free radicals (Zhang et al., 2009). These free radicals can react with DNA, protein, and lipids. Oxidative stress occurs when accumulation of intracellular ROS and reactive nitrogen species in a cell becomes uncontrolled due to the imbalance between their intracellular formation and removal from the cell (Himmelstein et al., 2004). Since the exposures tested here are nitrogen-free chemicals, only ROS will be used in this thesis to refer to oxidative stress.
Oxidative stress is a major cause of chemical-induced injury and associated chronic and degenerative diseases (e.g., cancer, Parkinson’s disease, arthritis, aging, autoimmune disorders, and cardiovascular diseases etc.) (Kong et al., 2014; Pham-Huy et al., 2008; Taguchi et al., 2011). However, several mechanisms can be put in place to counteract oxidative stress. First, the endogenous cellular enzymatic defense system (e.g., superoxide dismutase, catalase, ‘glutathione peroxidase’ (GPX), peroxiredoxins, ‘glutathione reductase’ (GR), sulfiredoxin, GST etc.) (Reddy, 2008). Second, other non-enzymatic antioxidants mainly acquired by food and supplementation (e.g., vitamin C (L-ascorbate), vitamin A, vitamin E etc.) quench ROS levels and thereby play key roles in modulating oxidative stress (Kohen and Nyska, 2002).
41 Nrf2 Control of GSH Synthesis and Oxidative Stress
Nrf2, a basic leucine zipper TF, is a cytoplasm based protein of 605 amino-acids in six domains (noted Neh1 through Neh6) (Itoh et al., 1999). Neh2 is a regulatory domain that, under basal conditions, interacts with the cytoskeleton-associated ‘kelch-like-ECH-associated protein 1’ (Keap1) of 624 amino acids of three domains. In the absence of oxidative stress, Nrf2 being constantly trapped by Keap1, is targeted by the ubiquitin ligase complex for ubiquitination. Ubiquitination, allowing Nrf2 degradation in the proteasome (Kobayashi et al., 2004), keeps Nrf2’s half-life very short (~10 minutes). Keap1, being rich of cysteine, reacts with ROS due to high electrophilicity (Deshmukh et al., 2017). Upon oxidative stress, reactivity of ROS with Keap1 cysteine improves which increases the oxidation of Keap1 (Kaspar et al., 2009). This conformational change in Keap1 lowers the ubiquitination of Nrf2, and thus makes Keap1’s binding to Nrf2 less favorable (Villeneuve et al., 2010). Onceits cytoplasmic retention mechanism by Keap1 is inactivated, Nrf2 translocates to the nucleus (Huang et al., 2000) where it binds to small proteins called ‘Maf’ to form ‘Nrf2-Maf’ heterodimers (Nguyen et al., 2000). Nrf2-Maf binds to the ‘antioxidant response element’ (ARE) in the promoter region of several genes (e.g., ‘glutamate cysteine ligase catalytic subunit’ (GCLC), ‘glutamate cysteine ligase modifier subunit’ (GCLM), ‘glutathione synthetase’ (GS), GPX, and MRP etc. (Kaspar et al., 2009)) to up-regulate their expression in response to a variety of stimuli. GS, GCLC and GCLM enzymes are involved in GSH synthesis and recycling, GPX contributes to its metabolism and ROS scavenging by GSH, and finally MRP helps eliminate its metabolites (Andrews et al., 1993; Jennings et al., 2013).
42
By serving as a substrate for antioxidant enzymes in redox cycles, GSH protects cells against electrophilic compounds and reactive metabolites by undergoing rapid oxidation and regeneration to maintain the intracellular redox status. However, under strong oxidative stress, such Nrf2-mediated detoxification processes consume GSH in a faster rate than its regeneration. GSH depletion makes cells more susceptible to oxidative stress which may damage DNA or impair cell viability. For a better visualization of the Nrf2 signaling pathway, we propose a schematic representation (Figure 4) of its behavior under both conditions: presence and absence of oxidative stress (Taguchi et al., 2011),.
Figure 4. Schematic representation of the Nrf2 signaling pathway in basal unstressed
condition as well as under its activation by oxidative (or electrophilic) stress (Taguchi et al., 2011).
43 Other Associated Pathways
Nrf2 is one of the important pathways that can be activated upon exposure to xenobiotics like oxidants. Nrf2 control of GSH synthesis, metabolism and transport, is an adaptive defense response of the cell to oxidative stress. This makes Nrf2 a c entral signaling pathway to be studied. However, in the modern understanding of biology, a pathway is never isolated. Thus to better locate Nrf2 in the toxicological panorama, we have studied, in ‘chapter 5’, its interactions and cross-talks with two other toxicity pathways here presented: AhR and ATF4.
o Aryl hydrocarbon Receptor Pathway - AhR
AhR is a ligand-activated TF that controls the transcription of a wide range of genes involved in the synthesis of certain key xenobiotic- and drug-metabolizing enzymes mainly belonging to the CYP family genes, (e.g., CYP1A1, CYP1B1 and CYP1A2 etc.) implicated in the metabolism of endogenous and exogenous substrates. Like Nrf2, AhR is a cytoplasm-based molecule trapped in a complex (Petrulis and Perdew, 2002). Upon ligand (xenobiotic) binding, the AhR TF shuttles into the nucleus where it dimerizes with the ‘AhR nuclear translocator’ (ARNT) and binds to so-called xenobiotic-responsive elements (i.e., ‘dioxin response element’ (DRE)) in the promoter region of some oxidative stress related genes to stimulate their expression (Haarmann-Stemmann et al., 2012).
44 o Activating Transcription Factor 4 Pathway – ATF4
ATF4 is another protein and TF involved in the regulation of an Nrf2 target, the ‘heme oxygenase’ gene, linked to the adaptive response to oxidative stress (He et al., 2001). ATF4 is a major branch of the unfolded protein response and is activated in response to endoplasmic reticulum (ER) disturbances or proteotoxicity where unfolded proteins accumulate in the ER and compete with an important sensing protein named ‘RNA (PKR)-like ER kinase’ (PERK) for the inhibitory protein BiP (Hetz, 2012). Activated PERK phosphorylates the eIF2α (eukaryotic translation initiation factor 2 α) which inhibits general protein translation while inducing AT4 translation. ATF4 in turn binds to the CARE consensus sequence and drives transcription of genes involved in amino acid synthesis, amino acid transport and aminoacyl-tRNA synthesis (Jennings et al., 2012).
45
2.2.2 Systems Biology – SB
SB is a discipline that encompasses the relationship between the “science of the whole system” (physiology) and the “science of the individual components” (molecular biology). SB has provided a framework for investigating the interactions between the separate parts of a biological system in order to understand its functioning (Geenen et al., 2012). A typical SB approach combines holism and reductionism. While the reductionist approach would provide detailed information about properties of the small entities of a system under artificial conditions where they are more or less uncoupled, the holistic approach tests these entities as they are embedded in the living system in a more natural and realistic setting. Nevertheless, in the holistic approach, detailed and high quality data is much harder to obtain and analyze (Klipp et al., 2010).
The strength of the SB approach tackles the complexity of biological systems and their dynamic behavior at every relevant organizational level (from molecules, cells and organs through organisms and ecosystems). The interconnection between different cellular processes, such as metabolism and genetic regulation, reflects the importance of the holistic approach introduced by the SB paradigm. Although most cellular components have been studied individually, the behavior of the cell emerges at the network-level and requires an integrative analysis (Machado et al., 2011). Considering all (or most) of the components of a system simultaneously and not separately makes possible the identification and study of new emergent properties of the system. Emergent properties are functional properties not present within the individual components of the system and only arise when system components interact among each other. A common example to illustrate this is the interaction between hydrogen and oxygen to make water: the resulting change in properties is unpredictable if only the individual properties of hydrogen and oxygen are known (Aderem, 2005).
![Figure 5. Plot of enzymatic reaction’s velocity v against substrates concentration [S] in 10 different cases for Hill’s coefficient α gradually increasing from 1 (hyperbolic:](https://thumb-eu.123doks.com/thumbv2/123doknet/14657342.738871/56.892.153.742.126.538/enzymatic-substrates-concentration-different-coefficient-gradually-increasing-hyperbolic.webp)