C
C
h
h
a
a
p
p
i
i
t
t
r
r
e
e
4
4
É
É
v
v
a
a
l
l
u
u
a
a
t
t
i
i
o
o
n
n
d
d
e
e
s
s
r
r
i
i
s
s
q
q
u
u
e
e
s
s
a
a
g
g
r
r
o
o
-
-
e
e
n
n
v
v
i
i
r
r
o
o
n
n
n
n
e
e
m
m
e
e
n
n
t
t
a
a
u
u
x
x
s
s
u
u
r
r
d
d
e
e
g
g
r
r
a
a
n
n
d
d
s
s
e
e
s
s
p
p
a
a
c
c
e
e
s
s
e
e
t
t
r
r
e
e
l
l
a
a
t
t
i
i
o
o
n
n
a
a
v
v
e
e
c
c
l
l
e
e
s
s
b
b
a
a
s
s
s
s
i
i
n
n
s
s
v
v
e
e
r
r
s
s
a
a
n
n
t
t
s
s
é
é
l
l
é
é
m
m
e
e
n
n
t
t
a
a
i
i
r
r
e
e
s
s
Nous abordons dans le Chapitre 4, la question du changement d'organisation spatiale et de la détermination des risques aux échelles de la prise de décision des gestionnaires publics chargés des questions agricoles et environnementales.
Nous présenterons un premier article, accepté pour publication, par la revue "Ecological Indicators". Il traite de l'évaluation des risques de contamination des eaux de surface dans les bassins versants agricoles à différentes échelles sur les Coteaux de Gascogne, en utilisant une modélisation spatiale cognitive que nous avons appelée méthode PHYTOPIXAL. Les données du modèle ne sont plus acquises ici à l'échelle de la parcelle agricole, mais elles proviennent de la classification d'images satellitales (pour déterminer la couverture des sols) ainsi que de la numérisation d'une carte pédologique papier de la CACG, au sein de notre UR ADBX ; de la BD Carthage pour le réseau hydrographique, de l'acquisition du Modèle Numérique de Terrain auprès de l'IGN. Les itinéraires techniques culturaux moyens ont été renseignés à partir d'éléments communiqués par les conseillers agricoles de terrain. L’unité à laquelle sont acquises ces données d’entrée dans le modèle est le pixel (représentant une surface de 30m X 30m). Les pixels sont ensuite agrégés selon différentes échelles spatiales emboitées (BV élémentaire, zone hydrographique, grand BV) qui correspondent à des modalités de gestion différentes.
Nous avons ensuite utilisé la précision du paramétrage du modèle multicritère ELECTRE TRI-C sur le petit BVE d'Auradé et notamment la pondération des critères, pour améliorer le modèle spatial PHYTOPIXAL mis en œuvre dans le grand bassin versant de la Save, englobant le BVE d'Auradé.
Ces travaux ont été publiés dans la Revue "International Journal of Geomatics and Spatial Analysis". Ils avaient été présentés et discutés aux 74èmes Journées du Groupe Européen de Travail en "Aide Multicritère à la Décision" à Yverdon les Bains en Suisse, en octobre 2011.
4
4
.1
.
1
É
Év
va
al
lu
ua
at
ti
io
on
n
de
d
es
s
ri
r
is
sq
qu
ue
es
s
d
de
e
c
c
on
o
nt
ta
am
mi
in
na
at
ti
io
on
n
de
d
es
s
ea
e
au
ux
x
d
de
e
s
su
ur
rf
fa
ac
ce
e
p
pa
ar
r
le
l
e
s
s
p
pr
ro
od
du
ui
it
ts
s
p
ph
hy
yt
to
os
sa
an
ni
it
ta
ai
ir
re
es
s
s
su
ur
r
u
un
n
g
gr
ra
an
nd
d
t
te
er
rr
ri
it
to
oi
ir
re
e
Les travaux relatifs à ce sujet ont été menés dans le cadre des projets interrégionaux "IMAQUE" (Impact des activités agricoles sur les transferts de matière et de polluants et sur la qualité des eaux, des sols, des sédiments et des milieux aquatiques sur les Coteaux de Gascogne) en 2004-2006, et "INSOLEVIE" (Risques environnementaux liés aux pollutions agricoles et qualité physico-chimique et biologique des cours d’eau. Modélisation de l’impact de ces pollutions. Performance environnementale des activités agricoles) en 2006-2009.
Les objectifs des deux projets étaient de caractériser les états de surface, l’occupation des sols, les pratiques agricoles et les dispositifs agro-environnementaux sur les bassins versants étudiés (Sud Est du Gers , zone des Coteaux de Gascogne) et de déterminer leurs impacts sur les niveaux de concentrations, l’intensité des flux, l’intensité de l’érosion mécanique et chimique et de modéliser les dynamiques de transfert des matières azotées et phytosanitaires depuis les sols où elles sont épandues jusqu’aux ruisseaux et aux rivières vers lesquels elles sont exportées.
Notre question de recherche principale (UR ADBX) portait sur la représentation spatiale du risque de contamination des cours d’eau par les matières azotées et phytosanitaires d’origine agricole, à différentes échelles spatiales. Ces démarches ont fait l’objet de mémoires de fin d’études d'agronomes et de géographes (Lucas, 2004 ; Riglos, 2005 ; Lavie, 2005 ; Balestrat, 2006 ; Blasquez,
2008 ; Boussetta, 2009) et de présentation à plusieurs colloques
Ces travaux sont valorisés dans l'article scientifique, accepté en publication le 03 septembre 2013, sous les références :
Macary, F., Morin, S., Probst, J-L., Saudubray, F. (2014) A Amumullttii--ssccaallee memetthhoodd toto asassseessss pepessttiicciiddee c
coonnttaammiinnaattiioon n rriisskkss iinn aaggrriiccuullttuurraall wwaatteerrsshheeddss -Ecological Indicators-Vol.36, pp.624–639.
Ce papier présente une méthode multi-échelles pour évaluer les risques de contamination des produits phytosanitaires dans les basins versants agricoles
Résumé : La protection de l'eau est désormais une priorité majeure pour les gestionnaires de
l'environnement, en particulier pour les stations de pompage des eaux destinées à la potabilité. Compte tenu de ces nouveaux défis pour les agences de l'eau, ayant pour mission de préserver les ressources en eau, nous avons développé une méthode conçue pour aider à la prise de décision des politiques publiques, à différentes échelles spatiales. Dans cet article, nous présentons cette nouvelle méthode spatiale cognitive, visant à déterminer le risque de contamination des eaux due aux intrants agricoles, tels que les produits phytosanitaires. L'originalité de cette méthode réside dans l'utilisation d'un objet spatial très détaillé, l'OSR (Objet Spatial de Référence), qui peut être agrégé pour de nombreuses échelles de travail et de gestion. Ceci a été réalisé grâce à précision de la taille du pixel d'images satellitales, avec une résolution de grille de 30 x 30m dans notre application.
La méthode - appelée PHYTOPIXAL - est basée sur une modélisation spatiale d'indicateurs relatifs à la vulnérabilité environnementale des eaux de surface (pente, type de sol et la distance du cours d'eau) et à la pression des activités agricoles (utilisation des terres et les pratiques des agriculteurs). Les notations utilisées pour paramétrer le modèle spatial ont été mises en œuvre selon la connaissance de la littérature et des experts. La combinaison de ces indicateurs pour chaque pixel fournit les risques de contamination.
Cette méthode est utilisée pour cibler les risques spécifiques de transfert des intrants agricoles. Les valeurs de risque sont d'abord calculées pour chaque pixel. Après ce premier calcul, les données résultantes sont ensuite agrégées, en fonction des niveaux d'organisation les plus appropriés pour les gestionnaires. Ces données sont basées sur des valeurs moyennes établies par rapport à la surface des bassins versants.
Dans cet article, nous détaillons une application de la méthode à une zone d'étude dans les Coteaux de Gascogne sur un espace couvrant 7000 km2. Nous montrons le risque de contamination par les produits phytosanitaires dans des bassins versants de tailles différentes : de 2 km2 à plus de 1000 km2 (le BV de la Save couvre 1150km2), dans lesquels l'eau des cours d'eau est pompée pour la consommation par les humains et les animaux. Les résultats ont été récemment utilisés par l'agence régionale de l'eau pour déterminer le zonage de protection de la zone d'alimentation d'une station de pompage. Les mesures ont ensuite été proposées aux agriculteurs en vue d'améliorer leurs pratiques. La méthode peut être extrapolée à d'autres régions différentes afin préserver ou de restaurer la qualité des eaux de surface.
Mots clés : agriculture ; SIG ; télédétection ; produits phytosanitaires ; PHYTOPIXAL ; changement
A
A
m
m
u
u
l
l
t
t
i
i
s
s
c
c
a
a
l
l
e
e
m
m
e
e
t
t
h
h
o
o
d
d
t
t
o
o
a
a
s
s
s
s
e
e
s
s
s
s
p
p
e
e
s
s
t
t
i
i
c
c
i
i
d
d
e
e
c
c
o
o
n
n
t
t
a
a
m
m
i
i
n
n
a
a
t
t
i
i
o
o
n
n
r
r
i
i
s
s
k
k
s
s
i
i
n
n
a
a
g
g
r
r
i
i
c
c
u
u
l
l
t
t
u
u
r
r
a
a
l
l
w
w
a
a
t
t
e
e
r
r
s
s
h
h
e
e
d
d
s
s
Francis Macary*
Irstea, ADBX Unit
50 avenue de Verdun-Gazinet, F33620 Cestas-Gazinet, France E-mail: francis.macary@irstea.fr
*Corresponding author
Soizic Morin
Irstea, REBX Unit
50 avenue de Verdun-Gazinet, F33620 Cestas-Gazinet, France E-mail: soizic.morin@irstea.fr
Jean-Luc Probst
Laboratoire Ecologie Fonctionnelle et Environnement (EcoLab), Université de Toulouse, INPT, UPS, ENSAT, Avenue de l’Agrobiopôle, 31326 Castanet-Tolosan, France and CNRS, EcoLab, F31326 Castanet-Tolosan, France E-mail: jean-luc.probst@ensat.fr Frédéric Saudubray
Irstea, ADBX Unit
50 avenue de Verdun-Gazinet, F33620 Cestas-Gazinet, France E-mail: frederic.saudubray@irstea.fr
Highlights:
- We implemented a spatial cognitive model to assess surface water contamination risk - The model is built with a GIS at pixel level of remote sensing
- Variables are slope, soil type, distance to the stream and agricultural pressure - A map is obtained for each variable which is considered as an indicator
- Pixels used as Reference Spatial Object can be aggregated to many managing scales
Abstract: The protection of water is now a major priority for environmental managers, especially around drinking pumping stations. In view of the new challenges facing water agencies, we developed a method designed to support their public policy decision-making, at a variety of different spatial scales. In this paper, we present this new spatial method, using remote sensing and a GIS, designed to determine the contamination risk due to agricultural inputs, such as pesticides. The originality of this method lies in the use of a very detailed spatial object, the RSO (Reference Spatial Object), which can be aggregated to many working and managing scales. This has been achieved thanks to the pixel size of the remote sensing, with a grid resolution of 30 x 30 m in our application.
The method - called PHYTOPIXAL - is based on a combination of indicators relating to the environmental vulnerability of the surface water environment (slope, soil type and distance to the stream) and the agricultural pressure (land use and practices of the farmers). The combination of these indicators for each pixel provides the contamination risk. The scoring of variables was implemented according knowledge in literature and of experts.
This method is used to target specific agricultural input transfer risks. The risk values are first calculated for each pixel. After this initial calculation, the data are then aggregated for decision makers, according to the most suitable levels of organisation. These data are based on an average value for the watershed areas. In this paper we detail an application of the method to an area in the hills of Southwest France. We show the pesticide contamination risk by in areas with different sized watersheds, ranging from 2 km2 to 7,000 km2, in which stream water is collected for consumption by humans and animals. The results were recently used by the regional water agency to determine the protection zoning for a large pumping station. Measures were then proposed to farmers with a view to improving their practices. The method can be extrapolated to different other areas to preserve or restore the surface water quality.
Key words: Agriculture; GIS; Remote sensing; Pesticides; PHYTOPIXAL; Space scaling; Water
contamination risk.
__________________________________________________________________________________
4
4
.
.
1
1
.
.
1
1
I
I
n
n
t
t
r
r
o
o
d
d
u
u
c
c
t
t
i
i
o
o
n
n
For several decades, powerful agricultural pressures on environments of varying vulnerability have led to the contamination of water bodies by a range of different pollutants: fertilisers, primarily nitrogen (Henin, 1994; Schröder et al., 2004; Perrin et al., 2008) and pesticides (Van der Werf, 1996;
Barriuso, 2004) are among the best known. At the same time, society is demanding an ever more
stringent protection of the environment. In response to this, public authorities have implemented numerous regulatory and incentive measures, some of which directly concern agricultural activities (CEE, 1991a; 1991b; 1998).
In 1992, the European Economic Community implemented the first major reform of the European Agricultural Policy (Deneux and Emorine, 1998; Weyerbrock, 1998). The aim was to decrease the agricultural budget of ECC with a limitation of productions, and to increase the environmental protection (surface waters, groundwater, soils, and biodiversity). This new policy led to agri-environmental measures, with subsidies for farmers who decided to adopt environmental protection measures. The year 2000 saw the arrival of the European Framework Directive on Water, which requires all bodies of water to be in a good ecological condition by 2015. The Directive set out chemical and biological norms to be achieved by EU states (EC, 2000).
Different assessments of these policies indicate that the sustainability of water management in rural areas can be improved. Access to decision-making tools at different spatial scales will allow a better analysis of risks, and help in the selection of those zones where certain measures should be prioritized. Changes in agricultural practices tend to take place at farm and land parcel level. This intermediate scale (small area) is useful for the implementation of actions by local groups (farmers within the same small watershed, local fishing associations, etc.). On the contrary, it is at the scale of water agency hydrological areas that different measures for water protection are defined. For instance, French policy makers recently decided to protect pumping zones for surface water by creating territorial action plans (TAP). A TAP includes measures in which participants (principally farmers, but also municipalities and inhabitants) are required to reduce the contaminants transferred into surface water. Some TAPs are concerned with the extension of culture successions on the same parcel of land (four or five different cultures, before returning to the first), reducing doses of fertilizers and pesticides, adoption of intermediate crops in winter bank protection, the Best Management Practices for tillage, etc. Some good environmental practices, like the introduction of vegetative filter strips along streams, can also be made more effective by the development of riparian zones, when possible. In these cases, managers give subsidies to farmers, and therefore need accurate information about potential risk zoning before drawing up their TAP.
Up until now, agri-environmental indicators and hydrological models used to assess the condition of water resources and the potential for contamination by pollutants (cf.4.1.2.1), have only provided information at a single spatial level. These basic indicators were usually applied at the agricultural parcel scale and - more rarely - at the watershed level especially those of large dimension, where there are implications for environmental management (Devillers, et al. 2005). These models cannot be applied to other scales, because data for the indicators are generally calculated at the parcel level. This kind of models tends to be applicable to best management practices in farming. However, for public managers and water agencies, the implementation of agri-environmental policies requires decision-making tools for larger scales (river basin, region, etc…) (Gardi, 2001).
To achieve this, the variables, geographical objects and basic indicators used, must be adapted to the transfer of spatial scales. In terms of definitions, we consider that the vulnerability of an environment (surface water for instance) represents the likelihood that it will be affected by pollutants. On the other hand, the sensitivity of the environment allows us to evaluate how this environment may respond to contamination. The key environmental issues concern the conservation, preservation and rehabilitation of the various uses of a water resource. Indeed, different uses of aquatic environments may be affected by occasional and diffuse pollutions: abstractions for drinking water supplies, water resources for irrigation and recreational uses (fishing and bathing). The risk arises from the combination of these environmental issues, the vulnerability of aquatic environments and the different pressures being experienced.
The vulnerability of an environment plays an important role in the quality of surface water used by humans and animals. Pollution observed in rural watersheds mainly originates from agricultural inputs (pesticides, nitrogen fertilizers). Environmental risk assessment depends on the level of observation by the people involved and thus can be carried out at different spatial scales, according to the issue being considered: e.g. decision-making scales, agricultural practices or water contamination. Thus, a risk (CORPEN, 2003) allows an estimation of the possibility of changes to specific uses, such as the quality of water for consumption.
These different spatial entities may be superimposed and fitted together: nested watersheds when each entity is contained in another larger entity (a "Russian doll" approach), or become embedded, when only a part of the territory or spatial entity is included in another territory or entity. Particularly for agricultural management entities, e.g. farming parcels, farms and operational infrastructures, the same types of spatial entities very often fit together. The problem of scale changes associated with agri-environmental risks is now a recurrent topic in sustainable development discussions; it is both a research concern and a prerequisite for supporting stakeholders in decision-making. Unlike hydrological models, we do not consider the assessment of
contaminant flux, which need a resolution of complex equations, but a discrimination of risk areas by a suitable method for water and environmental managers.
The aim of this paper is to present a new spatialised method, for assessing the contamination risk of surface waters by agricultural pesticide over interconnected areas of different sizes in different countries, implemented by combining different indicators. Our main objective is to provide a spatialised method using a GIS, which must be precise enough to obtain efficient results, and also to be suitable for environmental managers and stakeholders in their decision making.
After a review of the different methods used for assessing water contamination risks, and for changing spatial organisational levels, we will explain the structure of the method that we developed
(§ 4.2.2.2). We will then detail the test application, carried out in southwest France, where we used
our method to determine pesticide contamination risks for surface water destined for human and animal consumption.
4
4
.
.
1
1
.
.
2
2
C
C
o
o
n
n
s
s
i
i
d
d
e
e
r
r
i
i
n
n
g
g
l
l
e
e
v
v
e
e
l
l
s
s
o
o
f
f
s
s
p
p
a
a
t
t
i
i
a
a
l
l
o
o
r
r
g
g
a
a
n
n
i
i
s
s
a
a
t
t
i
i
o
o
n
n
a
a
l
l
i
i
n
n
r
r
i
i
s
s
k
k
a
a
s
s
s
s
e
e
s
s
s
s
m
m
e
e
n
n
t
t
:
:
a
a
r
r
e
e
v
v
i
i
e
e
w
w
4
4.
.1
1.
.2
2.
.1
1
M
M
o
o
d
d
e
e
l
l
s
s
a
a
n
n
d
d
i
i
n
n
d
d
i
i
c
c
a
a
t
t
o
o
r
r
s
s
u
u
s
s
e
e
d
d
f
f
o
o
r
r
c
c
h
h
a
a
r
r
a
a
c
c
t
t
e
e
r
r
i
i
z
z
i
i
n
n
g
g
w
w
a
a
t
t
e
e
r
r
c
c
o
o
n
n
t
t
a
a
m
m
i
i
n
n
a
a
t
t
i
i
o
o
n
n
r
r
i
i
s
s
k
k
s
s
Bio-physical models and agri-environmental indicators are generally used for assessing the contamination risk to water in watersheds (Tong and Chen, 2002). However, these approaches are specific to a single observation scale and they cannot be directly transferred to other scales. Bio-physical models evaluate the influence of a factor and its modalities on the pollutants fluxes observed at the outlet of a river basin. Scenario testing is frequently used to provide answers in studies of complex phenomena. These models provide useful results for the estimation of pollutants flows, e.g. the EPIC model (Erosion Productivity Impact Calculator) (Williams, 1990), SWAT model (Soil & Water Assessment Tool) (Arnold et al., 1998), STICKS model (Brisson et al., 1998) and TNT2 model (Topography-based Nitrogen Transfers and Transformations) (Beaujouan et al., 2002).Wohlfahrt et al. (2010) implemented the MHYDAS model (distributed hydrological model for
agrosystems) to carry out risk assessments for diffuse pollution in diagnostics as well as test-mitigation strategies in a small watershed. Ferrant et al. (2011) have recently developed the SWAT and TNT2 models for measuring nitrogen fluxes in South-West France. Boithias et al. (2011) and
Lescot et al. (2012) used the SWAT model to assess pesticides fluxes in the same area. Lim and Engel (2003) refined the NAPRA (National Agricultural Pesticide Risk Analysis) model in the USA. Other
models are currently under development for the same or similar purposes (Gascuel-Audoux et al.,
2009). These combine agronomical-hydrological models (which take into account agricultural
practices at relevant spatio-temporal scales), the interaction with the physical environment, and the climate (Vazquez-Amabile et al., 2008). However, it is often difficult to set parameters and recover required data. Consequently, these models are more useful as way of helping researchers to better understand physical processes than as a decision-making support tool for managers of public services.
Agri-environmental indicators are based on descriptive parameters that summarise the complexity of situations or processes (Bockstaller et al., 1997). They are used to monitor and assess the impacts of agriculture on the environment (Buczko and Kuchenbuch 2010). Most of them are built at the "farming parcel" level (Devillers et al., 2004), for example ADSCOR (Additive Scoring), EIQ (Environmental Impact Quotient), EPRIP (Environmental Potential Risk Indicator for Pesticides), GUS (Groundwater Ubiquity Score), I-Phy (Indicateur Phytosanitaire), PEI (Pesticide Environmental Index), or the Phosphorus Index (Bechmann et al., 2005), though some can be used at the ‘farm’ level: GUS, PEI, RMI (Risk Management Indicator). By combining these indicators with geographical information systems (GIS) - normally at the small watershed scale - it is possible to establish environmental risk zones for sensitive environments. GIS have been commonly used since the 1990s to determine the relationships between agricultural activities, including land use and water quality at the watershed scale (Srinivasan and Arnold, 1994; Xinhao and Yin, 1997; Spinall and Pearson, 2000). They thus represent a decision-making support tool for the choice of measures to be implemented by managers of public services (Schröder et al., 2004, Alkan Olsson et al., 2009). Additionally, some indicators assess agricultural landscapes for water quality protection (Gascuel-Odoux et al., 2009). However, all of these indicators are built at a certain spatial organisational level and do not allow for changing of spatial scales. Hence, they generally cannot address the questions of environmental managers.
4
4.
.1
1.
.2
2.
.2
2
M
M
e
e
t
t
h
h
o
o
d
d
s
s
f
f
o
o
r
r
c
c
h
h
a
a
n
n
g
g
i
i
n
n
g
g
s
s
p
p
a
a
t
t
i
i
a
a
l
l
o
o
r
r
g
g
a
a
n
n
i
i
s
s
a
a
t
t
i
i
o
o
n
n
a
a
l
l
l
l
e
e
v
v
e
e
l
l
s
s
Scale refers to the spatial dimensions at which entities, elements and processes can be observed and characterised (Dumanski et al., 1998). This conceptual space relates to study compartments and three levels are traditionally included: the global scale, the intermediate scale and the local scale.
T
T
Thheeiinntteerrmmeeddiiaatteeoorr““rreeggiioonnaall””ssccaallee corresponds to the regional engineering scale in particular, and allows the analysis of interactions between mankind and the environment. This scale takes into account the characteristic values relating to different processes, the geomophological and hydrological organisation of areas at their best level of consistency (e.g. a watershed) and the level of anthropogenic activities. Therefore, agri-environmental issues are generally situated at this intermediate scale which varies from a few square kilometers to several thousand. This explains why different methods can be used.
T
Thheellooccaallssccaalle concerns the processes themselves; these may be biological, such as plant growth, e or physico-chemical, such as riverine transports of solute and particulate elements. The spatial scale transmits the idea of continuity. In contrast, a spatial organisation level (SOL) corresponds to a spatial entity and the characteristic values of a process or of a phenomenon. This notion of organisational levels can simultaneously take into account the handling of ecological, agricultural and administrative processes. Four types of spatial organisational levels can be identified in the agri-environmental field:
- The level of eco-hydrological organisation (watershed, landscape unit);
- The level of socio-economic organisation: agricultural activity (farming parcel, farm, operational infrastructure);
- The local territory organisation with a collective identity (towns and other urban areas)
- The politico-administrative organisation or decision-making level for environmental managers (hydrographic area or basin, region).
In this paper, we will look at the eco-hydrological and politico-administrative organisation, as this is the level at which contamination risk assessment must be developed to aid environmental managers in their decision making.
a) Relationships between data sources and spatial scales
The relationships and interconnections between spatial entities without common geographical boundaries are sources of complexity in agri-environmental approaches (Dumanski et al., 1998,
Dalgaard et al., 2003). For example, statistical data derived from the French agricultural census
(Recensement Agricole) cannot be superimposed over a hydrographic division. Specific sources of data (parcel surveys and farm surveys in addition to site, hydrological, statistical and remote sensing surveys) are obtained at distinct observation scales (Bock et al. 2005).
The same applies to different environmental diagnosis methods (parcel reports, specific farm reports, indicators, spatial analyses, models). Rather than remaining at a given level, a change of scale is the process of changing from one organisational level to the next. To do so, the variations in operation, schematisation, descriptors and the possible links between the consecutive levels must be specified (Puech, Dartus et al., 2003). The development of GIS has facilitated the processing of these multi-source and multi-scalar databases (Balram, 2009). The key aim is to have access to relevant information at the different spatial scales, while processing data which can aid decision-making for the managers of rural areas. Relationships exist between the study scales, data, methods used, the expected results and the data acquisition modes (Cotter et al., 2003; Dixon and Earls, 2009).
b) Reference Spatial Object
The complex interaction between the spatial organisational level (established by the decision-making level) and the spatial heterogeneity (to be measured or represented) is a major difficulty in the agri-environmental field and especially in hydrology. This difficulty is magnified if spatial heterogeneities need to be evaluated at multiple scales of decision-making. Wood et al. (1988) proposed the "representative elementary area” REA concept, or Reference Spatial Object (RSO), which takes into account that a phenomenon being studied corresponds to a working area with an associated scale. When there is a good match, the modelling or explanation of a phenomenon is both better and easier to understand. This method is proposed for defining the size of a watershed that is adapted to hydrological studies.
A Reference Spatial Object or discrimination unit can then be associated with each of these scales. The choice of an RSO is the result of a compromise between its appropriateness at the scale in question (optimal resolution), and its ability to accurately define the problems of diffuse pollution.
Changing from one scale to another causes major problems. For example, this occurs when the observations of agricultural pollution on basic parcels are related to the measurements of pollutant products at the outlets of major watersheds (Puech et al., 2003). This problem may be accentuated if we consider the temporal dimension (difficulty of comparing indicators of pressure and indicators of condition due to the retention and salting out of molecules which may persist over several decades).
One way to resolve the problem of scale changing is to include several organisational levels when creating an indicator (Bock et al., 2005). Indicators constitute an important element in the change from one scale to another and are becoming increasingly widespread in the handling of agri-environmental issues (Stein et al., 2001; Riley, 2001). They may have a single or multiple component(s). Riley (2001) emphasises the fact that in the agricultural and natural resource sector, the creation of a component indicator is the dominant approach. In contrast to the single-component indicator, multi-single-component indicators (Van Cauwenbergh et al., 2007) may be coefficients of variation or a complex function of these different components (Riley, 2001).
c) Methods for changing spatial scales
Different methods can be used according each context. S
Sppeecciiffiicciinnddiiccaattoorrssffoorreeaacchhssccaallee
The level of spatial organisation being studied determines the methods that have to be used. For each situation (Figure 4-01), the response to the question of scale change is provided by a change of data and, consequently, of the environmental indicators specific to each spatial level (Riley, 2001,
Stein et al., 2001). This is the main type of study carried out to date by the different authors.
Indicators are built at different levels: parcels of land, farms, watersheds, and administrative territories.
A
Aggggrreeggaattiivveeaannddddiissaaggggrreeggaattiivveeaapppprrooaacchheess
The description of phenomena within a spatial object often requires working at the previous or following organisational level. Aggregative and disaggregative methods often originate from these inter-scale approaches (Blöschl and Sivapalan, 1995).
Disaggregation is used to determine the behaviour of constituent components based on the behaviour of the whole entity (Riiters, 2005). Blöschl and Sivapalan (1995) describe disaggregation as being the transition from a “mean value” in a particular field to its detailed distribution within a section of this field.
Aggregation is used to make the transition from the constitutive components to the whole entity. However, in this case, the transposition of the processes identified at one scale offers no guarantees of validity at another scale. Furthermore, another difficulty relates to the interaction between several processes. While the representation of a single process may be envisaged, the inclusion of multiple processes is more complex. Aggregation follows the same logic as an indicator which condenses raw information into synthetic information.
•
Method of direct aggregation at each RSO observedThe first method consists of aggregating the elementary data at each RSO observed. For example, with agri-environmental information, scores qualifying simple indicators allocated to each parcel of land can be combined at the scale observed (each watershed level). This form of aggregation can be used to take into account different physical processes at the scales considered. The main disadvantage of this approach is the potential loss of information due to premature aggregation. The best solution for keeping as much of the information as possible is to choose a small RSO, calculate the indicators at this scale, and ultimately achieve aggregation at the organisation level selected by managers and actors. Some authors have previously used this kind of aggregation, through a GIS process, of simulation units, assessed by the agro-hydrological model SWAP (soil-water-atmosphere-plant), for up scaling of water productivity, from fields to regions (Wesseling and
Feddes, 2006).
•
Choice of a common element for the division of space at each scale (Aggregation anddisaggregation)
Another method considers a common RSO at the different scales for environmental managers and local participants. The adoption of the unit at the smallest possible resolution allows for the conservation of the most detailed information, regardless of the scale that is used, thus avoiding the premature aggregation of information.
Each element is associated with the value calculated, based on the information relating to the simple indicators. The aggregation, according to an arithmetical or statistical process, is then exclusively based on these elements for each of the scales determined in order to allow for the reading and interpretation of the results. The accuracy of this spatialised method varies according to the level of spatial organisation. It is all the more important when there is a small area, given the available data and their details. This means that it is possible to supplement the information according to the data available at each organisational level.
Dalgaard et al. (2003) distinguished three aggregation procedures: the linear procedure, the
non-linear procedure and the "hierarchical” procedure. The latter makes it easier to overcome the difficulties of interactions between processes. The linear aggregation procedure is the most commonly known. It consists of the sum of its parts. In the non-linear aggregation procedure, the variable taken into account, can take different values, according to several thresholds. The aggregation must take into account the intrinsic characteristics of the fundamental units. The hierarchical procedure takes into account the intrinsic characteristics of each element of the system and also the relationships between these elements.
Disaggregative approaches depend largely on the data set available. The general method for the disaggregation of information is spatial interpolation. This method relies on tools directly characterizing the form of spatial organization and includes a large number of techniques. Some indicators are used to measure the shape of a spatial distribution. Here, the autocorrelation indices are the more traditional. Other methods of geostatistics use space in a more local way, such as variograms. These can identify breaks in the distribution of data or interpolation techniques and kriging (Ernoult et al., 2003).
•
Other aggregation processes, with multi-criteria approachesMethods called Multi-Criteria Decision Aiding (MCDA) methods, or Multi-Criteria Decision Analysis methods, were developed in the 1970’s (Roy, 1990).They have been used in several domains (Schärlig, 1996). Since the early 1980s, they have been tested with success in the field of environmental management issues (Simos, 1990). In most cases, the criteria aggregation process was based on a system of outranking (Maystre et al. 1994). Later, the MCDA was coupled with GIS, due to the spatial nature of environmental issues.
Malczewski (1999; 2006) carried out an important survey of literature with regard to GIS
combined with MCDA and their many applications. Two main trends were developed. The first involved combining GIS software with MCDA methods, which makes best use of the performance of each system. Although very precise, this method involves many implementations between the two processes. Then, when these methods were applied on large territories, an integrated coupling with GIS software was developed, by addition in the GIS of a Multi-Criteria Evaluation (MCE) function (Eastman, 2001, 2003). The MCE take into account a fuzzy logic, and a criteria weighting (Saaty, 1990), like in classical methods: by this way, the GIS becomes GAS (Geographic Analysis System). Clark labs of Clark University in USA developed the IDRISI software (Eastman et al., 1993). It was used in many environmental applications, like an assessment of land use in a large region (Paegelow and
Camacho-Olmedo, 2005; 2008).
4
4
.
.
1
1
.
.
3
3
M
M
a
a
t
t
e
e
r
r
i
i
a
a
l
l
s
s
a
a
n
n
d
d
m
m
e
e
t
t
h
h
o
o
d
d
s
s
4
4.
.1
1.
.3
3.
.1
1
S
S
t
t
u
u
d
d
y
y
a
a
r
r
e
e
a
a
a
a
n
n
d
d
d
d
e
e
v
v
e
e
l
l
o
o
p
p
m
m
e
e
n
n
t
t
c
c
o
o
n
n
t
t
e
e
x
x
t
t
o
o
f
f
t
t
h
h
e
e
r
r
i
i
s
s
k
k
a
a
s
s
s
s
e
e
s
s
s
s
m
m
e
e
n
n
t
t
m
m
e
e
t
t
h
h
o
o
d
d
In South western France, the Coteaux de Gascogne area is drained by 17 rivers. The five largest rivers in length and flow are from West to East: Baïse, Gers, Arrats, Gimone and Save. They are all left tributaries of the Garonne River, located between the Pyrenees Mountains and the Atlantic Ocean. All these rivers have their source in the Lannemezan plateau, and they are draining. A canal between the Neste River and the sources of these Gascogne rivers was created in the second part of the 19th century to replenish these rivers with water during the dry period. Their watersheds cover several thousands of square kilometers. Over the last two decades (1985-2004), the mean annual rainfall was 691 mm with evapotranspiration of 819 mm. The natural hydrological regime of these rivers is pluvial and the low flow period corresponds to summer (July to September) and the interannual variability of their module is very high (Probst and Tardy, 1985).This geographical area (Figure 4-02) covers 7,000 km2, which justifies the use of satellite images
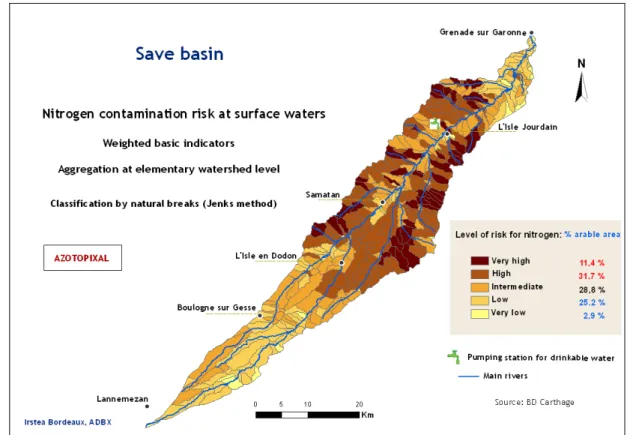
in order to obtain detailed coverage of the land surface. Data from the Corine Land Cover data base are not precise enough to establish potential risks of surface water contamination, as each kind of crop has to be considered, and not only arable lands as a whole. Raw water for consumption by humans and animals is essentially extracted directly from these rivers by pumping stations and this is the main responsibility of water managers (Figure 4-02). Given the problem of relatively limited flows, contamination due to the transfer of fertilisers (mainly nitrogen) and pesticides of agricultural origin is magnified.
F
Fiigguurree 44--0022.. LLooccaattiioonn ooff tthhee ssttuuddyy aarreeaa iinn ssoouutthh--wweesstteerrnn FFrraannccee
The effects of the agri-environmental measures to which farmers subscribed voluntarily after the new European agricultural policy, in 1992 (see introduction) were very limited. Indeed, they were spread very thinly across the region and they made therefore little or no contribution to the required improvement on the pressures and their impacts on surface waters. This has prompted water agency managers, as in the Adour-Garonne river basins, to make special provisions for the protection of watershed areas. For example, the implementation of financial incentives had to be more precisely targeted, and were thus designed with the specific aim of reducing the pollution of river waters. Firstly, limits for the protection of water pumping areas had to be precisely defined, and there was a need to delineate high-risk water areas
This called for the scientific development of a specific method to spatialise surface water risks, easier to use than classical hydrological models and adapted to different spatial scales. In this context, we carried out research into a method of risk determination, at different spatial scales and applicable to other regions in which surface water is exposed to different contaminants.
In this area, we considered nested watersheds as different spatial organisational levels (SOLs). For example, the largest watershed (Save, 1 150 km2) is the result of interconnections of secondary
watersheds drained by tributaries (i.e. Boulouze river basin, 70 km²), which are themselves interconnections of elementary watersheds drained by sub-tributaries (i.e. Montoussé catchment, 6 km²).
F Fiigguurree 44--0033.. EExxaammppllee ooff ddiiffffeerreenntt ssppaattiiaall oorrggaanniissaattiioonnaall lleevveellss iinn tthhee ""CCootteeaauuxxddeeGGaassccooggnnee""
4
4.
.1
1.
.3
3.
.2
2
I
I
m
m
p
p
l
l
e
e
m
m
e
e
n
n
t
t
a
a
t
t
i
i
o
o
n
n
o
o
f
f
a
a
s
s
p
p
a
a
t
t
i
i
a
a
l
l
c
c
o
o
g
g
n
n
i
i
t
t
i
i
v
v
e
e
m
m
e
e
t
t
h
h
o
o
d
d
a a))OOvveerraallllssttrruuccttuurreeoofftthheemmeetthhooddaannddiittssddiiffffeerreennttSSOOLLssOur generic spatialised pixel-based method (called PIXAL method) is based on a combination of spatialised agri-environmental indicators, calculated at the pixel level of remote sensing. The application in this paper focuses on phytosanitary issues, and the method is therefore called PHYTOPIXAL. It takes into account factors of surface water vulnerability and agricultural pressure. In a first step, each factor provides a basis indicator, usable to discuss with stakeholders.
Then, these indicators are combined to obtain risk values, calculated for each pixel (30m x 30m). In a second step, risk values are aggregated to determine risk zones, according to the level of organisation and management chosen by the public management bodies and stakeholders. From these data, the contamination risk of surface waters by pollutants was calculated at different SOLs (Figure 4-03), and expressed from the scale of the small elementary agricultural watershed to that of the large surrounding watershed. The general flowchart of this method appears in Figure 4-04.
b
b))CCrreeaattiioonnooffssuurrffaacceewwaatteerrvvuullnneerraabbiilliittyyiinnddiiccaattoorrss
The factors which contribute to surface water vulnerability are mainly related to the nature of the soil, the geological substratum, the slope, and the connectivity with the body of water in question. Some of these were discarded because they were not relevant for the characterisation of different scales of interest, or did not provide data sufficiently accurate and discriminating in the study area (i.e. geological substratum). The parameters retained were topography, drainage and soil. This information fully satisfies the need to incorporate the change of scale. Data were gathered over
F
Fiigguurree 44--0044.. OOvveerraallll ssttrruuccttuurree ooff tthhee PPHHYYTTOOPPIIXXAALL mmeetthhoodd aanndd iittss ddiiffffeerreenntt ssccaalleess ooff rreessuullttss
All variables were scored (Devillers et al., 2005) prior to the calculation of the indicators. From the range of variation of each factor, classes of values were determined according to previous knowledge (based upon scientific literature, agronomists’ expert opinion, and our experience in this area) regarding their contribution to contamination risks. That explains why we considered this model as a cognitive model (Le Bissonnais et al., 1998). We attributed the highest score where there was the highest level of risk, and identical weighting was used forall scores. Table 4-01 summarizes the scores of the three vulnerability indicators.
S
Sllooppee((SSLL))
Slope is an essential factor in the transfer of pollutants like pesticides (Beaujouan et al., 2002;
Barriuso et al., 2004), influences surface run-off, and has a direct effect on transfer times from soils
to water. Furthermore, it has direct consequences on physical erosion processes and facilitates the transportation of active substances adsorbed onto suspended matters particularly during the flood events (Taghavi et al., 2011). A Digital Elevation Model (DEM) from the National Geographic Institute (IGN) at a resolution of 25 meters was acquired to cover the study area. Extrapolation to a resolution of 30 meters allowed the same spatial resolution as that of a satellite image.
The thresholds were determined according the specific literature about erosion in France (Le Bissonnais et al., 1998). They were manually calculated, based on the frequency histogram of the slope values, at the basic pixel level. As the extreme values were limited in number, we incorporated them into the major classes. Five slope classes adapted for surface runoff to calculate scores for this factor, taking into account the main characteristics of each slope class: <3%; 3 to 7%; 7 to 12%; 12 to 25%; >25%. In this study area, crops are mainly grown in parcels with less than a 12% gradient. Beyond this value, we found mainly grasslands.
In this study, we used scores from 1 to 5 (Table 4-01) corresponding to the previous slopes classes (1 for slopes < 3%, 5 for slopes > 25%). These scores must be adapted to different geographical contexts, in other areas and countries.
T
Taabbllee 44--0011.. SSccoorreess ooff vvuullnneerraabbiilliittyy iinnddiiccaattoorrss
D
Diissttaanncceettoowwaatteerrccoouurrsseess((DD))
The contamination of surface waters by pollutants is highly dependent on the distance between the application site and the relevant body of water. Two parameters were considered when developing the indicator of distance to the drainage network: the exact definition of the active network and the choice of “distance” adopted. The processing of the database for the drainage network consisted first of extracting the permanent drainage sections.
We then divided up the resulting layer, based on the superficial area of the satellite image. We created two buffers, situated at distances of 30 and 100 m around the drainage network in order to obtain three distinct zones (Figure 4-05). The threshold of 30 m was based on the spatial resolution of the pixel. The 100 m threshold was based on local expert opinion, taking into account the very tormented topography in the field, especially in this hilly area: this was a first test of threshold implementation. We allocated a score to each of the zones (Table 4-01) after the merging and rasterisation of the extracted layer. This score simply shows the increased risk with proximity to the network in 3 distance classes: <30 m (score 5); from 30 to 100 m (score 3); >100 m (score 1). These values were assigned to account for the importance of this criterion, regarding other studies (Aurousseau et al., 1998). The context (connectivity) of this region required an adaptation of the scores depending on the spatial scale considered". They can be easily changed according each physical context.
Vulnerability indicators score / pixel Slopes classes > 25 5 [12-25 [ 4 [ 7-12 [ 3 [ 3-7 [ 2 [ 0- 3 [ 1 Soil nature
Rendosols and thin calcosols 4
Thick calcosols 3
Luvisols and cambisols 2
Fluviosols 1
Distance to hydrographic network
> 100 m 5
30 -100 m 3
F
Fiigguurree 44--0055.. DDiissttaannccee ttoo wwaatteerrccoouurrsseess S
Sooiillttyyppeess((SSoo))
Soil characteristics play a highly significant role in the retention time of residues in the upper soil horizon to the stream waters. Humus content and nature of organic-mineral complexes can play very important roles in the retention of molecules. Throughout the Oligocene and Miocene periods, this area of the Coteaux de Gascogne received sandy, clay and calcareous sediments derived from the erosion of the Pyrenees Mountains (Revel and Guiresse 1995). The heterogeneous materials produced a thick detrital formation, called molasse, during the Miocene. From the Quaternary period onwards, the rivers became channelized, cutting broad valleys in the molassic deposits and leaving terraces of coarse alluvial sediments. The substratum of the different watersheds consists of impervious Miocene molassic deposits. A weak erosion has allowed the development of calcic Luvisols on the tertiary substratum and local Rendosols (FAO, 2006) on the hard calcareous sandstone beds. A moderate erosion affected soil calcic Cambisols on hillsides with very gentle slopes (less than 12%). Calcic soils (Calcisols) are dominated by a clay content ranging from 40% to 50% and called locally “Terreforts”: they are largely represented on the hills and because of their impermeability, they greatly contribute to surface runoff. Non-calcic soils (Luvisols) are silty (50-60%) and locally called”Boulbènes” (Revel and Guiresse, 1995).
In this area, 1/50,000 scale maps were drawn by pedologists from the CACG (Compagnie
d’Aménagement des Coteaux de Gascogne) in the 1960s and have since been transposed to
1/80,000. This soil map was digitised for the Save watershed only (Cemagref, 2006), limiting the use of this information to this watershed. It revealed a significant but varying, soil depth in the river Save area, which could influence surface runoff. The soil types were grouped into four main categories, and scored according to their importance with regards to the transfer of pollutants by surface runoff (Table 4-01). This was based on the studies carried out by pedologists (Revel and Guiresse, 1995) and professional technicians belonging to a Regional Action Group against Water Pollution by Pesticide Products (GRAMIP). Soil types are ranked from the lowest to the highest potential surface runoff process below:
-- FFlluuvviioossoollss (“Alluvions”): The proximity to the superficial water table leads to direct transfer towards it and therefore an absence of transformation/degradation in the environment.
--LLuuvviissoolls and s CCaammbbiissoollss (“Boulbènes”): Permeable soils, which facilitate infiltrations, but favour the formation of superficial crusting, which is conducive to surface runoff.
-- TThhiicckk ccaallccoossoollss (“Terrefort épais”), soils > 40 cm: Impermeable, clayey soils; runoff is predominantly hypodermic. These soils are composed of hydromorphic sandy pockets, which slow down the transfer of products to the water table.
--RReennddoossoollss and tthhiinnccaallccoossoolls (“Terrefort mince”), soils < 40 cm: They favour hortonian (surface) s runoff, which occurs when rain intensity exceeds the infiltration capacity of the soil.
c
c))CCoommppoossiittiioonnoofftthheeaaggrriiccuullttuuttaallppeessttiicciiddeepprreessssuurreeiinnddiiccaattoorr L
Laanndduussee
Land use within a watershed influences runoff, hydrological regime, and stream water quality. Land cover by crops can be used to assess the pesticide pressures exerted by agricultural additives. The classification of satellite images constitutes the basic information layer of the method. The Corine Land Cover database is not accurate enough to differentiate the crops on farmland, thus impeding the precise determination of risk levels. Because of this, we carried out a supervised classification from satellite images using Erdas Imagine software
®
. Annual land cover is given by the classification of a series of four Landsat 5 TM satellite images, taken on multiple relevant dates, to characterise each type of plant per season, with the lowest rate of clouds: 0 to 20 max); 2004/12/01; 2005/05/26; 2005/07/13; 2005/08/30. The area of these images covers the Coteaux de Gascogne area, at a spatial resolution of 30 m x 30 m.Classification in supervised mode, i.e. under the direct control of the operator, locates the crops in a sufficiently accurate and exhaustive manner. The samples were grouped into ten categories of major crops that consume agricultural additives: wheat, barley, rapeseed, sunflower, corn, sorghum, peas and beans, soybean, grasslands and fallow. Classification also differentiates other land use: fallow, hardwood, softwood, water, soils and buildings. We applied the maximum likelihood rule to the classification algorithm: each pixel was allocated to the class with the highest mean probability of all of the batches.
T
Thheeaaggrriiccuullttuurraallpprreessssuurreeiinnddiiccaattoorrffoorrppeessttiicciiddeess((AApp))
The level of pesticide pressure exerted by agricultural activities can be derived from land use for the studied year, as each crop can be associated with a mean number of pesticide treatments. Given the large number of pesticide substances and various commercial formulations, we attributed a mean number of treatments to each crop (herbicides, fungicides and insecticides) according to data provided by the French Regional Department for Plant Protection (SRPV). The treatment of seeds, something which remains very localised, was not considered here. Therefore, the pesticide pressure indicator resulted from the crossing of the classified image of land use with the number of pesticide treatments. To easily implement the scores in the GIS, these values were multiplied by two, in order to avoid decimals.
d
d)) DDeetteerrmmiinnaattiioonnoofftthheeccoonnttaammiinnaattiioonnrriisskk((CCRRkk))
We performed a spatial analysis in order to optimise the discrimination of pesticide pressure areas at a regional scale, according to a division into elementary watersheds or hydrographic areas: levels of decision making for managers and stakeholders. The layers of each single indicator were rasterised by defining a common resolution cell size of 30m x 30m. The contamination risk was then obtained by cross-referencing them.
Environmental vulnerability indicators were added with an identical weight for each factor. Based on current knowledge, rising indicator values show an increasing risk. Next, the contamination risk was obtained by multiplying the pressure indicator by the environmental vulnerability indicators (eq. 1). This allows the calculation of a zero risk in areas in which no treatment has been applied.
C
Caallccuullaattiioonnoofftthheeccoonnttaammiinnaattiioonnrriisskkffoorreeaacchhppiixxeell
The following formula was adopted for the spatial cognitive model: C
CRRkk==[[SSLL++DD++SSoo]]xx[[AApp]] (eq. 1) Where: CCRRk = contamination risk for each crop k
S
SL = values for the slope level L D
D = values for the distance from each pixel to the stream S
So = values for the soil type o A
Ap =Agricultural pressure (number of pesticide treatments by crop). p
We used five risk categories, which allowed for greater discrimination at the scale of this region. Analysts and decision makers generally use this number of categories in risk studies. We maintained discretisation according to Jenks method* (Lepinard, 2008) natural thresholds, thus obtaining the most “homogeneous” categories of possible values. The thresholds varied according to the number of discriminated units. The level of contamination risk allocated to a given unit (individual statistic) depended on the performances of the other units. These units are compared, with measurements always performed using the same indicator.
A
Aggggrreeggaattiioonnooffiinnffoorrmmaattiioonnaaccccoorrddiinnggttootthheeiinnvveessttiiggaattiioonnssccaallee
In order to identify priority areas for action, the information obtained may be subsequently aggregated. According to the different solutions described in § 4.1.2.2 c, we chose the pixel or grid of a satellite image as our common RSO (Reference Spatial Object). We aggregated them by using a linear procedure at the different spatial organisational levels, in order to be usable by environmental public managers and stakeholders (farmers and their advisers). To do this, we used spatial statistics tools (Spatial Analyst of ArcGIS software
®
, which does not include MCE function) according to the following formula (eq. 2).C
CRRkkwwaatteerrsshheedd==
Σ
ssccoorreessffoorrppeessttiicciiddeerriisskkiinnppiixxeellss//Σ
ssuurrffaacceeaarreeaaiinnppiixxeells (eq. 2) s This is an area-weighted average of risk values calculated at the chosen scale.4
4
.
.
1
1
.
.
4
4
R
R
e
e
s
s
u
u
l
l
t
t
s
s
4
4.
.1
1.
.4
4.
.1
1
A
A
c
c
o
o
n
n
c
c
e
e
p
p
t
t
u
u
a
a
l
l
m
m
o
o
d
d
e
e
l
l
t
t
o
o
g
g
e
e
n
n
e
e
r
r
a
a
l
l
i
i
z
z
e
e
t
t
h
h
e
e
c
c
o
o
n
n
t
t
a
a
m
m
i
i
n
n
a
a
t
t
i
i
o
o
n
n
r
r
i
i
s
s
k
k
a
a
s
s
s
s
e
e
s
s
s
s
m
m
e
e
n
n
t
t
The method developed here aims at assessing surface water contamination risks, at different organisational levels. It provides valuable information at scales appropriate for environmental managers and stakeholders, in order to support decision making. It is suitable in different areas and countries where the main water transfers are superficial. This method is unapplicable in its present forms, for example in karstic environments. Figure 4-06 shows the conceptual model of the generic PIXAL method.