where35k
iand 37kiare the rate constants of molecules i containing35Cl and37Cl, respectively, in the reacting bond, and12k
iand13kiare the analogous constants for carbon. KIECl) 35 ki 37 ki (1) KIEC) 12 ki 13 ki (2)
There is increasing interest in combined carbon-chlorine
compound-specific isotope analysis (CSIA) to differentiate between
contaminant sources and to assess transformation processes.
However, the significant abundance of polychlorinated
molecules with several heavy chlorine isotopes complicates
the evaluation of chlorine isotope trends. Therefore, the goal of
this study was to develop a conceptual and mathematical
framework that describes the expected chlorine isotope
fractionation patterns during multistep transformation of
chlorinated compounds. Reductive dechlorination of chlorinated
ethenes served as an example. The study demonstrates that
chlorine isotope trends can be simulated by reproducing the
average behavior of light and heavy isotopes or by explicitly
simulating molecules with different numbers of heavy isotopes
(isotopologues). The calculations reveal that initial chlorine
isotope ratios of products equal the isotope ratios of their parent
compounds in the absence of secondary isotope effects,
while steadily increasing during transformation. The slopes in
dual isotope plots are linear for reactant and product during
a one-step reaction. They become nonlinear for products that
are degraded further but converge to characteristic slopes.
Consideration of different scenarios reveals that combined
carbon-chlorine isotope analysis bears high potential to
differentiate between contaminant sources, to elucidate reaction
mechanisms in laboratory studies, and to identify transformation
processes in the field.
Introduction
During transformation of many organic contaminants, significant stable isotope fractionation occurs providing strong evidence for contaminant transformation at the field scale (1-3). When analyzing isotopes of two elements, one may even distinguish reaction mechanisms because the initial transformation step frequently involves different elements.
* Corresponding author phone: 5987393; fax: +31-20-5989940; e-mail: [email protected].
Hence, when plotting isotope ratios of the two elements, the slope varies for different reaction mechanisms as demon-strated for methyl-tert-butyl ether (MTBE) (4-6) and aromatic hydrocarbons (7-9). There is also increasing interest to apply such dual isotope approaches to carbon and chlorine isotopes in chlorinated hydrocarbons (10, 11) because they are prevalent groundwater contaminants and are frequently transformed by multiple reaction mechanisms.
The recent development of new analytical methods (12, 13) has made compound-specific chlorine isotope analysis at typical field concentrations possible. However, because of the high abundance of 37Cl and 35Cl, several isotopologues
(same molecules with different isotopic composition) with multiple chlorine isotopes occur complicating evaluations of chlorine isotope data. Recently, we demonstrated that chlorine isotope evolution of the reactant still follows the Rayleigh equation despite the presence of multiple isoto-pologues (14). However, the isotope ratios of intermediates and daughter products are of interest, too, because their degradation is frequently the bottleneck for complete detoxification, and their isotopic composition can provide insight into reaction mechanisms.
Currently, a fundamental understanding of how chlorine isotope ratios of intermediates evolve is lacking, which makes it difficult to evaluate the potential of a carbon-chlorine dual isotope approach at the field scale. Furthermore, such a framework is indispensable for linking chlorine isotope data from laboratory experiments to reaction mechanisms.
The goal of this study was to develop a conceptual and mathematical framework describing the expected chlorine isotope fractionation patterns during multistep transforma-tion of chlorinated compounds using reductive dechlori-nation of chlorinated ethenes as an example. First, the chlorine isotope evolution of reactant and product during a one-step process is considered, followed by the development of two approaches to simulate chlorine isotope fractionation during multistep processes. A discussion addresses the factors controlling slopes in carbon-chlorine dual isotope plots. Finally, potential applications of the dual isotope approach are explored.
Chlorine
Isotope Trends in One-Step Reactions
In one-step reactions, chlorine isotope trends may be predicted using simple fundamental relationships already known from carbon isotopes. We consider the irreversible reaction of perchloroethylene (PCE) to trichloroethylene (TCE) and make the following simplifying independent assumptions: (i) only one C-Cl bond is involved, (ii) isotope effects in adjacent positions (secondary isotope effects) are negligible, and (iii) TCE and Cl are the only products that do not react further.
Evolution of Carbon and Chlorine Isotope Ratios in PCE and Product Average. Cleavage of a C-Cl bond is associated with primary chlorine and carbon kinetic isotope effects (KIE)
Modeling
Chlorine Isotope Trends during Sequential Transformation of Chlorinated Ethenes
D A N I E L H U N K E L E R
Centre for Hydrogeology, University of Neuchaˆtel, Rue Emile Argand 11, CH-2009 Neuchaˆtel, Switzerland B O R I S M . V A N B R E U K E L E N *
Department of Hydrology and Geo-Environmental Sciences, Faculty of Earth and Life Sciences, VU University Amsterdam, De Boelelaan 1085, NL-1081 HV Amsterdam, The Netherlands
M A R T I N E L S N E R
Institute of Groundwater Ecology, Helmholtz Zentrum Mu¨nchen - National Research Center for Environmental Health, Ingolsta¨dter Landstrasse 1, D-85764 Neuherberg, Germany
Carbon isotope fractionation can be evaluated according to the well-established Rayleigh equation
where R is the carbon isotope ratio (13C/12C) at a given time and R0the initial ratio, f is the fraction of PCE remaining, RC and εCare the isotopic fractionation and enrichment factor, respectively. The two carbon atoms and four chlorine atoms in PCE are chemically equivalent and are, therefore, in intramolecular competition. For carbon, this means that εC derived from the Rayleigh equation is related to the carbon kinetic isotope effect according to (1)
Recent work (14) demonstrates that the Rayleigh equation can also be applied to chlorine isotope fractionation in polychlorinated molecules, and that the chlorine isotopic enrichment factor εClis related to the chlorine kinetic isotope effect in an analogous way. Considering that four Cl atoms are in intramolecular competition we obtain
The evolution of carbon and chlorine isotope ratios of PCE may be illustrated in a numerical example. We assume that the initial PCE isotope values are δ13C
0) δ37Cl0) 0‰ with δ13C ) R/R
Int.Std.- 1, where R and RInt.Std.are the carbon isotope ratios of PCE and international reference standard for carbon, and an analogous definition applies for chlorine isotope values. Taking into account that intrinsic KIE are often masked so that apparent kinetic isotope effects AKIE may be observed (1, 23) and assuming that AKIEC≈ 1.008 and AKIECl≈ 1.008, we calculate εC) 1/2 × (1/≈1.008 - 1) ) -4‰ and εCl) 1/4 × (1/≈ 1.008 - 1) ) -2‰. AKIEC≈ 1.008 was chosen to match simulations of ref 17, whereas AKIECl≈ 1.008 is a typical value for chlorine isotope effects. The evolution of carbon isotope values may now be predicted according to well-established rules (15): (a) The initial δ13C of PCE is 0‰ (Figure 1A). During reaction, it changes to increasingly more positive isotope values. (b) The weighted average δ13C of all instantaneously formed products (here TCE) is always 4‰ more negative compared to the δ13C of PCE. (c) The accumulated product (i.e., the integrated instantaneous product) is initially δ13C
TCE ) -4‰ and gradually increases until, for reasons of isotopic mass balance, δ13C
TCEequals 0‰ when all PCE has been transformed. Analogous rules apply to chlorine isotope values (Figure 1B): (a) δ37Cl of PCE is 0‰ at the beginning and becomes increasingly more positive with εCl) -2‰. (b) The weighted average δ37Cl in all instantaneously formed products (here, TCE and chloride) is always 2‰ more negative than that of PCE. (c) The weighted average of accumulated δ37Cl
productsis -2‰ at the beginning and increases to 0‰ when all PCE has been transformed.
Evolution of Chlorine Isotope Ratios in Reaction Prod-ucts TCE and Cl-. In practical applications it is not the weighted product average that is of interest but the actual chlorine isotope ratio of each respective substance, TCE and Cl-. Isotope ratio curves of such parallel reaction products have the same shape as their weighted average (16) because this trend depends only on εCland the isotope value of the substrate. However, the respective product curves may show a characteristic offset and lie above and below the weighted average because isotope fractionation usually varies between different positions in the substrate molecule that are
R R0 = f(RC-1)) fεC (3) εC) (RC- 1) ) 12 ×
(
1 KIEC - 1)
(4) εCl) (RCl- 1) ) 14 ×(
1 KIECl - 1)
(5)FIGURE 1. (A) Carbon and (B) chlorine isotope ratios in the reaction of PCE to TCE (εC ) -4‰, εCl ) -2‰) and (C)
chlorine isotope ratios in the reaction of TCE to cis-DCE (εCl)
-3‰).
transferred to separate products leading to isotopically sensitive branching.
Predicting evolution of TCE isotope ratios is facilitated by recent work that shows there is no isotopic discrimination between an instantaneously formed, dechlorinated product and the substrate from which it is formed if secondary isotope effects are absent (14)
This relationship reflects the fact that TCE contains chlorine of all those bonds that did not react in the transformation and whose isotope ratio remains, therefore, unchanged compared to the substrate. For the evolution of trichloroethylene isotope ratios, this means that the initial δ37Cl
TCEis the same as that of PCE, i.e., 0‰. Like the weighted average of all products, δ37Cl
TCEincreases by a total of 2‰ () εCl) to a final value of 2‰, reflecting the accumulation of heavy isotopes in its precursor PCE. Chlorine isotope ratios of Cl-, in contrast, reveal the full isotope effect of the reaction because every chlorine atom that ends up as Cl-stems from a reacting bond. Consequently, the instantaneous δ37Cl
chloride is always 8‰ () εCl,rp) more negative than that of PCE so that accumulated δ37Cl
chloridestarts off at -8‰ and increases by a total of 2‰ to a final value of -6‰.
The Case of Trichloroethylene. Enrichment trends analo-gous to Figure 1B can be expected for all molecules with chemically equivalent chlorine atoms. The situation is different with compounds like TCE in which chlorine atoms are not chemically equivalent (Figure 1C). Assuming that only one of the three positions reacts and secondary isotope effects are absent, the following relationships apply: (a) The
(
d37Cld35Cl
)
TCE, instantaneouschlorine isotope ratio of nonreactive positions is always equal to their initial value because no enrichment or depletion of isotopes occurs. (b) In contrast, the isotope ratio at the reactive position increases with εCl,rp) (1/≈ 1.009 - 1) ) -9‰ (this value is chosen equivalent to -8‰ for PCE but adjusted for convenient numbers). (c) The observable TCE chlorine isotope ratio (the average of the three positions) appears to change in good approximation with εCl) 1/3 × (1/≈ 1.009 - 1) ) -3‰ (1, 14). (d) Because cis-dichloroet-hylene (cis-DCE) contains the chlorine isotopes of the non-reactive positions, δ37Cl
cis-DCEis always equal to the initial isotope ratio in these positions. (e) Accumulated chloride (Cl-), in contrast, is initially depleted by -9‰ but increases to more positive values until its final value reaches the initial chlorine isotope ratio in the reactive position (14). The trends in Figure 1C are calculated assuming that both reactive and nonreactive positions of TCE have an initial δ37Cl of 0‰. A more complicated case where cis-DCE and trans-dichloro-ethylene are formed in parallel is treated in the Supporting Information.
Multistep Modeling
These examples show that trends of simple one-step reactions may be readily predicted from fundamental relationships based on the Rayleigh equation. However, such approaches are not sufficient if the reaction product TCE is further transformed such as in sequential biodegradation of chlo-rinated ethenes. To also model chlorine isotope fractionation during such multistep transformations, we find the most fundamental way is to simulate the transient evolution of the isotopologue concentrations explicitly. However, because of the high abundance of 35Cl and 37Cl, the number of isotopologues to be taken into account is large for poly-chlorinated hydrocarbons as illustrated by Figure 2A. There-fore, such explicit modeling is compared to an alternative approach that models the average behavior of light and heavy isotopes as is frequently done for other elements such as carbon (17).
Isotopologue Approach. The isotopologue approach explicitly simulates the transformation rates of isotopologues in a reaction network (Figure 2A). For compounds containing nonreactive positions such as TCE, isotopomers (i.e., com-pounds with the same number of heavy isotopes located at different positions) must also be included, because they react at different rates, depending on where the heavy isotope is located (see example in Figure 1C). Initial isotopologue concentrations can be calculated according to a probability mass function (Supporting Information). To this end, a random or nonselective isotope distribution is assumed, i.e., isotopes do not have preferences for certain positions within the compounds. Also, secondary isotope effects are discarded. Figure 2A shows the isotopologue reaction network for reductive dechlorination of PCE over TCE, cDCE, and VC (vinyl chloride) to ETH (ethene) requiring a total of 20 chlorine isotopologues/isotopomers. Assuming first-order kinetics, the rate pertaining to reaction steps where a light chlorine atom L is split off from the isotopologue j of a compound i, Lrate
ij, is (full arrows in Figure 2A)
L rateij) 35 ki× Cij× ni- Hj ni (7)
where Cijis the concentration of isotopologue j of compound i, niis the number of chlorine isotopes at reactive positions in compound i, and Hjthe number of heavy isotopes in reactive positions in isotopologue j. The last term in the equation takes into account that the probability of cleaving a bond to a light isotope depends on how many light isotopes are present at the reactive positions. Analogously, the rate
FIGURE 2. Chlorine isotopologue (A) and chlorine isotope (B) reaction network for sequential PCE dechlorination. H denote heavy and L light chlorine isotopes, so that, e.g., LLLL stands for C235Cl4, whereas LLHH denotes C235Cl237Cl2. In the isotopologue
scheme (A), either a light (solid arrows) or a heavy (dashed arrows) chlorine isotope splits off in each step. To take into account reactive and nonreactive positions in TCE, we assume only the third chlorine position (in bold) of the TCE isotopomers is reactive. In the isotope scheme (B), at each step the light or heavy isotope increment of chlorine disappearing from the substrate pool partitions between the different reaction products (chlorinated ethene product versus Cl-), according to stoichiometric factors defined in the text: rp, reactive position; nrp, nonreactive position.
Hrate
ijat which a heavy isotope H is split off (dashed arrows in Figure 2A) is
The rate constants are related to each other by eq 1 and to the overall rate constant by
where kiis the overall rate constant of compound i,37Fi,rpis the probability that a heavy isotope is at the reactive position. According to eq 9, the overall rate constant is expected to vary because the isotope ratio and thus37F
i,rpvaries during reaction. However, variations are usually small so that kiand
37F
i,rp are practically constant (Supporting Information). Combining eqs 7-9 with eq 1, we link the rate constants of isotopes present in bonds undergoing reaction to the overall rate constant and H rateij) 37 ki× Cij× Hj ni (8) ki) 37 Fi,rp× 37 ki+ (1 -37 Fi,rp)× 35 ki (9) 35 ki) ki 37 Fi,rp/KIEi+ (1 -37 Fi,rp) (10) 37 ki) ki 37 Fi,rp+ (1 -37 Fi,rp)× KIEi (11)
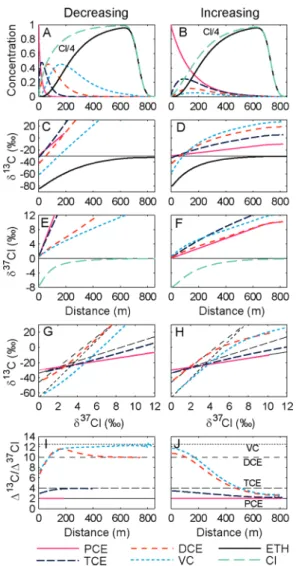
FIGURE 3. Simulated concentrations (A,B), carbon isotope ratios (C,D), and chlorine isotope ratios (E,F) during sequential reductive dechlorination of chlorinated ethenes for decreasing (left; kPCE ) 2/yr, kTCE) 1/yr, kcDCE) 0.5/yr, and kVC ) 0.25/yr)
and increasing (right; kPCE ) 0.25/yr, kTCE) 0.5/yr, kcDCE) 1/yr,
and kVC ) 2/yr) first-order rate constants and similar bulk
isotope enrichment factors (εC,PCE) -4‰, εC,TCE) -12‰ εC,cDCE
) -20‰, εC,VC) -25‰, εCl,PCE ) -2‰, εCl,TCE ) -3‰ εCl,cDCE
) -2‰, and εCl,VC) -2‰). Dual isotope plots for C versus Cl
isotope ratios (G,H) and slopes of the dual isotope plots (I,J). Black dashed lines in the lower four panels indicate slopes expected from eq 21 if PCE, TCE, cDCE, and VC were brought to reaction separately. A constant source term, groundwater velocity of 0.1 m/day, total simulation time of 20 years, and longitudinal dispersivity of 1 m were selected.
The consumption rate of isotopologue j equalsLrate
ij+
Hrate
ij. Likewise, the production rate of a given isotopologue equals the summation of the (negative) consumption rates of its isotopologue precursors. The carbon isotope evolution was simulated analogously. Simulations were performed in PHREEQC-2 (18) as explained in more detail in the Supporting Information.
Isotope Approach. Although heavy and light isotopes of chlorine occur in variable numbers in polychlorinated ethenes, we can nonetheless simulate their average behavior by treating them as separate species (Figure 2B) as implicitly done in the examples in Figure 1. For molecules with reactive and nonreactive positions (e.g., TCE), these positions must be considered separately because only the reactive positions are affected by isotope fractionation and because Cl from reactive and nonreactive positions ends up in different products (Cl- versus dechlorinated compound). Hence,
separate rate constants are attributed to reactive and nonreactive positions. Note that this differentiation is not necessary for carbon isotopes, where the average behavior of all positions can be simulated on the basis of the bulk isotope fractionation factors because all positions are transferred to a single product (17). Assuming first-order kinetics, the average rate at which light and heavy chlorine isotopes at reactive positions of compounds i react is given by
and
LC
i,rpand HCi,rpare the concentrations of light and heavy isotopes, respectively, at the reactive positions in compound i.35k
i,rpand37ki,rpare the average rate constants with which isotopes disappear from these reactive positions, irrespective of whether they actually react and become chloride or whether they move on to the less chlorinated ethene through reaction of an adjacent position. Notably, these rate constants are different from35k
iand37ki, which describe transformation of isotopologues (see above) and correspond to isotopes in reacting bonds rather than in potentially reactive positions. Analogous to eq 9, the rate constants of potentially reactive positions can be related to the overall rate constant by
However, while35k
iand37kiare related by the KIE (eq 1), here the two rate constants are related by the fractionation factor of the reactive position, Ri,rp(see eqs 1 and 14)
For molecules with reactive positions only such as PCE and cis-1,2-DCE, Ri,rpis equivalent to R. Combining eqs 14 and 15, we can calculate rate constants of isotopes present in reactive positions from the overall rate constant
and
Again, kiand 37Fi,rp are in good approximation constants (Supporting Information).
For isotopes at nonreactive positions, secondary isotope effects are neglected, and therefore, no isotope fractionation occurs. In other words,35Cl and37Cl in nonreactive positions move from reactant to product pool with identical rate constants corresponding to the overall rate constant ki
The light and heavy isotopes of the reacting substrate are distributed between the different products. Using DCE as an example, we can describe the reaction of light and heavy isotopes by L ratei,rp) 35 ki,rp (12) H ratei,rp) 37 ki,rp ×L Ci,rp × H Ci,rp (13) ki) 37F i,rp× 37k i,rp+ (1 -37F i,rp)× 35k i,rp (14) R i,rp) 37k i,rp 35 ki,rp (15) 35 ki,rp) ki 37 Fi,rp× Ri,rp+ (1 -37 Fi,rp) (16) 37 ki,rp) ki 37F i,rp+ (1 -37F i,rp)/Ri,rp (17) 37k i,nrp) 35k i,nrp) ki (18) 35 ClDCE98 35k DCE,rp 35 fDCEfVC 35 ClVC+ 35 fDCEfCl 35 ClCl (19)
Normal stoichiometric factors fDCEfVCand fDCEfClwould be equal (at 0.5) because one of the two chlorine atoms ends up in VC and the other in Cl-. In contrast, for isotopic stoichiometric factors, the35f
DCEfCl is slightly larger than 35f
DCEfVC, and in reverse the37fDCEfClslightly smaller than 37f
DCEfVC, reflecting isotope fractionation during cleavage of the C-Cl bond (see the Supporting Information for details). For isotopes at nonreactive positions or if there is only one reactive position (e.g., VC), the stoichiometric factors are 1 (Figure 2B).
Results of Simulations. Simulations of the isotope evolu-tion using both approaches gave perfect agreement. Figure 3 shows the result obtained with either approach for the two scenarios of increasing versus decreasing rate constants. In contrast to carbon, where products are initially depleted in 13C compared to those of the precursors, all products show the same initial chlorine isotope ratio as their parent compound, consistent with eq 6. This agreement is expected to continue for the freshly (instantaneously) formed product throughout the transformation. Nonetheless, the isotope ratio of the precursor and the standing stock of product differ at later stages. For the decreasing rate scenario, each product is depleted in37Cl compared to those of its precursor because freshly formed product mixes with earlier formed product that is isotopically lighter. For the increasing rate scenario, some of the products become enriched compared to those of their precursor because rapid further transformation of the product (compared to its formation) leads to a strong enrichment of37Cl. The lines on a carbon-chlorine dual isotope plot are nonlinear for intermediates except when all rate constants are equal. For the decreasing rate constants, the slopes increase, while for the increasing rate constants they decrease (Figure 3, panels I,J).
Trends in Dual Isotope Slopes
To better understand such changes in dual isotope slopes, we consider the general case of a two-step reaction, for example, DCE f VC f ethene or PCE f TCE f ..., etc. As derived in the Supporting Information, the dual isotope slope of the reactant Q (e.g., DCE) is
whereas the slope of the intermediate I (e.g., VC) is 37 ClDCE98 37k DCE,rp 37 fDCEfVC 37 ClVC+ 37 fDCEfCl 37 ClCl (20) ∆δ13C ∆δ37Cl ) εQ,C× (δ 13 C + 1) εQ,Cl× (δ 37 Cl + 1)≈ εQ,C εQ,Cl (21) ∆δ13C ∆δ37Cl≈ [Q] [I] Q,C 13 Q 13 I kI kQ × [ε + (δ C - δ C )] - × εI,C [Q] [I] × [εQ,Cl+ (δ 37 ClQ- δ 37 ClI)] -kI kQ ≈ [Q] [I] × [δ 13 CI,instantaneous- δ 13 CI] -kI kQ × εI,Cl × εI,C [Q] [I] × [δ 37 ClI,instantaneous- δ 37 ClI] -kI kQ × εI,Cl (22) Here, ∆δ13C and ∆δ37Cl are incremental changes in carbon and chlorine isotope values such as in panels I and J of Figure 3. εQ,C and εQ,Cl are carbon and chlorine isotope enrichment factors for transformation of the reactant Q (e.g, DCE) and kQ is its overall rate constant. Parameters with subscript I denote further reaction of the intermediate I (e.g, VC). [Q] and [I] indicate concentrations, and δ13C
Q and δ13CI carbon isotope values of reactant Q and intermediate I. The last line
of eq 22 uses the fact that εQ,C) (δ13CI,instantaneous- δ13CQ) expresses the isotopic difference between isotope values of reactant and instantaneously formed intermediate (Figure 1A), whereas (δ13C
Q- δ13CI) expresses the difference between reactant and accumulated intermediate. Notation and re-lationships are the same for chlorine isotopes.
Equation 21 illustrates that the dual isotope slope of the original reactant is constant and reproducible because it simply equals the ratio of εQ,Cand εQ,Cl. In contrast, eq 22 demonstrates that the slope of an intermediate is influenced by two terms. (a) The isotopic discrepancy between instan-taneous and accumulated intermediate (here for carbon) is determined by
This term is dominant if the reactant concentration [Q] is high and the standing stock of intermediate small as indicated by the weighing factor [Q]/[I]. (b) The isotope fractionation associated with degradation of the intermediate, -εI. This term is important if the intermediate is more rapidly consumed than formed as indicated by the weighing factor kI/kQ. At the beginning of the reaction, eq 22 can be shown to approach approximately the limit (Supporting Information)
Insight from these equations helps us explain the trends of Figure 3. In both scenarios, slopes start off with values determined by eq 24; they are different because the values of kI/kQ differ between the scenarios. In the scenario of decreasing rate constants, the [Q]/[I] ratios become increas-ingly smaller so that term 2 prevails, and final slopes approach the values for consumption of each intermediate (dashed black lines in Figure 3). In the scenario of increasing rate constants, in contrast, [Q]/[I] ratios remain large during reaction, and in addition, rapid intermediate consumption creates great differences of [δ13C
I,instantaneous- δ13CI]. In this scenario, term 1 therefore dominates toward the end, and final isotope slopes of all intermediates approach the slope of PCE. Such a trend is indeed expected if a reaction cascade approaches steady state, and if the first step in this cascade (i.e., reaction of PCE to TCE) is slow and determines the flux of isotopes through all intermediates. For reasons of mass balance, the relative flux of 37Cl and 13C isotopes must correspond to that of the first step (19) in such a situation so that all intermediates show the same slope of ∆δ13C versus ∆δ37Cl as PCE.
Environmental Significance
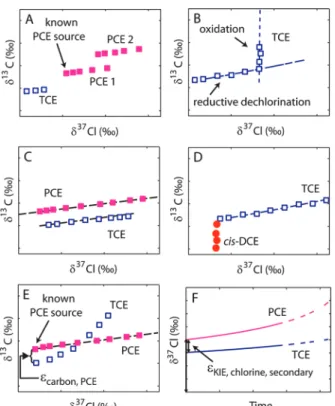
Insight from our modeling offers interesting prospects for the application of dual isotope approaches to investigate groundwater contaminations by chlorinated ethenes. A most prevalent feature is that chlorine isotope values of a reaction product cannot be more negative than the initial value of its precursor, provided that secondary isotope effects are absent. Considering, for example, a PCE-contaminated field site at which source signatures δ13C
PCE,0 and δ37ClPCE,0 are well-established and where TCE is encountered with significantly more negative isotope values in carbon and chlorine (Figure 4A). Whereas information from carbon isotopes would suggest that TCE is a degradation product of PCE, this scenario can be ruled out on the basis of chlorine isotope evidence. Hence, TCE found at this site must be a co-contaminant or stem from a different source.
[εQ,C+ (δ 13C Q- δ 13C I)]≈ [δ 13C I,instantaneous- δ 13C I] (23)
(
d(δ C) d(δ37 13 Cl))
t)0 ≈ -εC,Q -kI kQ× εC,I -εCl,Q -kI kQ× εCl,I (24)FIGURE 4. Scenario of isotope ratios at hypothetical field sites (panels A-E) as well as in a possible laboratory experiment (panel F). (A) Dual isotope plot of PCE 1, PCE 2, and TCE originating from different sources. (B) Isotope effects of different transformation reactions reflected in different dual isotope slopes. (C,D) Dual isotope trends in reaction products that are not further transformed. (E) Carbon field enrichment factor estimated from εC
≈ δ13C
0,TCE - δ13C0,PCE, where δ37Cl0,PCE and δ13C0,PCE are PCE
signatures of the source. TCE is detected with the same initial
δ37Cl
0as PCE, and secondary Cl isotope effects are assumed to
be absent. (F) Hypothetical evolution of chlorine isotope ratios in laboratory experiments. The εCl of secondary chlorine isotope
effects is given by the difference of δ37Cl
0,TCEand δ37Cl0,PCEat the
beginning of the reaction.
Similarly, on the basis of carbon isotopes, it is difficult to deconvolve different sources if they contain the same contaminant and if compounds from both sources experi-ence degradation. Using the dual isotope approach (even without modeling), it can nonetheless be possible to distinguish them if the sources have different signatures. The reason is a distinct spacing between data points from either source in a dual isotope plot, which would reveal their different origin (PCE1 and PCE2 in Figure 4A), in analogy to examples of other compounds such as per-chlorate (Figure 4 in Sturchio et al. (20)) or isoproturon (Figure 4 in Penning and Elsner (21)).
Complementary to this added value for source elucidation, analysis of dual isotope slopes may also give important information about transformation mechanisms (Figure 4B). Different trends for aerobic degradation of chlorinated ethenes are expected compared to reductive dehalogenation because different bonds are broken. Both cases may therefore be distinguished in dual isotope plots (10).
Also, if a product is not further degraded, trends in carbon-chlorine dual isotope plots such as in Figure 3 show a linear trend not only for the substrate but also for the product (Figure 4C). Specifically, TCE that is formed from PCE will show a slope ε1,C,bulk/ε1,Cl,bulkso that its data points are predicted to fall on a line parallel to those of PCE. A special case is DCE formed from TCE; it will show a trend parallel to the δ13C axis because its δ13C values become increasingly positive, whereas its δ37Cl values remain
un-changed (Figure 4D). Such linear trends may be used as additional circumstantial evidence that a reaction product is not further transformed.
Furthermore, by incorporating carbon and chlorine isotope fractionation into a reactive transport model, it may be possible to substantiate the occurrence of different pathways of degradation of chlorinated hydrocarbon inter-mediates using either the isotopologue or the isotope approach. The isotopologue approach can easily accom-modate isotope effects by different mechanisms (e.g., concerted versus stepwise reactions and primary versus secondary effects) and isotope effects associated with physical processes (e.g., diffusion or sorption), while the isotope approach has the advantage that less compounds need to be simulated (12 instead of 22 for chlorine in case of complete reductive dechlorination of PCE).
Finally, dual isotope plots bear the potential to constrain the choice of an adequate carbon isotopic enrichment factor εCto quantify the extent of natural transformation according to the inverse form of the Rayleigh equation (eq 3). Because enrichment factors from laboratory experiments have been shown to vary considerably between organisms (22, 23), degradation may be over- or underestimated if inadequate values are used. This crucial type of information may be estimated with greater confidence if dual isotope trends of substrate and intermediate in the field can be traced back to their initial values (i.e., to the intercepts with the y axis in panels G and H of Figure 3). On one hand, the initial δ37Cl
0 of all chlorinated ethene intermediates are equal to their precursor (Figure 1B). On the other hand, their initial δ13C
0 differ exactly by εCof the respective reaction step (Figure 1A). Consequently, the εCof the reaction may be obtained from an extrapolated offset of intercepts at the δ13C axis (Figure 4E). Such an approach has the potential to signifi-cantly reduce the uncertainty associated with estimating εC values and, therefore, with quantification of chlorinated ethene degradation in the field.
Insight from this study also aids in the design of laboratory experiments to learn more about the mechanism of chlo-rinated ethene transformation and to test the validity of our underlying assumptions. Specifically, careful analysis of initial δ37Cl
0in the precursor and product of a reaction will reveal whether they are indeed equal as predicted by eq 6 and depicted in Figure 1B or whether there is a small offset indicative of secondary isotope effects (Figure 4F). Likewise, the hypothesis of only one reactive position in TCE may be tested by investigating isotope trends in cDCE and Cl- in comparison to the trends predicted in Figure 1C.
These selected examples give a glimpse of the potential of the dual carbon-chlorine isotope approach in future investigations. Our present contribution provides the basis for interpretation and modeling of the associated complex isotope evolution patterns facilitating approaches in these upcoming studies.
Acknowledgments
All authors, D.H., B.M.V.B., and M.E., contributed equally to this work. This research was supported by a European Commission SNOWMAN ERA-Net grant (ERAC-CT-2003-003219) to B.M.V.B. and M.E. in the ENACT project. In addition, M.E. acknowledges funding from the Helmholtz Initiative and Networking Fund for a Helmholtz Young Investigator Group and D.H. from the Swiss National Science Foundation. We thank four anonymous reviewers for very helpful comments.
Supporting Information Available
Calculation of initial isotopologue concentrations, derivation of rate constants for isotopologue and isotope approach, derivation of stoichiometric factors for isotope approach,
implementation of PHREEQC simulations, analytical simu-lation of isotope evolution during one-step reductive dechlo-rination, simulation of isotope evolution during two-step reductive dechlorination, dual isotope slopes for a two-step reaction, and simulation of simultaneous cis-DCE and trans-DCE formation. This material is available free of charge via the Internet at http://pubs.acs.org.
Literature Cited
(1) Elsner, M.; Zwank, L.; Hunkeler, D.; Schwarzenbach, R. P. A new concept linking observable stable isotope fractionation to transformation pathways of organic pollutants. Environ. Sci.
Technol. 2005, 39, 6896–6916.
(2) Meckenstock, R. U.; Morasch, B.; Griebler, C.; Richnow, H. H. Stable isotope fractionation analysis as a tool to monitor biodegradation in contaminated aquifers. J. Contam. Hydrol.
2004, 75, 215–255.
(3) Schmidt, T. C.; Zwank, L.; Elsner, M.; Berg, M.; Meckenstock, R. U.; Haderlein, S. B. Compound-specific stable isotope analysis of organic contaminants in natural environments: a critical review of the state of the art, prospects, and future challenges.
Anal. Bioanal. Chem. 2004, 378, 283–300.
(4) Elsner, M.; McKelvie, J.; Couloume, G. L.; Lollar, B. S. Insight into methyl tert-butyl ether (MTBE) stable isotope fractionation from abiotic reference experiments. Environ. Sci. Technol. 2007,
41, 5693–5700.
(5) Zwank, L.; Berg, M.; Elsner, M.; Schmidt, T. C.; Schwarzenbach, R. P.; Haderlein, S. B. New evaluation scheme for two-dimensional isotope analysis to decipher biodegradation pro-cesses: Application to groundwater contamination by MTBE.
Environ. Sci. Technol. 2005, 39, 1018–1029.
(6) Rosell, M.; Barcelo, D.; Rohwerder, T.; Breuer, U.; Gehre, M.; Richnow, H. H. Variations in C-13/C-12 and D/H enrichment factors of aerobic bacterial fuel oxygenate degradation. Environ.
Sci. Technol. 2007, 41, 2036–2043.
(7) Fischer, A.; Herklotz, I.; Herrmann, S.; Thullner, M.; Weelink, S. A. B.; Stams, A. J. M.; Schlomann, M.; Richnow, H. H.; Vogt, C. Combined carbon and hydrogen isotope fractionation investigations for elucidating benzene biodegradation pathways.
Environ. Sci. Technol. 2008, 42, 4356–4363.
(8) Vogt, C.; Cyrus, E.; Herklotz, I.; Schlosser, D.; Bahr, A.; Herrmann, S.; Richnow, H. H.; Fischer, A. Evaluation of toluene degradation pathways by two-dimensional stable isotope fractionation.
Environ. Sci. Technol. 2008, 42, 7793–7800.
(9) Mancini, S. A.; Devine, C. E.; Elsner, M.; Nandi, M. E.; Ulrich, A. C.; Edwards, E. A.; Sherwood Lollar, B. Isotopic evidence suggests different initial reaction mechanisms for anaerobic benzene biodegradation. Environ. Sci. Technol. 2008, 42, 8290– 8296.
(10) Abe, Y.; Aravena, R.; Zopfi, J.; Shouakar-Stash, O.; Cox, E.; Roberts, J. D.; Hunkeler, D. Carbon and chlorine isotope fractionation during aerobic oxidation and reductive dechlorination of vinyl chloride and cis-1,2-dichloroethene. Environ. Sci. Technol. 2009,
43, 101–107.
(11) Hofstetter, T. B.; Reddy, C. M.; Heraty, L. J.; Berg, M.; Sturchio, N. C. Carbon and chlorine isotope effects during abiotic reductive dechlorination of polychlorinated ethanes. Environ.
Sci. Technol. 2007, 41, 4662–4668.
(12) Sakaguchi-So¨der, K.; Jager, J.; Grund, H.; Matthaus, F.; Schu¨ th, C. Monitoring and evaluation of dechlorination processes using compound-specific chlorine isotope analysis. Rapid Commun.
Mass Spectrom. 2007, 21, 3077–3084.
(13) Shouakar-Stash, O.; Drimmie, R. J.; Zhang, M.; Frape, S. K. Compound-specific chlorine isotope ratios of TCE, PCE, and DCE isomers by direct injection using CF-IRMS. Appl. Geochem.
2006, 21, 766–781.
(14) Elsner, M.; Hunkeler, D. Evaluating chlorine isotope effects from isotope ratios and mass spectra of polychlorinated molecules.
Anal. Chem. 2008, 80, 4731–4740.
(15) Clark, I. D.; Fritz, P. Environmental Isotopes in Hydrogeology; Lewis Publishers: Boca Raton, FL, 1997.
(16) Elsner, M.; Cwiertny, D. M.; Roberts, A. L.; Sherwood Lollar, B. 1,1,2,2-tetrachloroethane reactions with OH-, Cr(II), granular iron, and a copper-iron bimetal: Insights from product formation and associated carbon isotope fractionation. Environ. Sci.
Technol. 2007, 41, 4111–4117.
(17) Van Breukelen, B. M.; Hunkeler, D.; Volkering, F. Quantification of sequential chlorinated ethene degradation using a reactive transport model incorporating isotope fractionation. Environ.
Sci. Technol. 2005, 39, 4189–4197.
(18) Parkhurst, D. L.; Appelo, C. A. J. User’s Guide to PHREEQC
(Version 2): A Computer Program for Speciation, Batch-Reaction, One-Dimensional Transport, and Inverse Geochemical Calcula-tions; Water Resources Investigation Report 99-4259; U.S.
Geological Survey: Reston, VA, 1999.
(19) Hayes, J. M. Fractionation of the Isotopes of Carbon and Hydrogen in Biosynthetic Processes. In Stable Isotope
Geochem-istry: Reviews in Mineralogy and Geochemistry; Valley, J. W.,
Cole, D. R., Eds.; Mineralogical Society of America: Washington, DC, 2001; Vol. 43.
(20) Sturchio, N. C.; Bohlke, J. K.; Beloso, A. D.; Streger, S. H.; Heraty, L. J.; Hatzinger, P. B. Oxygen and chlorine isotopic fractionation during perchlorate biodegradation: Laboratory results and implications for forensics and natural attenuation studies.
Environ. Sci. Technol. 2007, 41, 2796–2802.
(21) Penning, H.; Elsner, M. Intramolecular carbon and nitrogen isotope analysis by quantitative dry fragmentation of the phenylurea herbicide isoproturon in a combined injector/ capillary reactor prior to GC separation. Anal. Chem. 2007, 79, 8399–8405.
(22) Cichocka, D.; Imfeld, G.; Richnow, H. H.; Nijenhuis, I. Variability in microbial carbon isotope fractionation of tetra- and trichlo-roethene upon reductive dechlorination. Chemosphere 2008,
71, 639–648.
(23) Cichocka, D.; Siegert, M.; Imfeld, G.; Andert, J.; Beck, K.; Diekert, G.; Richnow, H. H.; Nijenhuis, I. Factors controlling the carbon isotope fractionation of tetra- and trichloroethene during reductive dechlorination by Sulfurospirillum ssp and
Desulfi-tobacterium sp strain PCE-S. FEMS Microbiol. Ecol. 2007, 62,