Metamorphism I. Heat Transfer during the Evolution of
Regions of Thickened Continental Crust
by PHILIP C. ENGLAND1 AND ALAN BRUCE THOMPSON2
'Department of Geological Sciences, Harvard University, Cambridge, MA 02138 U.SA.
2Institutfiir Mineralogie und Petrographie, ETH Zurich, CH 8092 Zurich, Switzerland
(Received 20 June 1982; in revised form 15 April 1984)
A B S T R A C T
The development of regional metamorphism in areas of thickened continental crust is investigated in terms of the major controls on regional-scale thermal regimes. These are: the total radiogenic heat supply within the thickened crust, the supply of heat from the mantle, the thermal conductivity of the medium and the length and time scales of erosion of the continental crust. The orogenic episode is regarded as consisting of a relatively rapid phase of crustal thickening, during which little temperature change occurs in individual rocks, followed by a lengthier phase of erosion, at the end of which the crust is at its original thickness. The principal features of pressure-temperature-time {PTt) paths followed by rocks in this environment are a period of thermal relaxation, during which the temperature rises towards the higher geotherm that would be supported by the thickened crust, followed by a period of cooling as the rock approaches the cold land surface. The temperature increase that occurs is governed by the degree of thickening of the crust, its conductivity and the time that elapses before the rock is exhumed sufficiently to be affected by the proximity of the cold upper boundary. For much of the parameter range considered, the heating phase encompasses a considerable portion of the exhumation (decompression) part of the PTt path. In addition to the detailed calculation of PTt paths we present an idealized model of the thickening and exhumation process, which may be used to make simple calculations of the amount of heating to be expected during a given thickening and exhumation episode and of the depth at which a rock will start to cool on its ascent path. An important feature of these PTt paths is that most of them lie within 50 °C of the maximum temperature attained for one third or more of the total duration of their burial and uplift, and for a geologically plausible range of erosion rates the rocks do not begin to cool until they have completed 20 to 40 per cent of the total uplift they experience. Considerable melting of the continental crust is a likely consequence of thickening of crust with an average continental geotherm. A companion paper discusses these results in the context of attempts to use metamorphic petrology data to give information on tectonic processes.
1. I N T R O D U C T I O N
Observations of metamorphic rocks exposed over regional extents form one of the important classes of data on which our present understanding of the evolution of orogenic belts is based. This understanding is at best patchy, owing to the many combinations of horizontal and vertical motions that may occur during the lifetime of an orogenic belt and to the complex, or sometimes merely insensitive, response to these processes of the geological indicators from which histories of strain, deviatoric stress, pressure or temperature may be inferred. In this paper we discuss the problems of inferring one class of these histories, the pressure-temperature-time (PTt) path followed by a rock during regional metamorphism; more specifically, we concentrate on the PTt paths resulting from the burial and exhumation of rocks during episodes of continental thickening.
PRESSURE-TEMPERATURE-TIME PATHS. I 895
Heat and mass transfer during the development of an orogenic belt may involve the thickening of continental crust by thrusting or magma addition, the thinning of crust by intra-plate rifting or the sliding of nappes under gravity; heat may be supplied to the crust by magmas generated from partial melting of the mantle, may be transferred within the crust by conduction or by the motion of fluids, and is generated to a significant extent by the decay of radioactive isotopes within the continental crust. In understanding the development of an individual orogenic belt, and the evolution of the continental crust as a whole, it is desirable to know the extent to which these, and other, processes have influenced the thermal history of the rocks that are now exposed in regional metamorphic terrains.
It has long been recognized that PT data derived from mineral assemblages are, on their own, of limited use in this endeavour, and certainly cannot be used to infer directly, say, the ambient geothermal gradient during metamorphism. Thus the problem divides into two portions, of which the first is to determine the likely PTt paths that rocks may experience in given tectonic environments, and the second is to find, if possible, features of these paths that are diagnostic of particular processes and are likely to be recorded in the mineral assemblages when the rock finally reaches the surface.
Rocks that record mineral geobarometric pressures of several kilobars are widespread on the surface of crust of normal continental thickness; this, with geophysical evidence for greatly thickened crust in regions of present day orogenic activity implies that crustal thickening is of major importance in orogenic evolution. Several models, of varying complexity, have been constructed to describe the thermal regimes of regions of thickened continental crust (e.g. Oxburgh & Turcotte, 1974; Bickle et al., 1975; Bird et al, 1975; England & Richardson, 1977; Toksoz & Bird, 1977; England, 1978; Richardson & England, 1979) but most of these have been tied to specific geological areas and often the full range of variability of the parameters to the models has not been considered.
In the following sections we construct a system that we believe may contain the principal elements dictating the thermal development of thickened continental crust and investigate the
PTt paths that may be followed by rocks undergoing burial and exhumation during an
orogenic episode. A companion paper (Thompson & England, 1984, hereafter referred to as Part II) deals with the petrological problems of inferring such paths from the rocks preserved at the land surface.
2. PHYSICAL MODEL
As has been established in previous work (Clark & Jager, 1969; Bickle et al, 1975; England & Richardson, 1977; England, 1978) the apparently insuperable complexity of treating the thermal development of a continental collision zone can be overcome by the recognition that there are only a few major controls on the kinds of thermal profile developed and a host of minor controls. The major controls are enumerated below, and regional geotherms and PTt paths are calculated for cases in which these controls are varied over their geologically interesting ranges.
The use of systems such as these may seem undesirable, in that they are not attached to a recognizable geological history for one specific terrain and have a somewhat abstract flavour. We cannot emphasize too strongly our belief that an understanding of the major factors that govern regional metamorphism is not achieved by the construction of detailed numerical analogues to specific complex geological terrains; in contrast, the kind of simple numerical experiments to be described herp can give valuable insights into heat transfer processes during metamorphism on a regional scale (s~e also section 4).
2.1. Assumptions 2.1.a. Heat sources
We assume that the major sources of heat in regional metamorphism are the decay of radioactive elements in the continental crust and the heat transferred to the base of the crust from the upper
mantle. Metamorphic reactions within the crust may be local sources or sinks of heat, but the amounts of heat involved are generally much less than the total heat flowing through the system. This assump-tion, and the quantities involved, are discussed in subsection 3.3.
2.1.b. Mechanism of heat transfer
Heat transfer is assumed to be predominantly by conduction and, for lack of any better general relation, the crust is assumed to have constant thermal conductivity. In subsection 3.1 we discuss our reasons for making this assumption.
2.I.e. Initial conditions
Before orogeny, the continental crust is assumed to have a conductive steady state profile with a given heat flux, Q*, from the uppermost mantle and a given internal heat production distribution. Specifically, we assume radiogenic heat production to be constant at a rate A to depth D and to be zero elsewhere. Then the temperature, Vc, at any depth z is given by:
Az Q+z Ve(z) = (D-z/2) + - — 0<7<Z) K K (i) AD1 Q*z = + z > D IK K
where Q+ is the heat flow from the upper mantle to the crust, K is the thermal conductivity of the medium, and the surface temperature is taken to be zero—an adequate assumption for the centigrade scale used here. A special case, which may well be of considerable geological importance—that of the telescoping of passive continental margins (e.g. Helwig, 1976; Jackson, 1980)—is considered separately (see section 4). There, the initial condition is given by equation 1, but a period of extension and subsidence precedes the compressional phase.
2.1.d. Geometry of thickening
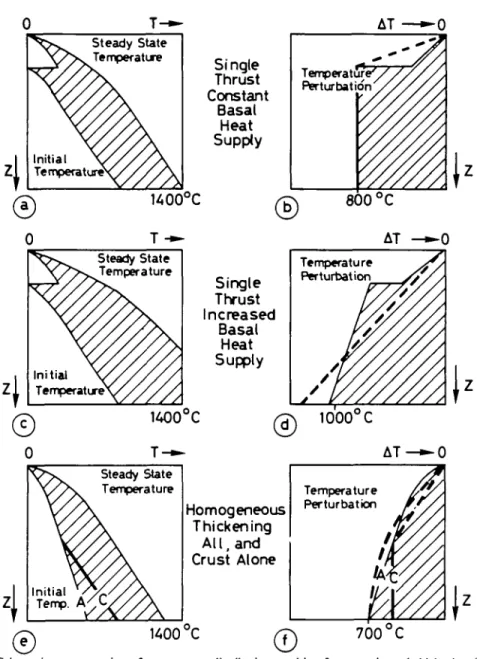
Thickening of the crust in orogeny is assumed to occur without change in the heat supplied to the base of the continental lithosphere. Such a change by its nature is long term and thus impossible to observe directly; it would also be very hard to demonstrate from geological observations. We chose three geometries of thickening which reasonably represent the great variety of processes that may be involved in continental thickening (Fig. 1).
In the first case (Figs, la, Id, \g) the thickening is assumed to be the result of the emplacement of a single thrust sheet of thickness 5 onto the continental section whose temperature is given by equation 1; this gives an initial temperature distribution of:
V(z,0)=Vc(z) 0<z<5 (2a)
V { z , 0 ) = Vt{z - S ) z > S (2b) In the second case (Figs. \b, le, \h) the thickening is assumed to occur by homogeneous horizontal shortening of the entire crust by continental collision. Thus if the crustal thickness is multiplied by a factor of/(>1) then
V(z,0)=Vc{z/f) 0 < z / / < C (3a) (z>0 for Figs. lc,f,i)
V(z,0) = Vc(z - ( / - 1)C) z/f > C (3b) where C is the initial crustal thickness, taken to be greater than the heat production scale length, D. In all the systems described below C is taken to be 35 km. In the third case, the thickening takes place throughout the entire lithosphere (Figs, lc, If, 1/) and the temperature is given by equation (3a) for all values of depth.
The first two cases correspond to crustal shortening without disturbance to the mantle thermal regime, and they represent reasonable end members of the geometries of crustal thickening. The third case, involving thickening of the lithosphere as a whole represents a possible geometry of continental thickening in. which the sub-crustal thermal gradients are reduced due to the compression, and this differs importantly from the other two cases. In all cases, though, the heat flow at the base of the
PRESSURE-TEMPERATURE-TIME PATHS. I 897 lithosphere remains constant. The geological relevance of these geometries is considered further in section 4.
The initial internal heat production distribution H(z) is given in the case of thickening by thrusting by: H(z)=A 0 < z < m i n ( S , D )
= 0 D <z^S if S > D
(4)
= 0 z> S + D
or in the case of thickening by homogeneous compression by: H(z)=A
= 0 z/f>D (5)
2.I.e. Erosional parameters
We assume that the continental lithosphere is always close to isostatic equilibrium and thus that at some time after thickening the crust will have returned close to its original thickness through the agency of erosion acting on its elevated surface. Thus the depth, Emtx of the erosion is defined to be S (equations 2), or ( / — 1)C (equations 3), and it remains to choose a time scale. Erosional time and length scales are discussed in subsection 3.4.
2.1. f. One-dimensionality
Throughout this paper we consider the transfer of heat in the vertical direction only. On a local scale there is frequently evidence of appreciable lateral heat transfer, for example in the neighbour-hood of intrusive bodies, but on a regional scale we should expect horizontal thermal gradients to be much less than vertical ones. Even were we willing to consider lateral heat transfer, the absence of adequate constraints on the boundary conditions would make such an enterprise fruitless in the general case.
2.2. Method of solution
The equation of heat transfer in a constant-conductivity moving medium, with heat transfer only in the z direction is
\dv d1v u(z,t)dv h(z,t)
Kdt~ dz2 K ~dz+ K
where v is the temperature, K is the thermal diffusivity, K is the thermal conductivity, h the rate of heat generation and u is the vertical velocity of the medium relative to the plane z = 0. Equation (6a) may be written in a non-dimensional form:
do' <9V uol do'
= —u'(z',t') + h'(z',t') (6b) df dz'1 K dz'
where z' = z/l, v' = v/o0, t' = Kt/l2 and h' = hl2/Ko0 and / is a characteristic length of the system (e.g. the lithospheric thickness), o0 is a characteristic temperature and u0 is a characteristic velocity
(see section 5.2).
We shall assume that there is no shortening or extension after time ( = 0, so that the velocity is simply the rate at which the medium is eroded,
= 0 t> T
We discuss in section 3.3 the role of endothermic and exothermic metamorphic reactions, but make no detailed calculations concerning them, so the heat production distribution is given by
h(z,t)=H{z + E(Q) (8) where H is calculated from equation (4) or (5) as appropriate, and E(t) is the amount of erosion that has occurred at time t.
Equation (6), with the initial conditions specified in the previous subsection and the boundary conditions v = 0 at z = 0; v' = 0 at z' = 0 dv do' Q+l K— = Q+ at z = zma; — = — at z' = z'mnx (9) 8z 8z' Kv0
is solved using finite difference approximations to the derivatives.
In the applications described here we have fixed zmlx to be 150 km and we maintain a constant conductive heat flux of Q+ over this lower boundary. We realize the extent to which this fails to match the likely situation—in that the heat flux to the base of the lithosphere is presumably maintained by mantle convection in a fashion that may give a time-averaged approximation to a constant heat flux (eg., Parsons & McKenzie, 1978)—but solving the full equations for the transfer of heat near the base of the lithosphere is beyond the intended scope of this paper. This approach approximates to assuming a lithosphere that is always 150 km thick and numerical solutions generated will only be unreasonable if the true value of lithospheric thickness becomes very much less than this (see also the discussion in section 4). The heat transfer equation is solved using the Crank-Nicolson implicit finite difference technique (Crank & Nicolson, 1947), an accessible account of which is given by Smith (1965). •
3. G E O L O G I C A L L Y R E L E V A N T P A R A M E T E R R A N G E S 3.1. Heat transfer
3.La. Fluid motion
The predominant mode of heat transfer is assumed to be by conduction. This is not because we believe that the transfer of heat by fluids is always negligible, but because it seems that there are enough cases in which this does not dominate, on the length and time scales of heat transfer that are involved in regional metamorphism, to justify the investigation of a conductive model first.
There is abundant evidence of the emplacement of granitic, and to a lesser extent mafic and ultra-mafic, bodies during regional metamorphism. In addition, stable isotope studies point to the widespread cooling of intrusives by hydrothermal systems. These observations are sometimes taken to imply that heat transfer models based on conduction alone are of no use in geological applications, yet it is far from clear that this is so. For the purposes of this argument, it is important to distinguish effects that may dominate on a local scale from those that may dominate regionally.
It is reasonable to expect rapid removal of heat by hydrothermal convection around shallowly-emplaced plutons, where intrusion and cooling will cause high crack permeabilities (e.g. Cathles, 1977; Norton & Taylor, 1979). We are concerned to determine whether conditions deeper in the crust, where overburden pressure or secondary minerals may well close most microcracks, are also likely to permit convection. In Appendix A we outline the conditions under which the continental crust as a whole may be dynamically stable to the convection of water in its pore spaces. If the crust were homogeneous, these conditions would require it to have the permeability that is measured in the laboratory for unfractured crystalline rocks (Brace, 1980)—that is, no more than 10 /idarcy (10~n
m2), whereas if impermeable layers were to restrict convection to a depth scale of a kilometre,
con-vection would not occur unless the permeability exceeded about a millidarcy. Permeabilities in the darcy to millidarcy range have been inferred for upper crustal rocks (Brace, 1980); however, there are two lines of evidence that suggest that below, perhaps, 10 km crystalline rocks become much less permeable (Brace, 1980). One comes from modelling the hydrothermal alteration of the Skaergaard intrusion and the surrounding rocks (Norton & Taylor, 1979), from which it was concluded that the permeability of the deepest section of the sequence (gneisses at 8—10 km) was between 1 //darcy and 10 nanodarcy; secondly, if water is present in the lower crust, a permeability of nanodarcy order is required in order for it to remain there for a geologically significant length of time (Brace, 1980).
Perhaps the most compelling argument about the role of fluid circulation in regional metamorphism is that if this mode of heat transfer were to operate on a large scale during metamorphism, we should expect more of the retrogressive metamorphic effects that are commonly observed in hydrothermal systems (Fyfe et al., 1978, p. 14), but not on a regional metamorphic scale.
The motion of igneous fluids during metamorphism is a likely departure from the purely conductive regime assumed here. However, it is important to distinguish between anatexis with mobilization of
PRESSURE-TEMPERATURE-TIME PATHS. I 899 continental crust in a regime of average thermal contribution from the mantle, and the intrusion into the crust of large volumes of mantle-derived melts. In the first case, although the melts may redistribute the heat, they do not add to the total heat budget. In the second case, to neglect the advection of heat by melts would be to ignore a major contribution to the thermal budget. The degree of mantle involve-ment in the generation of large continental batholiths is variable (e.g. Allegre & Ben Othman, 1980; Farmer & De Paolo, 1983) but it appears that there are some such terrains in which mantle involvement has been small.
For these reasons, and because there are belts where plutonism is minor or postdates major meta-morphic episodes, we consider it worthwhile to investigate the thermal evolution of a model for the continental lithosphere in which convection does not play a dominant role, and to compare the predictions of this model with observations made in metamorphic belts. Advection of heat by fluid motion can be included at a later stage if the observations require it. Among other things, the calculations described below will be able to determine whether crustal shortening alone can be responsible for the melting of large volumes of crust, or whether mantle-derived magmas must be involved as heat sources.
3.1.b. Thermal conductivity
The thermal conductivity in the lithosphere is assumed to be independent of temperature and pressure; this approximation is made because, within the crust, the variation of conductivity with lithology is likely to be considerably greater than the variation of conductivity of a single rock type with temperature or pressure. A recent summary of the thermal conductivity of crustal materials (Robertson, 1979) shows that most determinations of conductivity made above 200 °C lie in the range 1-5 to 3-5 W m~' K"1 except for those rocks containing very high percentages of quartz (which
have higher conductivities). As a reasonable range of average conductivities for the crust we chose 1-5 W m"1 K~' to 3-0 W m"1 Kr1 and we bear in mind that the thermal conductivity of rocks tends to
fall with increasing temperature. The data of Birch & Clark (1940) suggest that the conductivities of a variety of felsic igneous rocks change from about 2 to 4 W m~' K~' at 0 °C to about 1-75 to 2-5 W m -1K - ' a t 4 0 0oC .
Specifically, we find solutions to equation (6) with conductivities / n = 1-5 W m - ' K "1
* 2 = 2 . 2 5 W m - K - Parameter range 1 AT3 = 3O W r n - ' K "1
Throughout this paper we assume a constant heat content of 2-5 x 10⁶ J K~' m"3 for crustal and upper
mantle rocks, so that the thermal diffusivities for the conductivities of Range 1 are 6 x 10~7 m~2 s~'
(Kl),9x 10-7m2s-'(i(:2)and 1-2 x 1 0 -6m2s - ' (#3).
3.2. Heat source distributions
A first estimate of the amount of heat that is available for regional metamorphism can be made from measurements of surface heat flux on the continents. The highest measured values of this quantity are over 200 mW m~2, but these are generally restricted to areas associated with extrusive, or near
surface intrusive, igneous activity. In general the highest surface heat flows are measured in regions that have most recently experienced tectonic events (see, for example, Polyak & Smirnov, 1968). Sclater et at. (1980) show that the average continental heat flux is around 60 mW m~2; we use this
value, and their average values for continental regions of tectonic age less than 250 Myr (75 mW m~2)
and greater than 1700 Myr (45 mW irr2) as representative of the range of continental surface heat flux.
In general it is more important to know the total heat supplied to the continental crust than to determine its exact distribution, but we need to specify some division of the surface heat flux into a portion arising within the crust and one conducted to the crust from below. This division is necessary because the former portion must presumably increase in proportion to the amount by which the crustal thickness is increased, while there is no reason to expect such a simple change in the mantle heat flow consequent on crustal thickening (section 4). The three choices for this division—Heat Supply Distributions I, II and III—correspond respectively to surface heat fluxes of 45, 60 and 75 mW rrr2.
It appears from observations in stable continental shields, that the heat transferred by the upper mantle to the continental crust is generally no less than about 20 mW m~2 (Sclater et al., 1980, 1981)
than 40 mW m~2. We choose mantle heat flow contributions of 20, 30 and 40 mW m~2 to Distributions
I, II, and III above.
The remainder of the surface heat flow characterizing each of these distributions is assumed to originate in the upper 15 km of the continental crust (i.e. the scale length D in equation (1) is taken to be 15 km). Interpretations of surface heat flow measurements tend to favour rather shorter scale lengths for the crustal heat production distribution: Pollack & Chapman (1977) quote an average of 8-5 km from the published estimates of this scale length. The transient effects of erosion, and the heat flow refraction which may occur around plutons that contrast in heat production and/or conductivity with their country rocks, both can reduce the apparent scale length that is deduced from surface heat flow observations (e.g., England & Richardson, 1980; England et al., 1980). Richardson & Oxburgh (1978, 1979) report the evidence for and discuss the implications of a scale length of 16 km for heat production in the crust of England and Wales, and similar scale lengths are reported by Jessop & Lewis (1978) for the Superior Province and Rao et al. (1976) for parts of the Indian Shield. We claim no wider geochemical or geophysical significance for our choice of a 15 km scale length than that it is in harmony with a view of the continental crust which holds that the bulk of the radiogenic heat production is in a more silicic upper crust (e.g. Lambert & Heier, 1965; Smithson & Decker, 1974). Note that crustal thickening by thrusting results in two zones of heat production, one starting at the surface, and one immediately below the thrust (equation 4); uniform thickening results in a single such zone ( / x 15 km thick lequation 5|).
The parameterization just discussed leads to initial heat source distributions described by equation (1) with D equal to 15 km in all cases and
A = 1 A = 2 A=l •666//Wm"3; •0 /yW m-3; •333//Wm"3; G* = 6* = 20 mW m"2 3OmWm-2 40, mW m"2 (I)
00
(III) Parameter range 233. Mechanical heat sources and metamorphic heat sinks
The influence of mechanical dissipation on metamorphic grade has been discussed in general by Reitan (1968a, b; 1969) and in the case of fault-related metamorphism by Graham & England (1976), Barton & England (1979), Scholz (1980), Brewer (1981) and Molnar et al. (1983). It is,dear from these last studies that frictional heating during deformation may be locally important if stresses on faults are of kilobar order. The distance, /, that such metamorphism would extend from the fault is related to the thermal difusivity, K, of the medium and the duration, t, of the deformation by ' .'
l-\fiic
(e.g., Graham & England, 1976), so that a duration of 1 Myr for deformation could result in fault-related metamorphism of 5 km extent which—given a limited exposure—might appear to be of regional importance. Stresses of kilobar order are higher than what many seismologists would accept as typical stress levels in seismically active regions, but given current uncertainties in this field, we do not propose this as a constraint.
There appears to be no appreciable contribution from frictional heating to the present day heat flux around the San Andreas fault system (Lachenbruch & Sass, 1980). There are, to our knowledge, no clear demonstrations of large scale metamorphism in which frictional heating played a major role, although several of the cases cited above are certainly strongly suggestive of this idea. The difficulty with such a demonstration is that it requires the observation of temperatures convergent on the fault zone (convergence of mineral ages is not sufficient, as micas at least are sensitive to mechanical disruption) and also the certainty that this convergence is not the product of hydrothermal activity or of significant vertical motion on the fault. As major faults frequently juxtapose higher and lower grade terrains, it is hard to satisfy all these criteria.
It is easier to obtain a regional estimate of the contribution to the metamorphic budget of mechanical dissipation in the rocks. We may take the maximum regional metamorphism pressures reported in Phanerozoic belts say, 10 kb—to indicate the approximate amount of crustal thickening involved, 35 km; this gives an estimate of the average deviatoric stress required to maintain the elevation contrast. If the elevation is maintained by the deformation of a viscous lithosphere (e.g. England & McKenzie, 1982) this stress is around 300 bars; similar estimates may be obtained by other arguments (e.g. Tapponnier & Molnar, 1976). At a strain rate of 10~13 s"1 to 10~M s~' (100 per cent strain in 30
PRESSURE-TEMPERATURE-TIME PATHS. I 901 temperature rise of about 10 ° K. Thus mechanical dissipation is unlikely to be important on a regional scale, but concentration of deformation into narrow zones could make it locally significant. The recognition that much basement deformation occurs in relatively narrow shear zones means that this possibility ought to be borne in mind.
The importance of metamorphic reactions in the thermal budget of an orogenic belt may be assessed from the following simple argument (England, 1978; Verhoogen, 1980, p. 7). We may assume that the principal heat sinks are dehydration reactions with heats of reaction of between 40 and 80 kJ per mole of water released. Taking a value of 80 kJ mole"1 and a series of reactions in which a total of 5 weight
per cent H2O is released over 30 Myr, gives an equivalent heat loss of approximately 0-6 //W m~3—
small compared with the radiogenic heat production assumed above, unless the whole crust were to be dehydrated by this amount over this time period or the time scales for metamorphic evolution were much shorter than 30 Myr. The influence on the regional thermal budget of the effects discussed in this section are easily visualized if the appropriate addition or subtraction of effective heat production is made to the heat source distributions of section 3.2.
3.4. Erosionalparameters
There is no simple way of interpreting estimates of metamorphic pressures from mineral assemblages to give a maximum depth of burial for a given rock: under the conditions investigated here, many rocks experience their maximum metamorphic temperatures much shallower than their maximum burial depth (Figs. 3—8), and so they give at best a lower bound on the burial depth (England & Richardson, 1977; England, 1978). We use the fact that mineral assemblages frequently record burial depths of greater than 25 km, and the observation of crust of at least twice normal thickness in the Himalaya and Tibet (Menke & Jacobs, 1976; Chen & Molnar, 1981), to infer that burial depths of 35 km are reasonable in metamorphic terrains.
The range of Emax used in the calculations is
£ 1 = 20 km (Thrust of 20 k m ; / = 1-57) E2 = 35 km (Thrust of 35 km; / = 2-0) £ 3 = 50 km (Thrust of 50 k m ; / = 2-43)
There is no reliable body of observational evidence, as yet, that helps in the choice of an erosional time scale and we rely on the simple observation that most Cenozoic orogenic belts have appreciable topographic elevation, whereas most Palaeozoic ones do not, to suggest that an appropriate time scale for the erosion of orogenic belts lies between 50 and 200 Myr.
We assume that erosion is at a constant rate over this time span, and then ceases; various other erosional models may be constructed—for example, one in which the erosion rate decays exponentially with time (England & Richardson, 1977)—but these, too, have slender foundation. The amount of erosion and the time over which most of it occurs remain the important parameters regardless of the details of individual models.
The range of times is then
T\ = 5 0 Myr
T i tns\\M Parameter
T2 = 100 Myr ,
3 range 4
T2 = 200 Myr
There is evidence from the tectonic history of the Alpine chain (see, for example, summaries by Oxburgh & Turcotte 11974|, Bickle el al. [19751 and Oxburgh & England 119801) that a delay may occur between the assembly of the orogen as a region of thickened crust and the onset of rapid erosion of that pile. Richardson & England (1979) have suggested that such a delay may be a common effect in regions where the crust is rapidly thickened; the pressure in the lower regions of such crust is increased rapidly without an immediate corresponding increase in temperature. Under these conditions, continental crust of intermediate composition may undergo a series of mineral reactions, some involving the breakdown of plagioclase into higher density minerals (pyroxene with excess quartz) that leave a sufficiently high density root for the land surface of thicker-than-average crust still to be close to sea level. Richardson & England suggested that it may take a time of order 20 Myr for the thermal relaxation of this pile to reverse this density change and elevate the land surface sufficiently for erosion to become significant. We include as an extra erosional parameter the possibility of a delay of 20 Myr between the initial thickening of the continental crust and the onset of erosion; calculations are performed with and without this delay.
4. G E O L O G I C A L R E L E V A N C E
The question may well be asked: to what extent does the simplified system set out above represent the complexity of geological processes in convergent orogenic belts? There are two points at issue: first, even if the predominant mode of heat transfer is conductive, does the simplified geometry adequately describe the far more complex events that are certain to occur in a real orogenic belt; secondly is it justifiable to assume a purely conductive regime with the initial and boundary conditions prescribed above.
In the strict sense the answer to each of these questions is 'no'. However, it must be borne
in mind that the purpose of this paper is not to provide a detailed reconstruction of an individual metamorphic belt, but to pursue the implications of a relatively simple model for the thermal evolution of continental collision belts in general. The model recognizes a few major controls on this evolution and makes predictions about the transient thermal regimes that will be established, and about the PTt paths that rocks will follow in such regimes. These predictions provide a quantitative basis from which to interpret metamorphic rocks and assess orogenic evolution. (See also discussion in section 3.1.a.)
The wisdom of trying to make accurate representations of geological complexities has already been discussed at the beginning of section 2; we shall show in section 5 and Appendix B that, for a conductive model, phenomena of smaller scale than the total crustal radiogenic heat supply or the mantle contribution to the heat flux are relatively unimportant in the development of regional scale metamorphism, and that the long-time thermal development of many, more complex, systems is indeed represented very well by simple models such as those outlined above. Solutions are found to the heat transfer equation under the conditions that may be thought of as being the lowest common denominators for one type of belt; the introduction of complexities may well be justified geologically for a given metamorphic belt, but this leads to the physically undesirable result that it becomes increasingly difficult to determine whether an interesting facet of the numerical solution arises from the general processes of the heat transfer or from the specific conditions assumed. An example of such a complication is spatial variation in metamorphic grade at the erosion surface resulting from differential vertical motion during and after the metamorphic episode. Variations like this can only be treated individually as they are recognized in the field and are therefore outside the scope of these papers, even though they probably occur in every orogenic belt.
We have discussed in section 3.1 our reasons for neglecting the influence of converting pore fluids on the thermal regimes of regional metamorphism, although such fluids clearly transport heat very efficiently in certain shallow level (<10 km) settings. The other major departure from conductive heat transfer is one that certainly does apply in many geological situations—the transfer of heat by magmatic activity. One may make estimates of the minimum required involvement of basaltic magma if this is to be the major heat source for a given metamorphic episode; this point is made indirectly by Wells (1980) and directly by England (1978) who show that between 10 and 30 per cent of the volume of the thickened crust would have to consist of formerly molten basalt in order for amphibolite-facies regional metamorphism to result mainly from such a heat source. Such a proportion is not unreason-able in, say, an island arc terrain and may also obtain in some cordilleran terrains. Consequently, we do not expect the contents of this paper to be applicable to regions in which there is clear evidence that mande-derived melts make up a large fraction of the crustal volume.
Equally, there are terrains in which batholith emplacement is the most recent thermal and tectonic event, and the results of this paper cannot, strictly speaking, be applied to such areas, either. However, many of the thermal profiles presented in Figs. 3 to 8 intersect the probable melting curves for wet and dry (anhydrous or hydrate-bearing but without free H,O)
meta-THICKENIN G O F TH E CONTINENTA L CRUS T AN D LITHOSPHER E B Y THRUSTIN G CRUS T ONL Y HOMOGENEOUSL Y (CRUS T ONLY ) HOMOGENEOUSL Y (WHOL E LITHOSPHERE ) DISTANC E DISTANC E CRUS T SHORTENE D PR E THRUSTIN G a * THRUSTIN G O N UNDISTURBE D caus T BO Y • soot'-'.-:--' 2V> . .-.wo.wwv . rtO ."..'. . "soo - .-•."/'" • 11 IOOO - ' no ».'.;•' w ..'.".•.•>'. • IOO 0
h
TEMPERATUR E ° C d a .!
\WV
\
S 7 1 CRUS T SHORTENE D PRE-THICKENIN G HOMOGEMEOUSI V 0 0 UHDlSTURBC D CWJS T 25 0 ° C .• v ' •» _ -.-.• ^ . _ .750 V ^ \ 2S0 ' ^-7S 0 -!000" C , ^ / ,WOO -\ v--T5 0 ' ' / , -TEMPERATUR E ° C MOSPWeB E SHORTENE D PH E IHlCBENINl i HOMOCENECUSL V O> UM>Sll«K D CDUS T K»O* C -V>__, » ... . /' 1 0 M y p %lc
TEMPERATUR E °C f 7B . IB . 38 . 5a . 7 8 * \ TH/KM S 0 TEMPER A TURE/ Ds
S
V G ^ ^ / vI \,\
rv > \ \ N C O m i -i m -o m > C ?o en l H m •v H Xsedimentary rocks; this occurs during the thermal development of the system, and not at the beginning: any granites thus formed would be a product, not the cause of regional meta-morphism. As the aim of this kind of investigation is to make estimates of the thermal requirements for regional metamorphism, the models presented here have relevance to terrains in which it can be shown (for example isotopically) that, while there has been major batholitic activity, the mantle-derived component of the melts is small (see section 3.1.a).
In choosing the initial and boundary conditions for the problem we have assumed that the continental lithosphere is initially in a steady state conductive regime and that the contribution to the thermal budget from the upper mantie is not altered by the orogenic process (section 2.1). No continental geotherm is in truly steady state, of course, but our assumption about initial conditions will be in error if the continental lithosphere possesses a thermal profile immediately before thickening that is appreciably different from the steady state profile appropriate to its basal and internal heat supplies. The assumption appears to be a good one for most parts of the continental interior, but it is most likely to be violated at precisely those places where continental collisions begin—at continental margins. If an active margin with large amounts of magmatic activity becomes involved in continental collision, we should not expect to model it closely (see above) and we do not consider such cases further, except to remark that they should exhibit metamorphism at higher temperature and lower pressure than is seen for the case of Heat Source Distribution III (subsection 3.2) in Figs. 3 to 5.
The evolution of passive continental margins is now widely viewed in terms of the upward perturbation of the geotherm by lithospheric stretching and the decay of this thermal perturba-tion, producing subsidence of the crust and accumulation of sediments (e.g. McKenzie, 1978;
FIG. 1. The geometry of continental thickening investigated in this paper and illustrations of evolving geotherms, with their relation to the location in PT space of fades series deduced from metamorphic mineral assemblages. FIG. la. The continental crust is shortened by thrusting; in this instance a doubling of thickness results from the emplacement of one entire crustal sequence upon another. Upper crust is depicted by diagonal hatching and lower crust by cross hatching. Schematic isotherms are shown at the time of thrusting, which is assumed to take place instantaneously.
FIG. 16. Shortening is accomplished by homogeneous thickening of the crust Again, the shortening is assumed to take place instantaneously, and the illustration is for time 0 My past shortening.
FIG. \C. AS Fig. 16, except shortening is accomplished by homogeneous thickening of the entire lithosphere. FIG. \d. The evolution of geotherms following thrusting (at 5, 10, 20, 40, 60, 80, 100, 120 Ma), as in Fig. \a (broken lines), and the PTl paths followed by rocks buried initially at 20, 40 and 60 km (solid lines with symbols spaced at 10 Myr intervals). Values of parameters are those for Fig. 3e.
FIG. le. As Fig. Id, except for the case of uniform shortening as in Fig. 16, values of parameters are those for Fig. 4e.
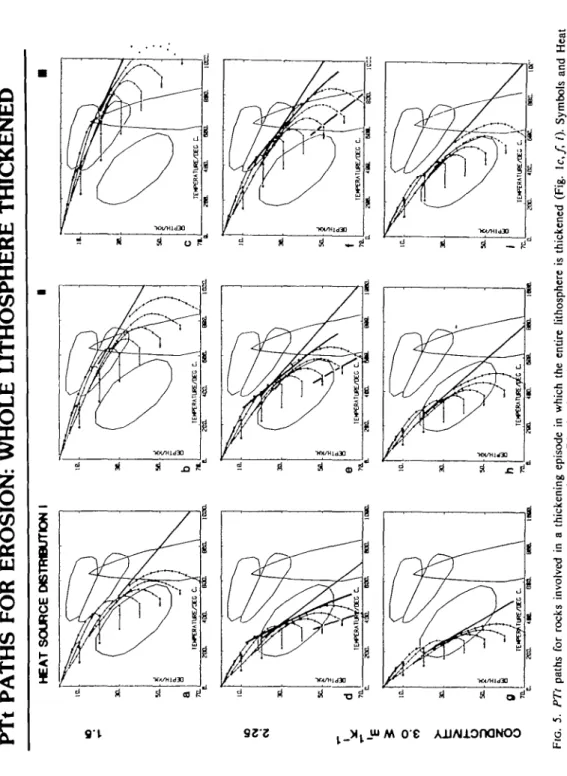
FIG. 1/. As Fig. le, except for the case of shortening of the whole lithosphere as in Fig. lc, values of parameters are those for Fig. 5e.
FIG. Ig. The relation of PTt paths of Fig. Id to the principal fades series (And—Sil; andalusite-sillimanite: Kya-Sil; kyanite-sillimanite: Gla-Jad; glaucophane-jadeite). Pre-thickening geotherm (Vc—equation 1), immediately post-thickening geotherm (0; equation 3) and steady-state geotherm (V^) for the post-thickening heat supply (internal heating given by equation 4) are shown by thick lines.
F I G \h. The relation of PTt paths of Fig. le to the prindpal fades series. Pre-thickening geotherm (Vt—equation 1), immediately post-thickening geotherm (0; equation 3) and steady-state geotherm (V^ for the post-thickening heat supply (internal heating given by equation 5) are shown by thick lines.
FIG. 1/. The relation of PTt paths of Fig. 1 / to the principal facies series, which are located on the basis of PT locations of some experimentally investigated metamorphic reactions (see also Part II, Fig. 2). The data sources for the reactions numbered in open circles are given by Thompson & Thompson (1976, Fig. 13) and correspond to: 2: kyanite = andalusite; 3: andalusite = sillimanite; 4: sillimanite = kyanite; 5: albite = jadeite + quartz; 8: analcite = jadeite + H2O; 9: analdte + quartz = albite + HjO; 12: pyrophyllite = kyanite + quartz + H2O.
The data sources for the reactions numbered in open squares are given by Thompson & Tracy (1979, Fig. 5) and correspond to: 14: muscovite + albite + quartz = K-feldspar + AljSiO, + H2O; 15: muscovite + albite +
K-feldspar + quartz + H2O = silicate liquid; 18: albite + K-feldspar + AljSiO, + quartz + H2O = silicate liquid;
19: muscovite + albite + K-feldspar + quartz = AljSiO, + silicate liquid. See also Figs. 1 and 2, Part II. Pre-thickening geotherm (Ke—equation 1), immediately post-thickening geotherm (0; equation 3a) and steady-state
PRESSURE-TEMPERATURE-TIME PATHS. I 905
Royden et al. 1980; Le Pichon & Sibuet, 1981). As the first phase of continental collision often results in the compression of such a margin (e.g. Helwig, 1976; Jackson, 1980), we ought to consider the possibility of telescoping a thermal profile that violates our assumption about initial conditions.
The maximum lithospheric extension on continental margins appears to be a factor of approximately three (e.g. Le Pichon & Sibuet, 1981). It may easily be verified from equations (1) to (15) of McKenzie (1978) that the thermal profile of a margin stretched by this amount or less will not seriously violate our assumption after 60 Myr. Passive margins that are com-pressed within 60 Myr of their extension will have thermal profiles hotter than can be supported in steady state by their internal and basal heat supplies, and would achieve higher temperature metamorphism, for the same boundary conditions, than the models investigated here. It should be noted that, because subsidence is directly related to the decay of the thermal profile of these margins, the existence of a thick miogeosynclinal sequence would be evidence of cooling of the margin before compression began.
We have also assumed that the lower thermal boundary condition—heat flux from the convecting upper mantle—is not affected by orogeny. Except in the case to be discussed below, we know of no evidence to suggest that such a change should occur, so we have not investigated it. Appendix B contains a suggestion of how to treat this problem if it is so desired.
The last point concerns the cases we investigate in which the compression of the crust is not accompanied by compression of the lithosphere as a whole (Fig. la, b). Where crustal thickening has occurred by thrusting in a narrow belt, like the European Alps, it is commonly assumed that no appreciable change in the thickness of the mantle portion of the lithosphere occurs; in wider belts, such as the India-Asia collision zone this may not be a good assump-tion. Our reason for investigating the case where homogeneous thickening of the crust is not accompanied by a comparable increase in total lithosphere thickness lies in the belief that such a lithosphere would probably form an unstable boundary layer to the underlying con-vecting mantle and detach downward in a few million years, leaving a lithosphere of close to the original thickness (Houseman et al. 1981).
Although the case in which the whole lithosphere is thickened (Fig. lc) may produce a lithosphere more than 200 km thick, we have maintained the bottom boundary condition at 150 km for consistency with the other models. Changing parameters so that this condition is applied at, say, 250 km does not appreciably influence results and nor do such devices as forcing the base of the lithosphere to migrate upwards as erosion proceeds.
In the results below we present pressure-temperature-time (PTt) paths for levels below those that would be exposed at the end of erosion if the crust were just to return to its original thickness. There are two reasons for these paths to be of interest: first, if they intersect the melting curves for crustal rocks we may expect the upward movement of granites—and these would presumably figure in the surface geology. Secondly, it is very common for orogenic belts to become reactivated and for deeper levels to become exposed at some time after the erosional episode that followed the main orogenic episode.
5. RESULTS
To investigate fully all the parameter ranges presented in section 3 would require a total of 486 combinations, or 54 figures like Figs. 3 to 5. This is clearly a prohibitive way of presenting our results and we show a subset of all these calculations to illustrate the form of the PTt paths, and the way in which the form changes with changes in the parameters. We hope that these figures alone may be useful in constructing sketch PTt paths for parameter ranges of interest to the reader, which are not included here. In addition we have obtained approxi-mate analytical solutions to the problem outlined above that serve the dual purpose of
permitting a better-constrained sketch for PTt paths—without going to the trouble of solving the entire problem—and of highlighting the physical processes responsible for the forms of PTt paths in a way that is not possible with numerical solutions.
This approach necessarily concentrates on the mathematical aspects of the problem but provides the groundwork for some aspects of geological interpretation that is discussed in Part II.
5.1. The form of PTt paths
In the general system that is modelled below we have assumed that crust of normal thickness is initially in equilibrium with its internal heat production, and with the heat supplied to its base by conduction through the lower lithosphere (see Fig. 1). When this crust is thickened, the rate at which temperatures within it rise depends both on the rate at which heat is generated within the crustal pile, and on the rate at which it is transferred from below the crust. In the absence of erosion, this heating phase would result in close approach to a steady state temperature regime governed by the new internal heat production distribution and the supply of heat from below. As erosion of overthick continental crust does occur, this phase of heating is terminated during the rocks' ascent towards the cool land surface.
Some PTt paths that rocks might experience are shown qualitatively in Fig. 2. In each case we assume that the burial phase is rapid compared with the time required for thermal equilibration; this is reasonable for nappe piles emplaced at plate tectonic rates (e.g. Oxburgh & Turcotte, 1974). Under these circumstances, a rock initially on the land surface would follow a path like A in Fig. 2, where there is a rapid increase in pressure without a corre-spondingly great interest in temperature—in the cases investigated here there is in fact no temperature increase at this stage. The dotted line in Fig. 2 indicates the geotherm that would be reached if the thickened crust were allowed to relax to steady state.
We may next suppose that there is a phase during which the thickened crust is heated with little or no influence of erosion; as remarked above, this phase appears to have lasted over 20 Myr in the Eastern Alps but this need not generally be so—such a phase may not occur at all, or may last considerably longer than 20 Myr. It is terminated by the onset of erosion, or some other form of exhumation, that results in the buried rock returning to, or close to, the land surface; in contrast to the burial phase, this portion of the path may take a time that is much shorter than, or comparable with, the time required for the thickened crust to approach thermal steady state.
geotherm in equilibrium with heat supply to the thickened crust
FIG. 2. Schematic PTt paths of rocks undergoing rapid burial on path A, followed by uplift histories that are progressively longer from path C to path D to path E (see text). The dotted line indicates a geotherm that is in
PT
t
PATH
S
FO
R
EROSION
:
CRUS
T
THICKENE
D
B
Y
THRUSTIN
G
HEA T SOURC E DISTRIBUTIO N 1 II I E o o o 10 . 30 . 50 . d 7< i \ \ > -^ TEMPER A TU» E AX.(K
* \ \ B lEMPtRATURE/OE C C \ \i
TEMPERATURE/DE G C 2« . 4 1s
TEWWMURE/OE C Cft
-o 70 m to to C ?3 m i H cn 2 -a m 70 H C m i Hi
m H XPaths AC, BD and BE illustrate PTt paths of increasing duration. Path AC has no period of heating-without-erosion and a rapid phase of erosion; the rock experiences its maximum temperature at its maximum burial depth and returns to the surface along a path close to its burial path—the time scale for the whole process has been so rapid that little heating has occurred.
Path AD has a phase of heating with little erosion (at B) and then a moderate rate of erosion; the rock undergoes more heating at, or near, its maximum burial depth but also, because of the slower rate of erosion, it continues to rise in temperature while it is being eroded and experiences its maximum temperature at a lesser depth than its maximum burial depth.
Path BE includes a still longer phase of heating with little erosion, so that the rock has nearly reached the equilibrium profile shown by the dotted line in Fig. 2 before appreciable erosion starts, and it ascends along a PT path that is close to the new steady state geotherm. If erosion had been slightly faster, the accompanying decompression could have caused path BE to cross to the high temperature side of this geotherm.
Clearly, other combinations of paths are possible, and it is the purpose of this paper to investigate the range of paths that may occur in continental collision zones. Figs. 3 to 8 show a selection of PTt paths for different combinations within the parameter ranges 1 to 4 (section 3), superimposed on glaucophane—jadeite, kyanite—sillimanite and andalusite— sillimanite facies series fields, the PT locations of which are discussed in Part II (Fig. 1).
Figs. 3 to 5 show the PTt paths for rocks within a thickened continental crust having initial temperatures corresponding to the emplacement of a single thrust sheet of thickness 5 = 35 km (equation 2; Fig. 3), or a doubling of the crustal thickness (equation 3; Fig. 4, and to doubling of the whole lithosphere thickness (equation 3a, Fig. 5). In each case there is a 20 Myr timelapse before the onset of erosion, and the pile is eroded by E = 35 km (E2, parameter range 3) in the ensuing 100 Myr (77, parameter range 4); the thermal profiles are governed by conductivities and heat source distributions given in parameter ranges 1 and 2 (see section 3 for all parameter ranges).
5.2. The heating phase
The forms of the hypothetical paths described above depend on the interaction between two processes with different rates, the thermal relaxation of a temperature profile out of equi-librium with its heat supply, which tends in this case to raise the temperature of an individual rock, and the erosion of the system, which tends to cool the rock.
The time scales for the two processes involved may be estimated as follows. A measure of
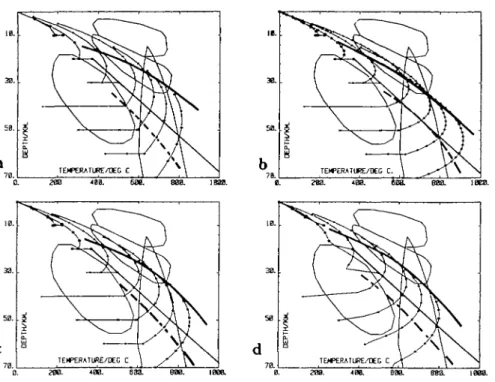
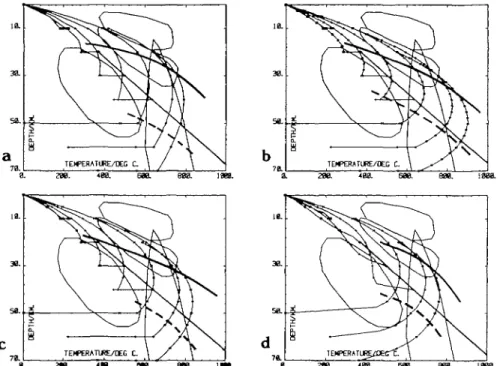
Flo. 3. Pressure-temperature-time (PTt) paths for rocks involved in a continental thickening episode resulting from the emplacement of a single thrust sheet (Fig. la, d, g). In each case the thrust sheet is of thickness 35 km, there is a 20 Myr period between the emplacement of the thrust sheet and the onset of erosion, and erosion of 35 km takes place at a constant rate over the subsequent 100 Myr. The PTt paths for rocks initially buried at 10, 20, 30, 40, 50, 60 and 70 km below the surface are shown by the thin solid lines with symbols at 10 Myr intervals. The PT locations of the glaucophane-jadeite, kyanite-sillimanite and andalusite-sillimanite facies series (Fig. li and Fig. 2 of Part II) are indicated by the enclosed areas. The wet and dry solidi for pelite melting (Thompson & Tracy, 1979, Fig. 5) are also shown. Paths are illustrated for Heat Source Distribution I (Figs. 3a, d. g), II (Figs. 36. e, h) and III (Figs. 3c, / , /) with conductivities Kl (1-5 W m"1 k"1; Figs. 3a, b, c),
K2 (2-25 W m~' k"1; Figs. 3d, e, f) and K3 (3 W m"1 k"1; Figs. 3g, h, i). See section 3 for further information on
Heat Source and Conductivity parameter ranges. Heavy lines on the paths of Fig. 3d, e, f show the range of conditions for which each path lies within 50 °C of the maximum temperature it attains. It will be noted that these resemble facies series in their general form of PT orientation. Medium lines indicate the pre-shortening geotherms
PT t PATH S FO R EROSIO N O F CONTINENTA L CRUS T THICKENE D HOMOGENEOUSL Y HEA T SOURC E DISTRIBUTIO N I 11 1
_
©
E o 3 o8
T 3 7* m C O C O C 7* m i H m 2 m > H C ?o m i H 2 m H X to ® FIG . 4 . P7 7 path s fo r rock s involve d i n a thickenin g episod e o f homogeneou s shortenin g b y a facto r o f 2 (Figs . 16 , e, h). Symbol s an d Hea t Sourc e Distributio n a s i n Fig . 3 .the time involved in the decay of a thermal perturbation of scale length / in a medium of thermal diffusivity K is given by
te fa P/K (10)
The thermal diffusivities corresponding to conductivities Kl to K3 (parameter range 1, sub-section 3.1) are 6 x 10~\ 9 x 10~7 and 1-2 x 10"6 m2 s"1 respectively, or approximately
19, 28 and 38 km2 Myr~'; the scale length for the thermal perturbation is the lithosphere
thickness (see Appendix B).
The time scale involved in the erosional process is simply
tt = d/u (11)
where d is the length scale for the erosion and u is the erosional velocity.
The effects of this competition may be seen clearly in Figs. 3 to 5; when the heat supply is low and the conductivity is high (Heat Source Distribution I and conductivity 3 W m~' K~'; Figs. 3g, 4g, 5g) the temperature rise that the rocks experience is least, and when the heat supply is high and the conductivity low, the temperature rise at a given time is highest (Figs. 3 c, Ac, 5c).
This can be expressed in a more quantitative fashion: compare, for example, the PTt paths for rocks initially buried at a depth of 60 km with temperature profiles governed by Heat Source Distribution II (Figs. 3b, e, h; 4b, e, ft, 5b, e, h). The scale lengths / and d for the thermal perturbation and the erosion are the same for each case, as are the erosional time scale and the heat source distribution; the differences in the profiles are produced by variation in conductivity, and hence in diffusivity.
If we consider only the decay of the thermal perturbation, and neglect erosion for a moment, we should expect to be able to compare media having identical geometries but differ-ing diffusivities by examindiffer-ing temperatures at the same dimensionless time, r, given by
r=Kt/l2 (12)
(e.g. Carslaw & Jaeger, 1959; see equation 6b: see Appendix B for a specific example). All other things being equal, temperatures at the same dimensionless time, r, should then be inversely proportional to conductivity, and indeed this is seen to be the case in Figs. 3 to 5.
Compare the initial temperature distribution in Figs. 3b, 4b and 5b with those in Figs.
3h, 4h and 5h; the conductivity in Figs. 3b, 4b, 5b is half that in Figs. 3h, 4h, 5h and hence
the initial Centigrade temperatures in the former are twice those in the latter (for 0 °C surface temperature: equations 1 and 2). As the diffusivity in Figs. 3b, 4b, 5b is also half that in Figs. 3h, 4h, 5k, we should expect the thermal profile to develop half as fast in the former as in the latter. For example, an elapsed time of 20 Myr with a diffusivity of 6 x 10~7 m2 s~'
(Figs. 3b, 4b, 5b) is the same dimensionless time (equation 12) as 10 Myr with a thermal diffusivity of 1-2 x 10~6 m2 s"1 (Figs. 3h, 4h, 5h). Comparing Figs. 3b, 4b, 5b with Figs.
3h, 4h, 5h, we can see that the Centigrade temperatures in Figs. 3b, 4b and 5b after 20 Myr
(at the onset of erosion) are twice those in Figs. 3h, 4h, 5h after 10 Myr. The same remarks apply to Figs. 3a, g; 3c, i; 4a, g; 4c, i; and 5a, g; 5c, i; similar relations hold for other pairs of figures with less convenient conductivity ratios.
Appendix B shows that this heating phase may be regarded in terms of the decay of a thermal perturbation that is set up by the collision event, and that for many plausible thicken-ing geometries this perturbation may be approximated in a form that gives a simple analytical solution and that has a scale length of the lithosphere thickness and is of a magnitude comparable with the temperature difference between top and bottom of the crust for the undisturbed geotherm (equations B8-B13, Fig. Bl). These temperature perturbations all
PT
t PATH
S
FO
R
EROSION
: WHOL
E
LITHOSPHER
E
THICKENE
D
HEA T SOURC E WSTRBUTO N I to C\j o COI
70 m on en C m i H m 2 T3 m 70 > H C 70 m i H5
H S enrn FIG . 5 . PTt path s fo r rock s involve d i n a thickenin g episod e i n whic h th e entir e lithospher e i s thickene d (Fig . \c,f, i). Symbol s an d Hea t Sourc e Distributio n a s i n Figs . 3 an d 4 .decay with the same time constant (equations B14-B17); the principal difference between the solutions lies in the different steady state temperature regimes that would be supported in the thickened continental lithosphere, and in the magnitudes of the perturbations produced by the thickening event.
Fig. Bl shows these differences schematically for the three geometries of thickening discussed in section 2. We can illustrate the differences between these geometries by imagining doubling the crustal thickness in each of these fashions for the Heat Source Distribution II and a conductivity of 2-25 W m~' K~' (Figs. 3e, 4c, 5e).
For thickening by thrusting (equation 2, Fig. 3e) the scale for the temperature perturbation (Fig. Bla, b) is 1030 °C (equations B8, B9) and the steady state temperature at the base of the crust (70 km)—if infinite time were available for thermal relaxation—would be 1600 °C. The equivalent temperatures in the other two cases (equation 3, Figs. 4e, 5e), where the crust is thickened homogeneously, are 770 °C (equations B8, B10) and 1330 °C. In each case, the base of the crust immediately after thickening is 570 °C. (See also Fig. 1.)
The average temperature perturbation is approximately the same in each case (Fig. Bl) but the steady state geotherm is hotter in the thrusting case than in the case of homogeneous thickening. This means that the absolute temperatures attained during metamorphism are generally higher in the thrusting case than in the case of homogeneous thickening. These differences are not profound, however, and this emphasizes the results of previous numerical modelling (e.g. Bickle et al. 1975; England, 1978) that the initial heat content of the thickened crust plays a'small role in determining the evolution of thickened continental crust, compared with that played by the heat source distribution. In none of the cases are the temperature gradients in the lower portion of the lithosphere significantly affected within the short timespans (20-100 Myr: Kt/l2 ~ 0-025-0-125) before erosion starts to play a significant role
in the thermal development. In consequence, the most important differences are between the models illustrated in Fig. 5 and those in which only the crust is thickened (Figs. 3 and 4). When the whole lithosphere is thickened the conductive heat supply to the base of the crust is correspondingly diminished; as the time scale for the evolution of the orogenic belt is less than the thermal relaxation time of the thickened lithosphere, this evolution takes place in a low heat flow environment. As is shown in Fig. Bl, this case is analogous to the case in which the crust only is thickened but an increased heat flow is applied to the base of the lithosphere— the form of the temperature perturbation is the same in each case and the influence of the basal heat flux on the thermal evolution of the crust is negligible. Appendix B discusses simple expressions that may be used to estimate rates of heating in the thickened pile during this phase.
Even after erosion has started, a buried rock will continue to rise in temperature until the rate of cooling imposed by its approach to the land surface overcomes the rate of heating due to the decay of the initial thermal perturbation. Suppose that a rock is exhumed from an initial depth of burial z0 at a velocity u, the length of time taken for the rock to reach the
surface is zju while a time scale for conductive relaxation is approximately zl/x (equation 10). The ratio of these two time scales is the Peclet number for the exhumation:
Pe = uzjK (13)
The significance of the Peclet number may be seen re-writing equation (6b):
8v' <9V 8v'
PRESSURE-TEMPERATURE-TIME PATHS. I 913
where v' = v/v0; z' = z/z0; t' = xt'/zl; u' = u/u0; b! = hl2/Kv0 and Pe = UOZO/K, where UQ, Z0 and v0 are appropriate reference velocity, length and temperature, respectively. The Peclet
number multiplies the term expressing the advection of heat by motion of the rocks, and its magnitude determines the relative importance of the upward transport of heat by the eroding rock pile over the diffusion of heat within the pile. If the Peclet number is large, an eroding rock will approach close to the surface in a time interval that is short compared with the time for heat to diffuse from it, and it will thus decompress nearly isothermally—or rise in temperature if it has internal heat generation. Conversely if the Peclet number is very small, the upward transport of heat by the moving rock is negligible—any temperature perturbation produced by the motion of the medium diffuses away in a time short compared with that taken for the rock to reach the surface, and the rock will rise along a path that is close to the ambient geotherm (Fig. 2, Path BE).
We can see, by putting values of 35 km per 100 Myr for u, 35 km for z0 and 30 km2 Myr~'
for K in equation (14), that the Peclet number is of order one for the erosional process, and consequently that no simplification can be made by assuming either a large or a negligible value for Pe. The range of Peclet number that arises from parameter ranges 1, 3 and 4 (section 3) is between 0-05 and 2-6.
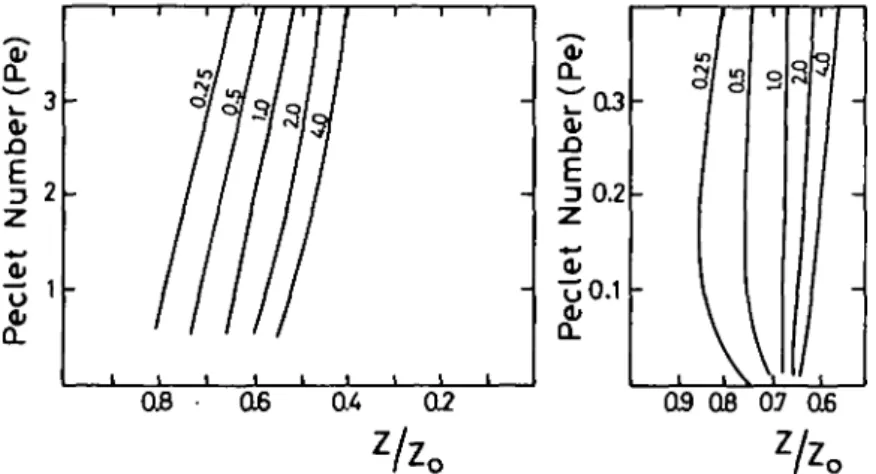
In Appendix C we present an analytical approximation, in the spirit of Appendix B, to the thermal development of the uplift portion of the PTt path; its product is an estimate of the depth at which a rock begins to cool on its ascent to the surface as a function of Peclet number (equation 14) and the total internal heat generation within the system. The relations given in Appendix C permit calculation of the approximate level during uplift that a rock will reach before the diffusion of heat towards the cooler land surface outweighs the temperature increases due to the decay of the initial temperature perturbation.
The good agreement between the levels calculated using this simple approach and those at which cooling starts in the numerical calculations suggests that the form of simplification used in Appendix C is a useful one for the systems we investigate. In it, we assume a homogeneous distribution of heat production and simple form for the initial geotherm, and this re-emphasizes the importance of the total heat production, the basal heat flux and the erosion rate in relation to such factors as thickening geometry or distribution of heat flux.
The agreement is not excellent and, in particular, we cannot calculate entire PTt paths by this approach; the process outlined in Appendix C does, however, permit the calculation of approximate PTt paths whose validity can be assessed by comparison with the exact ones illustrated in this paper, and it enables us to identify the factors that govern the development of PTt paths.
53. Influence of varying erosional parameters
Figs. 3 to 5 illustrate the influence of changing conductivity and heat source distribution in models for which the thickening geometry and erosional timespan are fixed. We now discuss the influence of changing the amount of thickening and the erosional timespan. As we cannot illustrate all the possible PTt paths within our ranges, we have chosen the thrust thickening model of Fig. 3c as a reference model. This model has values in the middle of each of the parameter ranges (section 3) and we consider variations in PTt paths about this model, caused by changes in erosional parameters.
Fig. 6 shows the influence of changing the time scale for the erosion with the length scale remaining fixed at 35 km; Fig. 6c shows the reference PTt paths (Fig. 3e) and Figs. 6a, 6b and 6d show respectively the effect of doubling the erosion rate (decreasing the erosional timespan to 50 Myr), halving the erosion rate (doubling the interval to 200 Myr) and keeping the erosion rate the same but removing the interval of 20 Myr of no erosion.
PTt PATHS FOR TIMESCALES 50 - 200 Myr, LENGTHSCALE 35 km
10. 33. •id 7fl £ Q. & ^ ^ ' \ TEW^RATUR£/OEG C \ / | ^ NFIG. 6. Influence of changing erosional time scales on PTt paths, where in each case the thickening is by a single thrust of thickness 35 km and profiles are governed by Heat Source Distribution II and a conductivity of 2-25 W m~' K~'. Symbols as in Fig. 3. a. Erosion in 50 Myr, starting 20 Myr after thrusting, b. Erosion in 200 Myr, starting 20 Myr after thrusting, c. Erosion in 100 Myr, starting 20 Myr after thrusting (Fig. 3c). d. Erosion in
100 Myr, starting immediately after thrusting.
Shortening the erosion timespan (Figs. 6a or 6d) results in less total heating of the buried rocks: for example, the rocks buried initially at 40 km reach a maximum temperature of around 605 °C in Fig. 6c, but only get to 580 °C in Fig. 6a and 540 °C in Fig. 6d. Note that the initial heating phase is the most rapid, so that a greater reduction in maximum tempera-ture arises from removing the 20 Myr of no erosion (Fig. 6d) than from retaining this featempera-ture, while doubling the erosion rate once it has started (Fig. 6a). This is emphasized in Fig. 6b, where increasing the time interval for erosion to 200 Myr only results in a maximum temperature of about 645 °C for a rock at the same initial burial depth.
The level at which the rocks begin to cool on their ascent path changes with the duration of the erosional episode; the rocks initially buried to a depth of 70 km reach 855 °C at 50 km before starting to cool in Fig. 6c, reach 815 °C at 45 km when the erosion rate is doubled (Fig. 6a) and 915 °C at 54 km with the erosion rate halved (Fig. 6b). Fig. 6a" shows that removing the 20 Myr delay in the onset of erosion does not significantly affect the level at which rocks begin to cool as they approach the surface (compare Fig. 6c). This is consistent with the simple approach in Appendix C, where the depth at which cooling occurs depends only on the heat sources and Peclet number for the erosion.
The relatively narrow range of maximum temperatures attained (815 °C to 915 °C from an initial temperature of 567 °C) and of depths at which the rocks attain these maximum