HAL Id: hal-02083749
https://hal.archives-ouvertes.fr/hal-02083749
Submitted on 29 Mar 2019
HAL is a multi-disciplinary open access
archive for the deposit and dissemination of
sci-entific research documents, whether they are
pub-lished or not. The documents may come from
teaching and research institutions in France or
abroad, or from public or private research centers.
L’archive ouverte pluridisciplinaire HAL, est
destinée au dépôt et à la diffusion de documents
scientifiques de niveau recherche, publiés ou non,
émanant des établissements d’enseignement et de
recherche français ou étrangers, des laboratoires
publics ou privés.
Decision-Making about Interdependent Risks
Franck Marle, Hadi Jaber, Catherine Pointurier
To cite this version:
Franck Marle, Hadi Jaber, Catherine Pointurier. Organizing Project Actors for Collective
Decision-Making about Interdependent Risks. Complexity, Wiley, 2019, 2019, pp.1-18. �10.1155/2019/8059372�.
�hal-02083749�
Research Article
Organizing Project Actors for Collective Decision-Making about
Interdependent Risks
Franck Marle ,
1Hadi Jaber,
1,2and Catherine Pointurier
31Laboratoire Genie Industriel, CentraleSup´elec, Universit´e Paris-Saclay, Gif-sur-Yvette, France 2College of Engineering and Technology, American University of the Middle East, Kuwait
3CEA-DAM (Commissariat `a l’Energie Atomique – Direction des Applications Militaires), Arpajon, France
Correspondence should be addressed to Franck Marle; [email protected]
Received 9 October 2018; Revised 28 January 2019; Accepted 14 February 2019; Published 20 March 2019 Guest Editor: Jean Botev
Copyright © 2019 Franck Marle et al. This is an open access article distributed under the Creative Commons Attribution License, which permits unrestricted use, distribution, and reproduction in any medium, provided the original work is properly cited. The way project actors are organized is crucial in determining how they will be able to collectively cope with nontrivial complex problems and risks. Current project organizations are generally based on single-criterion decomposition, whether product, process, or organization based. The proposed approach forms complementary clusters of actors based on the interdependencies between the risks they manage. More precisely, distinction has been made between the interdependencies connecting two risks that are owned by different actors and those owned by the same actor. We argue that interdependency between two risks managed by the same actor is less dangerous, meaning that clustering algorithm is tailored to distinguish mono- and biactor risk interdependencies. The complementary structure offered by interdependency-based clustering tends to put together strongly interconnected actors, albeit they were often initially not grouped together. It increases the likelihood of a better communication, coordination, and collective decision-making in complex situations. Some risks remain out of proposed clusters and are declared transverse, which means that their owners act as information hubs and are not involved in a single cluster. An industrial application is presented with operational results and perspectives for further work are drawn from it.
1. Introduction
Project risks have to be properly managed in order to mitigate as best as possible their occurrence and the impact that they may have on the project, either on its process, organization, or its result/outcome [1]. Potential events may be seen as potential changes in the project. Each change is accompanied by intended and unintended impacts, both of which being likely to propagate. Such risk propagation (called domino, cascade, butterfly, and snowball effects) causes uncertainty in project domains such as cost, time, and quality and thus needs to be predicted and controlled. However, single-domain change propagation methods overlook most dependencies across domains and suffer of reliability due to these cross-boundaries dependencies. It has been studied that global anticipation and protection strategies are better than local single-domain ones [2–4]. This is why we prefer modeling an element that can embrace all domains, such as project risk.
It is a challenge for project organizations to coordinate the interactions between system components, project objec-tives, project activities, and actors [5, 6]. Interdependencies between technical and human systems increase global project risk because local problems in one subsystem may propagate to other connected subsystems. The way interdependencies are modeled and treated is crucial to analysis and decision capacities [7, 8], notably for anticipating potential project behavior and avoiding potential delays and overruns [9]. Otherwise, there is a significant risk of poor coordination and locally optimal decisions [10]. Moreover, interdependen-cies between the actors involved in the risk management process create difficulty when proposing an appropriate Risk Breakdown Structure and project risk organization [11]. This is all the more important since actors are generally assigned as risk owners, meaning that they have to manage risks. This includes monitoring their characteristics and implementing preventive or corrective actions. Whatever the
Volume 2019, Article ID 8059372, 18 pages https://doi.org/10.1155/2019/8059372
criterion for dividing the list, there will always be a large amount of interdependencies between risks and thus risk owners’ interdependencies that remain outside of official organizational boundaries. Due to the multiple dimensions a project has to consider (time, cost, quality, and more and more environmental and societal issues, health, safety, security, etc.), it is natural to have difficulties to break it down so that its organizational structure is aligned with actual interactions. In fact, it is even impossible. However, the behavior of a project strongly depends on its structure [12– 15], and notably the way transverse interactions are managed. Classical organizations are generally based on decomposition into homogeneous elements, while our approach is based on interdependencies.
This is all the more important when two different actors own both risks. The main originality of this work is thus to differentiate interactions between two risks, depending on the fact that they are owned by one or two different actors. Both types of interactions do not have the same risks in terms of coordination, since a single actor owning two interdependent risks just has to coordinate with herself. Thus, the focus of this article is on proposing a plan for complementary project risk management organization to account for interdependencies between actors and mitigate risks due to the complex structure of the project. An organization is an adaptive and evolving system that must correspond to the complexity of the situation being managed [16].
To do this, clustering aims at maximizing the amount of interactions within clusters, in order to improve infor-mation exchange and coordination between actors within each cluster. The way the decisions may be collectively made depends on the way project actors are put together into meaningful clusters, clusters that help to capture current and possible future complexity of the project. Giannocaro and coworkers suggest that the resilience of a team depends on the density of its interactions [17], confirming our aim to cluster risk owners depending on the interdependencies they have. That means that clusters are interdependence-based, and then are likely to be heterogeneous, instead of being similarity-based. It naturally puts together actors who are initially assigned to different entities that may
be managed as silos. This involves the following: (1) an
improvement in how individual members respond to risk in their activities once they are grouped with
intercon-nected people;(2) a higher level of coordination and
col-lective behavior between multidomain and multitimeframe decisions.
The clustering methodology in this paper is tailored and applied to the specific context of a nuclear installation construction project. The remainder of the paper is as follows. Sections 2 and 3 introduce the strategy for formulating and solving the clustering problem. Section 4 presents the case study, with an analysis of existing situation and clustering results. Sections 5 and 6 present managerial implications of clusters and a global discussion about the results and their limits. Conclusions and perspectives are drawn in Section 7.
2. Reshuffling the Organization of Project
Risk Owners
This section introduces first literature about clustering and then the problem formulation, consisting of description and formulation of objective function and constraints.
2.1. Related Work. Clustering consists of breaking down a
set of elements down into smaller, more manageable groups, according to one or several parameters [18]. Clustering meth-ods may use algorithms to attempt finding an optimum [19, 20], or heuristics for proposing good enough solutions [21– 24], like, for instance, genetic algorithms [25–28]. Clusters can be proposed using top-down or bottom-up (respectively, descendant or ascendant) approach, which is our choice in this work. They can be built considering local (individual) or global indicators [29]:
(i) Locally, the methods take into account similarity between the elements (called vertices), and may focus on particular elements which are representative of the group, called centroids [30]. On the other side, clusters may be built according to dissimilarity or distance between elements [31–37], with elements which are least central (the opposite of centroids) or most between [38–41]. Different types of mea-sures exist, like modularity [42–48], and eigenval-ues/eigenvectors [15, 49–52].
(ii) Globally, the methods propose clusters and assess their performance (called cluster-based assessment, or cluster fitness measure). They can be more or less supervised, notably on the number of clusters k, which is required for instance in the k-means method [53–56]. Cluster density has been developed to par-tition the initial graph into smaller ones, depending on local density values of each cluster [57–61]. Cut size-based measures allow the quantification of the dependence of a subgraph to the rest of the graph [62, 63], with several indices, like for instance Dunn index [64], Davies-Boulding index [65], Xie and Beni’s validity index [66], and Bezdek’s partition coefficient and partition entropy [67, 68].
(iii) They can be based on crisp or uncertain values, using for instance fuzzy clustering [28, 69–72] and spectral clustering [28, 30, 73–75].
In terms of application, clustering has been and is still used in multiple engineering and design problems to group either product-related elements, processes or organizational elements [76, 77]. These elements are generally related to one of the main project domains, products, processes, or organizations. Product clustering is generally performed to determine and possibly increase product modularity because modular architectures are supposed to have many advantages [78–80]. In terms of process clustering, many studies have attempted to cluster activities, knowing that the activities may or may not be coupled [81–85]. Organizational clustering has also been examined in several studies, either as mitigating
communication risks or seizing creativity opportunities [86– 89]. The clustering of specific multidomain elements, like decisions, deliverables, and risks has also been developed by Marle and coworkers [90–95]. The originality is then twofold: first, we consider interdependencies between elements that may be of different nature (a risk may be related to project objectives, to time, cost, to a product component, to an actor, to a company, to a project task or to an activity related to product recycling 20 years later, etc.). Second, we consider differently an interaction between two risks depending on the fact that one or two actors manage this interaction. The first parameter changes the way we model and gather data, but they are inputs to clustering process. However, the second point involved modifying the objective function and the way clusters are appreciated a posteriori by the decision-maker. This is the object of the following paragraph to describe how the problem is formulated.
Interdependency strength is the main driver for reshuf-fling project organization using clustering. According to Worren, interdependencies exist when actions in one subunit of the organization affect important outcomes in another subunit [10]. They require frequent coordination and infor-mation exchange and have to be managed. In order to propose clusters of risks, interdependencies are modeled using an adjacency matrix approach, the properties of which being widely studied [96–99]. This matrix-based approach is justified by the existence of numerous developments for mod-eling, analyzing, and grouping elements in projects, notably engineering and design projects [100–102]. According to several authors, project elements may be [102, 103]
(i) dependent (sequential if temporality is a parameter of the relationship)
(ii) independent (or parallel) (iii) coupled (or reciprocal)
(iv) conditionally connected (contingent relationship) Another type of interdependence described by Thompson is the pooled interdependence, where each element renders a discrete contribution to the whole and is supported by the whole [103]. Worren introduces 5 types of interdependencies [10]: the commitment, the governance, the activity, the resource, and the social interdependencies. Marle and Vidal introduced 5 types of interdependencies [104, 105]:
(i) the hierarchical link, typically found in WBS or other trees
(ii) the contribution link meaning that one element con-tributes to the advancement of the other one
(iii) the sequential link if the output of one element is used as an input of the other one
(iv) the influence link if a decision or a change in element 1 may involve a change in element 2
(v) the exchange link if the two elements have an infor-mation flow, possibly without influence one upon another
In this work, in the context of risk interdependency, we choose to use an oriented cause-and-effect interdependence, meaning that the occurrence of a cause risk may influence the occurrence of the effect.
2.2. Problem Formulation. The problem is first described;
then its objective function and constraints are presented.
2.2.1. Problem Description and Nomenclature. For reading
convenience, matrix-related elements are in bold, and vari-ables are in italics. As described in the Introduction, a project is composed of numerous and diverse elements X, owned by actors A, and characterized by numerous and diverse interactions connecting elements I (X, Y). Let’s define here two types of elements, R as the set of risks identified for the project at the moment of the study, and G as the set of groups that break the existing project organization down into smaller
pieces. There are NR risks{R} identified and managed and
NG groups. A is the set of actors who are assigned to these risks as owners. A is a subset of the global set of project actors. NA is the number of actors in the set A, i.e., the number of risk owners.
The first assignment interaction I (A, G) is the affiliation of actors Ai to current groups Gj. This initial organization is
modeled as a NA x NG matrix calledAG, consisting of actors
{Ai} assigned to groups {Gj}.
The second type of interaction I (A, R) is defined as
the assignment relationship between actor Ai and risk Rj,
meaning that Ai owns Rj. Actors may be assigned to more
than one risk; risks must have one and only one risk owner.
This is modeled as a binary NA x NR matrixAR.
Last, the risk interaction I (R, R) is considered here as
a potential cause-effect relationship. May Rioccur, it has a
nonnull probability to trigger the occurrence of Rj. This is
modeled as I (Ri,Rj), with an estimated value corresponding
to a likelihood more than a pure mathematical probability.
RR is an NR x NR matrix with each cell RRj1,j2(1≤ j1, j2 ≤
NR) representing the interaction strength between risks Rj1
and Rj2, determined by expertise or less often by experience.
These are inputs provided by the decision-maker, generally either project manager or risk manager.
The number of clusters is a variable, called NC. It may be defined by the decision-maker before the analysis. For instance, in [86], decision-maker tested a configuration with the same number of clusters than the initial number of groups NG. If the decision-maker cannot or does not want to influence the analysis, unsupervised clustering is useful to give an idea, an order of magnitude of a relevant number of clusters. The first output of clustering is the affiliation of risks
to clusters, modeled as a binary NR x NC matrixRC. RCj,kis
equal to 1 if Rjbelongs to cluster Ck, zero otherwise.
INTRA indicator counts intracluster interactions only.
Similarly, the INTER indicator is defined as the total value
of interactions crossing clusters.RC is the decision variable.
Details will be given further, but the main idea of clustering is to minimize INTER or maximize INTRA.
Knowing the assignments of actors Ai to risks Rj, and
R1 R2 R3 R4 R5 R6 R7 R8 R3 R6 R8 R1 R2 R4 R5 R7 R1 A2 R3 R2 A4 R6 A2 R3 A5 R8 R4 A1 R1 R5 A1 R2 A4 R6 A3 R4 R7 A3 R5 R8 A5 R7 G1 G2 C1 C2 A1 A3 A5
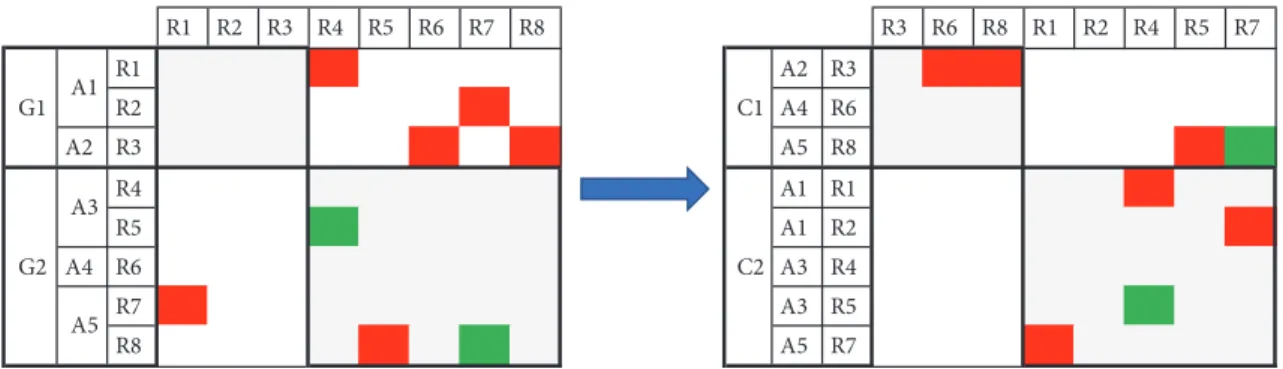
Figure 1: Illustration on a simple example of the difference between initial and clustered project organizations.
actors Ai to clusters Ck is then obtained by multiplying
both matrices AR and RC. This gives the AC matrix, for
assignment of actors{Ai} to clusters {Cj}. This second and
indirect output of the clustering process corresponds to the reshuffled organizational structure.
The main originality of this work is thus to make a difference between a risk interaction where risks are owned by two different actors (BAI for biactor interaction) and a risk interaction where risks are owned by the same actor (MAI for monoactor interaction). Both types of interactions do not have the same risks in terms of coordination, since a single actor owning two interdependent risks just has to coordinate with herself. Two parameters are then simultaneously consid-ered, the INTRA/INTER nature of the risk interaction, and the MAI / BAI nature of actors’ interaction. If two risks are in the same cluster, it counts as INTRA, otherwise INTER. If these two risks are managed by the same actor, it counts as MAI, otherwise BAI. There are thus 4 cases. For example, if risk 1 owned by actor 1 belongs to cluster 1 and risk 2 owned by actor 2 belongs to cluster 1, then the interdependency between
risk 1 and risk 2 is counted as𝐼𝑁𝑇𝑅𝐴|BAI(INTRA since risks
R1 and R2 belong to cluster 1, and BAI since risks are owned, respectively, by actor A1 and A2).
This means that the difference will be made, particu-larly for cross-clusters interactions (INTER), between biactor
interactions (𝐼𝑁𝑇𝐸𝑅|BAI), the most dangerous ones, and
monoactor interactions (𝐼𝑁𝑇𝐸𝑅|MAI), which appear less
dangerous albeit cross-boundaries. MAI require less energy and present lower coordination risk than an interaction with another actor, within the same cluster or not [106].
To give an illustration of the potential interest of such a reconfiguration, a fictitious example is given with NR=8, NA=5 and NG=NC=2. Let us consider a fictitious project
with a set of 8 risks{R1..R8}. Five actors manage these risks.
A1 owns R1 and R2, A2 owns R3, A3 owns R4 and R5, A4
owns R6 only, and finally A5 owns R7 and R8. Actors are
currently affiliated to two groups, respectively, A1and A2in
group G1, and A3, A4, and A5in group G2. This means that
G1contains 3 risks, assigned to 2 actors. G2contains 5 risks
and 3 actors. Eight risk interactions have been identified. As shown in Figure 1, 5 of them are outside group boundaries, meaning that they are counted as INTER. Moreover, they are between different actors, BAI (in red on Figure 1), so in the
end we have 5𝐼𝑁𝑇𝐸𝑅|BAIinteractions. There is no interaction
between risks managed by actors affiliated to group G1. The 3
last interactions are within G2boundaries, meaning that they
are counted as INTRA. However, they do not have the same
nature, since two are𝐼𝑁𝑇𝐸𝑅|MAI(in green on Figure 1) and
one is𝐼𝑁𝑇𝐸𝑅|BAI(the R8-R5interaction which connects A5
and A3).
A fictitious clustering is proposed with NC=NG=2. The same structure is proposed, to make results more comparable,
with a 3-risk cluster C1and a 5-risk cluster C2. Two elements
illustrated in Figure 1 are important. First, only 2 interactions remain outside clusters boundaries. Second, one of these
INTER interactions is between R7and R8, which are owned
by the same actor A5. This means that this interaction is
𝐼𝑁𝑇𝐸𝑅|MAI, which is considered as far less dangerous than an
𝐼𝑁𝑇𝐸𝑅|BAI. The conclusion is that we started with a situation
where 5 interactions (on a total of 8) were dangerous (in terms of possible bad communication and coordination) to a situation where only one interaction is dangerous, since the
other INTER interaction is in fact𝐼𝑁𝑇𝐸𝑅|MAI. The originality
of distinguishing MAI and BAI is that we can allow the
algorithm to increase the number of𝐼𝑁𝑇𝐸𝑅|MAIinteractions.
In the end, interdependencies which are simultaneously
INTER and BAI are considered as the main source of poor
communication and coordination risks and will be the object of our minimization effort, as described as follows.
2.2.2. Objective Function. The INTRA function is defined as
the sum of all risk interactions (fromRR matrix) included
within each cluster (fromRC matrix), as described in
𝐼𝑁𝑇𝑅𝐴 (RC) = ∑ 1≤k≤NC ∑ 1≤j1,j2≤NR RCj1,k∗ RCj2,k∗ RRj1,j2 (1)
Defining TVI as the total value of interactions, INTER can be obtained as follows:
𝐼𝑁𝑇𝐸𝑅 (RC) = 𝑇𝑉𝐼 – 𝐼𝑁𝑇𝑅𝐴 (RC) (2)
Knowing the affiliation of risks to clusters, theRR matrix
is decomposed as follows:
WithRR|INTRAi,j =RRi,j if Ri and Rjbelong to the same cluster
= 0 otherwise.
And (RR|INTRAi,j = RRi,j if Ri and Rj belong to
different clusters
= 0 otherwise.
AA|INTER is thus obtained by considering only
interde-pendencies which are outside the clusters in the clusteredAA
matrix.
AA|INTER= AR ∗ RR|INTER∗ RA (4) Finally, the objective function is thus to minimize
𝐼𝑁𝑇𝐸𝑅|BAI, where the major coordination risks exist,
intro-duced in
𝐼𝑁𝑇𝐸𝑅|BAI= ∑
(i ̸=j)RR| INTRA
i,j (5)
2.2.3. Problem Constraints. Once the objective function is
given, three constraints have been identified. The first one is
the maximal number of risks per cluster Ck, called max(R |
Ck): ∀k ∈ [1 ⋅ ⋅ ⋅ 𝑁𝐶] , 𝑁𝑅 (𝐶𝑘) = ∑ 1≤j≤NR RCj,k ≤ max (R | Ck) (6)
where NR(Ck) is the number of risks in the kthcluster.
Second, there are a maximal number of clusters a risk can
be simultaneously assigned, called max(CR):
∀j ∈ [1 ⋅ ⋅ ⋅ NR] ,
𝑁𝐶 (𝑅𝑗) = ∑
1≤k<NC
RCj,k≤ max (C | R) (7)
where NC(Rj) is the number of clusters to which risk Rjis
assigned. This constraint may simultaneously allow for some overlaps when they are justified, while keeping under control the number of assignments for the actors with multicluster
risks. A reasonable value for max(C | R) is 2. The justification
of this constraint is given below.
By testing on multiple configurations (changing con-straints), some risks were assigned exactly in 50% of cases to one cluster or another. We decided then to allow them to participate in both clusters, “participate” meaning that the actor who owns the risk will participate to both meetings. This means that interactions that were previously counted as
INTER are now INTRA because this risk/actor belongs to the
cluster, so it is normal and not a mistake. On the other side, overlapping should be kept under control; otherwise actors could participate to too many working groups. The relaxation of disjunction constraint should thus be accompanied by a limit on the maximal number of groups an actor can be assigned to. This is a tradeoff between mathematical ambition of minimizing INTER and managerial relevance while implementing clusters.
Third, it is possible to put constraints on NC:
NCmin≤ 𝑁𝐶 ≤ NCmax
or𝑁𝐶 = NCrequired (8)
Finally, additional indicators may be considered to check the quality of proposed solutions. For instance, the concept of density is used, to compare proposed clusters with current groups, and also to compare clusters. Two types of density are
used; both are based on the INTRA value of the cluster Ck;
they are defined as follows (see (9) and (10)):
𝐷𝐸𝑁𝑆 | 𝑅 (𝐶𝑘) = 𝐼𝑁𝑇𝑅𝐴 (𝐶𝑘)
𝑁𝑅 (𝐶𝑘) (9)
Its meaning is to know whether the cluster is dense enough regarding the number of risks included within.
𝐷𝐸𝑁𝑆 | 𝐴 (𝐶𝑘) =𝐼𝑁𝑇𝑅𝐴 (𝐶𝑘)
𝑁𝐴 (𝐶𝑘)
(10) Similarly, its meaning is to know whether the cluster is dense enough regarding the number of actors included within. It is all the more important that these actors will communicate and make meetings and decisions together. This means that if the cluster is not dense enough, they will have the perception of losing their time in meetings that do not often concern them, or not enough. This indicator is crucial to the success of practical implementation.
3. Clustering Process
Our 3-step approach aims at proposing the best possible solution adapted to the needs of the decision-maker. It is based on Jaber’s PhD work, which had been developed in another context, both for problem specification and type of data [107].
3.1. The Initialization. The first step consists of gathering
data and fixing decision parameters. About data gathering, we created a user-friendly interface to enter inputs and clustering parameters in our model. There are two different things, who and when clustering parameters are decided. The decision-maker is accountable for deciding; however, initial unsupervised clustering may help to give an idea, an order of magnitude of number of clusters for instance. This is why, if the decision-maker prefers this option, we propose to give an estimate of number and size constraints of clusters. Then, the strategy of simulating multiple runs allows for being not too precise at the beginning. We are running calculations with intervals. In other situations, we could give more precise constrains, like, for instance, in a previous work with Sosa [86], where decision-maker wanted to test a configuration similar to the existing one (in terms of number and size of clusters).
3.2. The Solving. The second step consists in running multiple
scenarios using different algorithms and different config-urations. The performance of several well-known graph-based clustering algorithms has been tested with real past
case studies. Those have been chosen in the field of design problems, either on product or process or organizational point of view. Two aspects have been compared: the capacity to detect and form performant clusters, and the capacity to tailor the algorithm to specific parameters asked by the decision-maker. Four algorithms have been selected in our case study:
(1) The first one, developed by Leicht and Newman, searches for community structure in directed net-works [41]. The modularity function has been gen-eralized in order to incorporate the information contained in edge directions. This allows finding communities by maximizing the modularity over possible divisions of a network, using an eigenvector-based clustering algorithm. The number of clusters is not known in advance. The algorithm is dividing the network into two groups and then possibly dividing those groups and so forth. The process stops when a point at which further division does not increase the total modularity of the network is reached.
(2) The second one, proposed by Blondel and coau-thors, develops an algorithm for fast unfolding of community hierarchies in large networks [42]. It is based on a two-phase process. First, a local search for aggregation with neighbors is done, starting from the situation where all clusters are singletons. The algorithm proposes to include a neighbor in the node community if it adds a gain of modularity. Then, the second phase consists in modeling a new network with the nodes being the communities previously built. Then, first phase is repeated with this com-pacted version of the network, and so on until no further gain of modularity is proposed. This is thus an unsupervised algorithm, using a heuristic which stops when predefined conditions exist.
(3) The third one is called IGTA, for Idicula-Gutierrez-Thebeau Algorithm, which considers maximal cluster size but not number of clusters [47, 48, 108]. It
globally follows this 9-step process:(1) each element
is initially placed in its own cluster; (2) Calculate
the “Coordination Cost” of the Cluster Matrix; (3)
randomly choose an element;(4) calculate bid from
all clusters for the selected element; (5) randomly
choose a number between 1 and rand-bid (algorithm
parameter);(6) calculate the total Coordination Cost
if the selected element becomes a member of the cluster with highest bid (use second highest bid if
step(5) is equal to rand-bid); (7) randomly choose
a number between 1 and rand-accept (algorithm
parameter); (8) if new Coordination Cost is lower
than the old Coordination Cost or the number chosen
in step(7) is equal to rand-accept, make the change
permanent otherwise make no changes;(9) go back
to step (3) until repeated a set number of times. A
refined version added a penalty (additional cost in the interaction matrix), to a solution that made an element a member of more than one cluster. That implies fewer multiple assignments for less elements.
(4) The fourth one is based on spectral clustering prin-ciples and has been developed by B¨uhler and Hein [75]. It uses spectral clustering based on the graph p-Laplacian. They prove that “in the limit as p tends to 1, the cut found by thresholding the second eigenvector of the graph p-Laplacian converges to the optimal Cheeger cut”. As explained in the Introduction, the characterization of eigenvectors is strongly related to the structure of the matrix, and thus to its behavior. It takes into account edge direction and allows addi-tionally to set cluster size parameter.
The experiments show that(1) the results found by these
four algorithms are as good as, or even better than the
other ones and (2) the algorithms do not have the same
performance depending on the matrix structure (density, presence of loops, and number of eigenvalues). This justifies our choice to run them all in order to be more robust to the matrix structure.
Since it is difficult for decision-maker to fix parameters, multiple values for constraints have been tested:
(i) NCrequired
(ii) max(R | C)
(iii) max(C | R)
(iv) disjoint or nondisjoint groups
(v) actors who must be put together or must be separated
3.3. The Posttreatment. We achieved automatic processing
of all the solutions provided by the algorithms, which helps building a final recommendation by assembling one or several pieces of those solutions. The second originality of this work is thus to assemble a solution from the different solutions obtained in previous step. No generalized innova-tive assembling process is proposed; however we argue that this offers more flexibility to the decision-maker and that final solution meets better her expectations, since she is involved in the process.
4. Case Study: Analysis of Project
Organization and Improvement by
Interdependency-Based Clustering
This section introduces the case study at the CEA
(Commis-sariat `a l’Energie Atomique). The project data are presented
with an analysis of the existing situation, and the clustering approach is applied for this specific case. Due to confidential-ity reasons, all data are anonymized.
4.1. The Project Data. The project aims at designing and
building a new nuclear installation (SYST), made of three
interdependent subsystems (SS1 to SS3). They are
interde-pendent for two reasons: first, outputs of a subsystem can be an input of another one. This means that there is a kind of sequence (notably for construction and installation phases), even if they are designed simultaneously. Second, there are some key drivers, like safety, which are transverse to the
SS1 R006 R007 R024 R031 R047 R071 R074 R075 R076 R079 R080 R089 R099 SS3 R013 R014 R015 R018 R022 R023 R025 R033 R034 R036 R037 R038 R040 R044 R060 R062 R066 R067 R095 R096 R097 R098 SS2 R004 R005 R009 R010 R011 R012 R021 R027 R029 R030 R045 R063 R078 R083 R086 R087 R088 R091 R102 SYS R008 R028 R032 R070 R077 R090 R093 R094 R100 R101 EXT R002 R003 R019 R026 R041 R057 R058 R059 R064 R065 R081 R084 R103
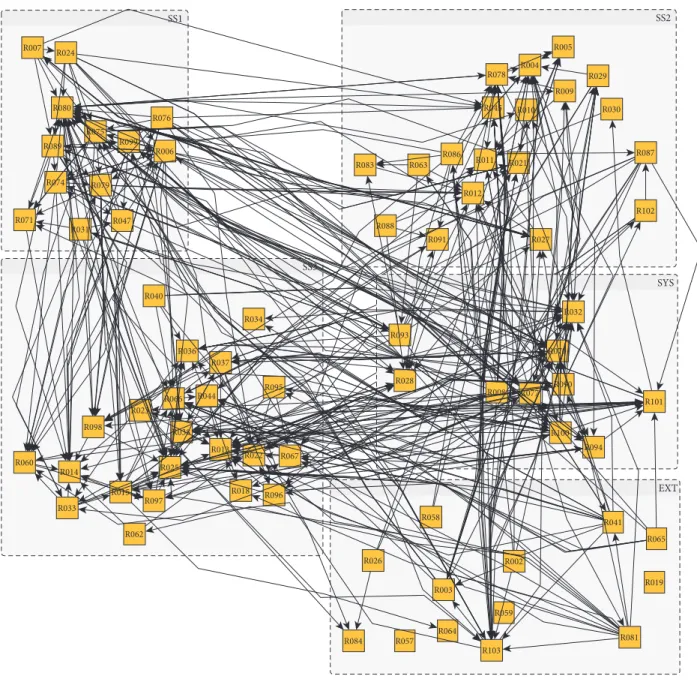
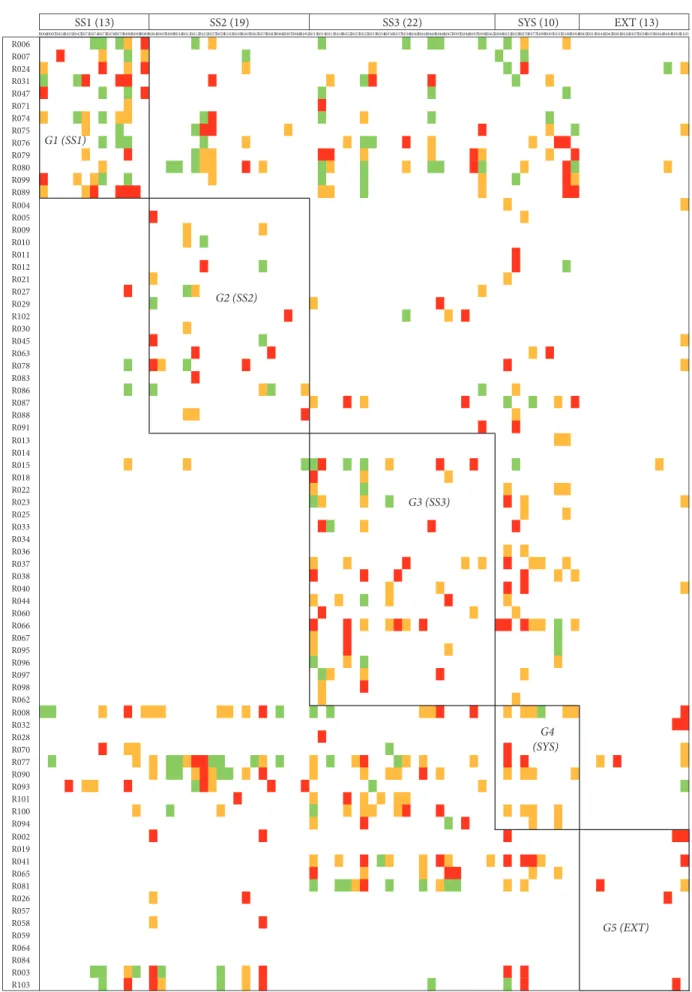
Figure 2: Representation of the existing risk network.
project and have to diffuse in every aspect of the designed subsystems. The organization is composed of 5 groups: 1 integration group at system level (SYST), 3 operational groups at subsystem level, and a fifth one corresponding to influence from the external environment (EXT).
There are 77 risks belonging to the 5 previous groups (RG), 21 risk owners (AR), and 495 interdependencies (RR). The risk network is presented in Figure 2 as a graph and in Figure 3 as a matrix for easier reading.
The graph version illustrates the density of interde-pendencies in this network and the potential difficulty to coordinate the different actors who make decisions.
Values between 8 and 10 are in red, values between 5 and 7 are in orange, and values inferior to 4 are in green (white if equal to 0).
4.2. Analysis of the Existing Situation. The next step consists
in separating BAI and MAI. 90% of interdependencies are
BAI, 100% of INTER interdependencies are𝐼𝑁𝑇𝐸𝑅|BAI, and
INTER represents 66% of the total value of
interdependen-cies TVI. The situation had been judged dangerous by the decision-maker, and this perception at the origin of the study has been confirmed by factual indicators.
4.3. Clustering Process (Initialization, Solving, and Posttreat-ment). Unsupervised algorithms have been run first, in order
to have a preliminary idea of the structure of the network and establish more precisely problem constraints. It appeared that some risks were sometimes in one cluster and sometimes in another one. That justified the removal of disjunction constraint, in order to allow them to be simultaneously
R006R007R024R031R047R071R074R075R076R079R080R099R089R004R005R009R010R011R012R021R027R029R102R030R045R063R078R083R086R087R088R091R013R014R015R018R022R023R025R033R034R036R037R038R040R044R060R066R067R095R096R097R098R062R008R032R028R070R077R090R093R101R100R094R002R019R041R065R081R026R057R058R059R064R084R003R103 R006 R007 R024 R031 R047 R071 R074 R075 R076 R079 R080 R099 R089 R004 R005 R009 R010 R011 R012 R021 R027 R029 R102 R030 R045 R063 R078 R083 R086 R087 R088 R091 R013 R014 R015 R018 R022 R023 R025 R033 R034 R036 R037 R038 R040 R044 R060 R066 R067 R095 R096 R097 R098 R062 R008 R032 R028 R070 R077 R090 R093 R101 R100 R094 R002 R019 R041 R065 R081 R026 R057 R058 R059 R064 R084 R003 R103 SS1 (13) SS2 (19) SS3 (22) SYS (10) EXT (13) G1 (SS1) G2 (SS2) G3 (SS3) G4 (SYS) G5 (EXT)
Table 1: Comparison of interdependency type sharing between existing and proposed configurations.
Interdependency type Existing Groups Proposed Clusters
𝐼𝑁𝑇𝐸𝑅|BAI 2236 (66%) 1032 (30%)
𝐼𝑁𝑇𝐸𝑅|BAI 848 (25%) 2038 (61%)
𝐼𝑁𝑇𝐸𝑅|MAI 320 (9%) 272 (8%)
𝐼𝑁𝑇𝐸𝑅|MAI 0 48 (1%)
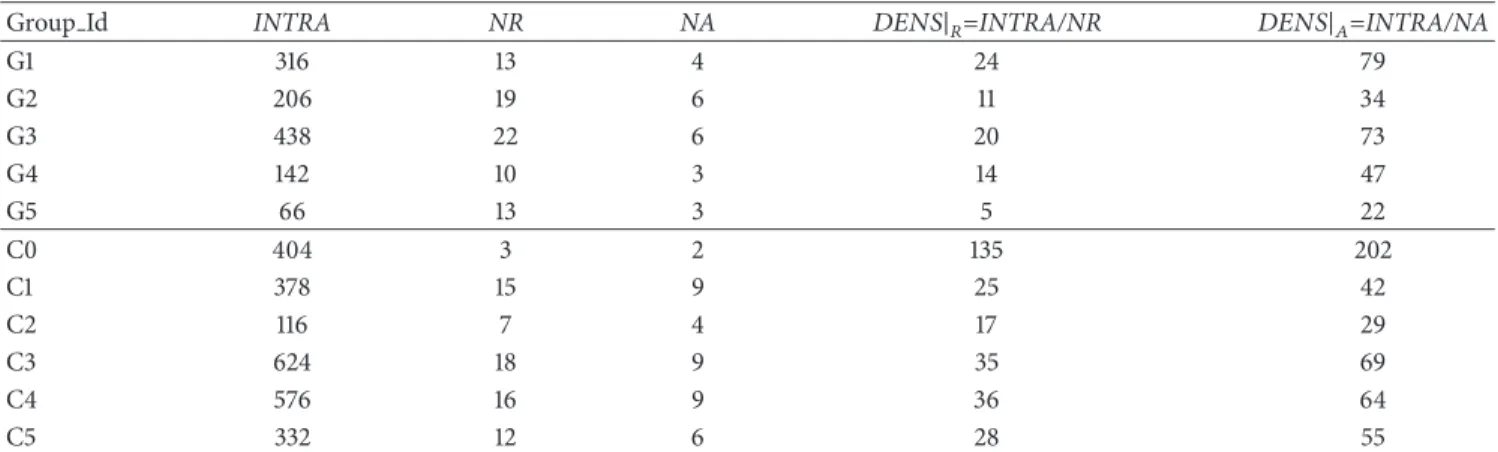
Table 2: Comparison of performance indicators between existing groups and proposed clusters.
Group Id INTRA NR NA 𝐷𝐸𝑁𝑆|𝑅=INTRA/NR 𝐷𝐸𝑁𝑆|𝐴=INTRA/NA
G1 316 13 4 24 79 G2 206 19 6 11 34 G3 438 22 6 20 73 G4 142 10 3 14 47 G5 66 13 3 5 22 C0 404 3 2 135 202 C1 378 15 9 25 42 C2 116 7 4 17 29 C3 624 18 9 35 69 C4 576 16 9 36 64 C5 332 12 6 28 55
assigned to 2 clusters (max(C | R) is equal to 2). The range
interval for NCrequiredis [4:7] and for max(R | C) is [12:18].
Clusters have been built by combination of several solutions proposed in different configurations. Results are presented in the following section.
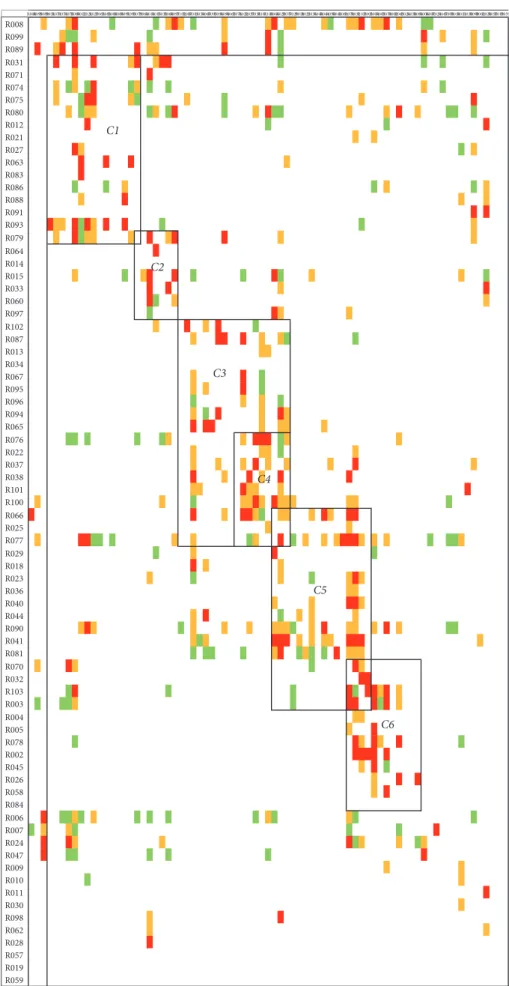
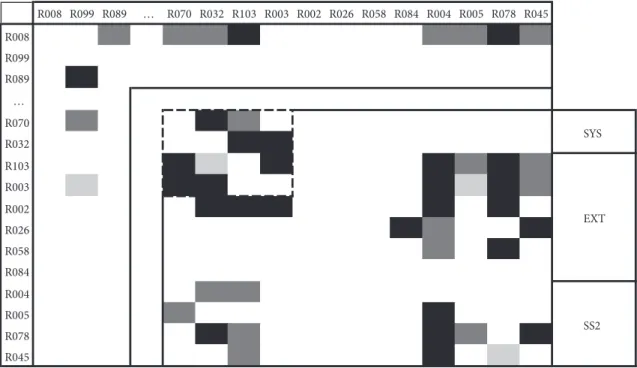
4.4. Results. Organizational reshuffling in
interdependency-based clusters is illustrated in Figure 4.
Three risks are declared as transverse. They are put
together for convenience in a fictitious cluster called C0. 60
risks are grouped into 5 clusters, from C1 to C5. 14 risks
remain outside the clusters.
Table 1 compares the global indicators for initial and proposed configurations, with two highlighted elements:
(i)𝐼𝑁𝑇𝐸𝑅|BAI decreases from 66% to 30% of total
interdependencies (TVI).
(ii) INTRA increases from 34% to 69% of TVI (including biactor and monoactor interdependencies).
Table 2 summarizes and compares local information
about groups and clusters. Except C2, all clusters are more
performant in terms of density𝐷𝐸𝑁𝑆 | 𝑅=𝐼𝑁𝑇𝑅𝐴/𝑁𝑅 (see
(9)) and𝐷𝐸𝑁𝑆 | 𝐴=𝐼𝑁𝑇𝑅𝐴/𝑁𝐴 (see (10)).
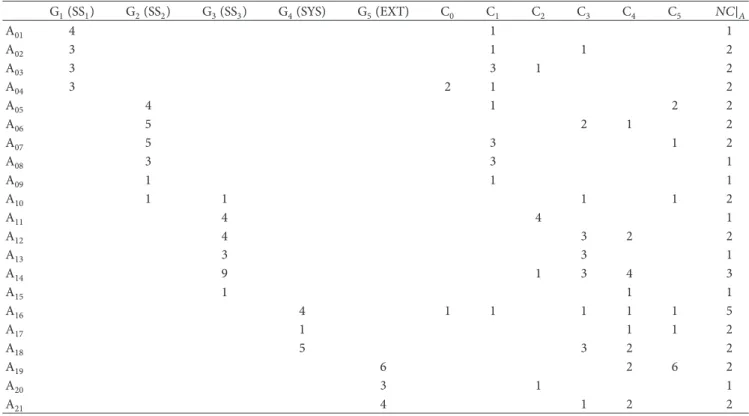
Clusters naturally contain more actors than existing groups (Table 3). This is due to the fact that actors are affiliated to one and only one group but are allowed to be affiliated to more than one cluster. This remains under 2 simultaneous
affiliations, except for A16(5) and A14(3).
In addition to these global changes, other local
conse-quences are of interest. For example, A19 is the only one
of group EXT who has been assigned to C5. This means
that the way people were initially grouped together did
not correspond to the reality of their interactions and their coordination needs.
Results show a significant decrease of 𝐼𝑁𝑇𝐸𝑅|BAI and
increase of INTRA, with a slight increase of average cluster size (in terms of the number of affiliated actors). The follow-ing section discusses managerial implications of each cluster.
5. Managerial Relevance of Proposed Clusters
C0 is not a cluster like others. This means that the actors
declared as transverse have to exchange on a regular basis with all the clusters. For the rest, each cluster has been analyzed in terms of advantages and drawbacks, in order to decide whether it deserves to be implemented or not.
Cluster C1is made of 15 risks (8 from SS2and 6 from SS1),
owned by 9 actors (Figure 5).
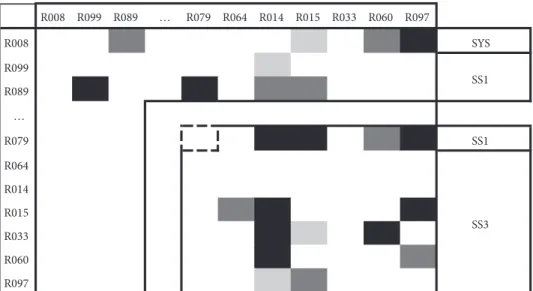
Cluster C2is the smallest cluster, consisting of seven risks.
This cluster is particularly homogeneous, with 6 risks from
SS3and 1 risk from SS1, common to clusters C2and C1(R79).
This cluster is centered on the design of SS3 processes and
related choices (Figure 6). The risk R79of SS1represents the
object as an input for the design of other processes. This cluster has a practical meaning for the project, notably for linking various actors whose correct interfacing is extremely important for the proper functioning of this part of the future plant.
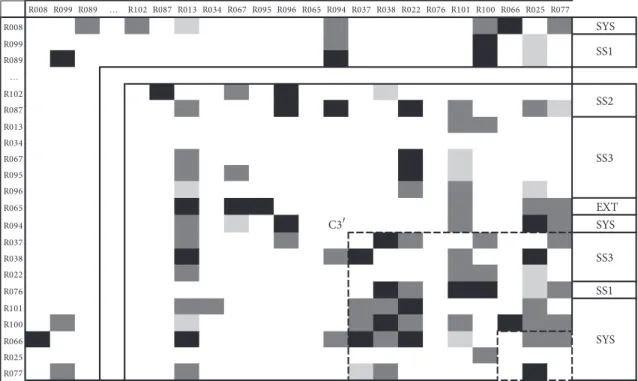
C3is the largest one (18 actors), with the highest INTRA
value(624). Moreover, it has the rare distinction of fully
inte-grating a 9-risk subcluster obtained from several algorithms with different maximum size constraints. As displayed in Figure 7, this subcluster is even denser than the cluster itself, acting like a kernel. It behaves like a steering committee inside
Table 3: Analysis of assignments of actors to clusters. G1(SS1) G2(SS2) G3(SS3) G4(SYS) G5(EXT) C0 C1 C2 C3 C4 C5 𝑁𝐶|𝐴 A01 4 1 1 A02 3 1 1 2 A03 3 3 1 2 A04 3 2 1 2 A05 4 1 2 2 A06 5 2 1 2 A07 5 3 1 2 A08 3 3 1 A09 1 1 1 A10 1 1 1 1 2 A11 4 4 1 A12 4 3 2 2 A13 3 3 1 A14 9 1 3 4 3 A15 1 1 1 A16 4 1 1 1 1 1 5 A17 1 1 1 2 A18 5 3 2 2 A19 6 2 6 2 A20 3 1 1 A21 4 1 2 2
driven by the major contributors in the project. These risks are all related to fundamental decisions for the installation
of SS3. This cluster seems much more diverse than others
because all domains of the project are concerned. However, when examining things deeper, we found that the cluster is
centered once again on the SS3, with a specific topic around
the availability of the future nuclear installation SS3. Once
again, it is not a surprise to see connections between interme-diary elements and the final outcome, which is the production by the plant. The diversity is not surprising. However, it was not intuitive to connect these specific elements, which was done by the clustering approach.
Cluster C4 is characterized by two main elements: first,
it is extremely diverse but mainly focused on SS3installation
and associated risks in other categories (SS1, SS2, SYS, and
EXT). Despite this diversity, the INTRA value is extremely high (576, the second-best cluster). Second, this 16-risk cluster is connected with two other clusters, with 3 common
risks with C3 and 4 common risks with C5 (as shown in
Figure 8). Once again, this is due to the mandatory diversity of points of view to address such complex issues as a subsystem design or installation. However, the number of assignments for risk owners is completely under control because only two actors have more than two assignments. This has been
validated by the managers. Moreover, C4 is more related to
the financial aspects of the building, both during and after the project (construction costs and operations costs). This also explains why these risks should be included in two clusters.
Finally, cluster C5is a 12-risk cluster with an INTRA value
of 332, which places it slightly lower than C3and C4 and is
equivalent to C1. Surprisingly, this cluster groups 6 risks from
the EXT category, 2 risks from SYS, and 4 from the subsystem
SS2. The decision-maker had not expected to see the presence
of only one subsystem. As displayed in Figure 9, the EXT-related risks are relatively independent (the central part of the matrix is almost empty) but strongly connected with other
categories: SS2and SYS, respectively.
C1reinforces the connection between subsystems SS1and
SS2. C2is focused on SS3design, just like C3(with a focus on
exploitation). C3’ is used as an interface between SS3design
and the rest of the project. C4 is made of numerous
cost-related risks about installation of subsystem SS3. Finally, C5
links SS2to SYS and EXT.
6. Discussion
Due to the fact that different algorithms were run using differ-ent problem configurations, the decision-maker recognized the validity of each cluster, both in terms of mathematical
justification and of managerial relevance. Even cluster C3,
with its particularity to have a subcluster, has been validated. The only difference was to run two series of meetings, with different participants and different agendas.
Compared to the classical way risks are currently man-aged, the main difference is to formally connect actors outside of the traditional project organization boundaries. In this case, project risk list was classically broken into subsystems down, with a second categorization based upon risk nature (financial, technical, delay, safety, etc.). The importance of risk management is not always perceived as crucial by managers, mainly because of two reasons: the first one is the traditional
R008R099R089R031R071R074R075R080R012R021R027R063R083R086R088R091R093R079R064R014R015R033R060R097R102R087R013R034R067R095R096R094R065R076R022R037R038R101R100R066R025R077R029R018R023R036R040R044R090R041R081R070R032R103R003R004R005R078R002R045R026R058R084R006R007R024R047R009R010R011R030R098R062R028R057R019R059 R008 R099 R089 R031 R071 R074 R075 R080 R012 R021 R027 R063 R083 R086 R088 R091 R093 R079 R064 R014 R015 R033 R060 R097 R102 R087 R013 R034 R067 R095 R096 R094 R065 R076 R022 R037 R038 R101 R100 R066 R025 R077 R029 R018 R023 R036 R040 R044 R090 R041 R081 R070 R032 R103 R003 R004 R005 R078 R002 R045 R026 R058 R084 R006 R007 R024 R047 R009 R010 R011 R030 R098 R062 R028 R057 R019 R059 C1 C2 C3 C4 C5 C6
R008 R099 R089 R012 R021 R027 R063 R083 R086 R088 R091 R093 R031 R071 R074 R075 R080 R079 R008 SYS R099 R089 R012 R021 R027 R063 R083 R086 R088 R091 R093 SYS R031 R071 R074 R075 R080 R079 SS2 SS1 SS1
Figure 5: Display of cluster C1and the 3 transverse risks.
R008 R099 R089 … R079 R064 R014 R015 R033 R060 R097 R008 10 SYS R099 R089 10 10 … R079 10 10 10 SS1 R064 R014 R015 10 10 R033 10 10 R060 10 R097 SS3 SS1
Figure 6: Illustration of the SS3-centered cluster C2and its interdependencies with transverse risks.
technical focus of member of such innovative and techni-cally complex projects; the second one is the unfortunately traditional reluctance to invest time and energy into an unreliable process. Namely, if risks are not properly managed, then risk management outcome is not good, meaning that project behavior is not correctly anticipated and mitigation actions are not correctly planned. This implies a negative perception of risk management, which is a negative loop. In this paper, the assumption is that we do not work on quality of risk data. We consider data as inputs, with their limits and potential lack of reliability (on assessments for instance, or on completeness of risk identification). However, our approach
makes a difference in the use of these inputs, compared to classical approach where risks are considered as independent (management by Excel), or as dependent but with less advanced methodologies (trees or risk clustering without considering human resource assignment). So, increasing the perception of reliability and usefulness of risk management may also involve a better perception of investing time into proper and periodic risk identification and assessment.
Namely, risks are dynamic by essence, with their values evolving through time, and with new risks appearing or exist-ing risks disappearexist-ing. This means that clusterexist-ing analysis has to be updated when significant differences exist between
R008 R099 R089 … R102 R087 R013 R034 R067 R095 R096 R065 R094 R037 R038 R022 R076 R101 R100 R066 R025 R077 R008 SYS R099 R089 … R102 R087 R013 R034 R067 R095 R096 R065 EXT R094 SYS R037 R038 R022 R076 SS1 R101 R100 R066 R025 R077 SS1 SS2 SYS SS3 SS3 #3
Figure 7: The cluster C3and its subcluster C3’ with connections with transverse risks.
R008 R099 R089 … R066 R025 R077 R090 R029 R018 R023 R036 R040 R044 R041 R081 R103 R003 R070 R032 R008 R099 R089 … R066 R025 R077 R090 R029 SS2 R018 R023 R036 R040 R044 R041 R081 R103 R003 R070 R032 SS3 SYS SS3 EXT SYS
Figure 8: The cluster C4intertwined with C3(up-left) and C5(down-right).
two versions of the risk list. Based on our experience, it is not a problem to update the risk list and so the risk-based organization, since actors prefer to have an up to date version of the organization to work with. So, we work with a current version of the data, and we update the clusters when there are changes in the data, for instance on a monthly basis, which may classically correspond to project risk reviews frequency.
These complementary teams foster psychological safety and trust between members, which provides a supportive environment amenable to anticipation, collective problem-solving, and coordinated decision-making [109, 110]. They propose to work together in interdependency-based tempo-rary working groups, which is not the same as if the manager of a subsystem invited people from another subsystem. This
R008 R099 R089 … R070 R032 R103 R003 R002 R026 R058 R084 R004 R005 R078 R045 R008 10 10 R099 R089 10 … R070 10 R032 10 10 R103 10 10 10 10 R003 10 10 10 10 R002 10 10 10 10 10 R026 10 10 R058 10 R084 R004 R005 10 R078 10 10 10 R045 10 SYS SS2 EXT
Figure 9: Cluster C5and its lower connections with the transverse risks.
is even more important than the way in which teams are assembled seems to have an influence on their success [111]. One additional important point is that clusters of actors are indirectly proposed based on risk interdependencies, which
has two positive and one negative implications:(1) the focus
is on cause-effect interdependencies between nonhuman elements (risks), which has not the same implication as direct identification of interaction between two actors, especially
when it is not correctly managed;(2) the data about risk
inter-dependencies are easier to assess with a neutral, factual way, without a priori interference depending of who is involved in the interaction, what their personalities are and so on; (3) the counterpoint of this indirect consideration of groups of actors is that the calculation of a risk interdependency-based solution may be disturbed by the possibly negative consequences on actors groups. For instance, an optimal solution considering risk interdependencies only may be rejected because it does not respect an actor-based constraint (maximal size of the group).
The will to involve the decision-maker in tailoring the clustering methodology has the following implication: the performance can be a bit lower since the decision-maker may prefer a suboptimal solution, from the pure calculation point of view, in order to implement it more easily and have more warranty to get a collective behavior within and between human clusters.
There are some limits to this work. First, it is based on an initial version of the list and a network of elements, which is given by the decision-maker. We did not test the consequences of possible mistakes made in this initial input. However, we will be able to update the initial network once the project continues and the situation changes. New risks appear or disappear, and new interdependencies appear or
disappear or simply see their values change. The effort is reduced because the largest part of the work has already initially been completed, and updating an existing network is far less demanding than building it from scratch. The calculation time is not a problem, so the limiting factor is the data gathering effort. The decision-maker was ready to invest time at the beginning but wanted updates to be given very quickly. The second limit concerns the interdependencies assessments. Because of the clustering algorithm groups risks with the highest interdependency levels, it is a priori enough to have orders of magnitude of assessments with relative gaps that are significant enough to justify a preference for placing this risk into a certain cluster rather than a different one, which is why we tested the sensitivity of the proposed clusters for the uncertainty on input in other studies. We tested the sensitivity of the chosen algorithm and made proposals corre-sponding to robust solutions; however, further research could more deeply analyze the importance of precise assessment.
On a managerial point of view, some managers are attached to hierarchical power (or the impression or illusion of it). The main downside for them is that they (seem to) lose a part of this power. But we argue that this is more aligned with the actual nature of complexity of the project, which is not correctly taken into account by classical, hierarchical organizations based on services and departments. So, even for managers, we think that removing problematic situations or crisis could be better for them. Second, it apparently adds some work and particularly meetings since we add a complementary organizational structure which needs to undertake meetings series (calling them working groups, task forces, or whatever). But we argue that the investment is profitable, both in terms of time and on other parameters like cost. Indeed, these meetings have a chance to avoid far bigger
troubles in downstream phases, where amounts at stakes are multiplied by 1000 in such projects. It costs several tens of hours, but may save hundreds of crisis meetings hours, and several millions/tens of millions of overcost/wasted money. Last, some people could argue that a complementary way of seeing and managing things would add more complexity to a situation that does not need it. However, once again, we argue that this way is considering the complexity to align at best organization to it, so we think that it is exactly the opposite of this natural fear.
7. Conclusion
This research work proposes a clustering-based approach to form teams to make collective decisions about interde-pendent risks in an evolving environment. This challenge is nontrivial because of the interdependencies between project risks and thus between the actors owning these risks. Our approach proposes complementary organizational clusters based on the interdependencies between the risks that the actors own, meaning that it avoids the classical criteria based on similarity or diversity. More specifically, we capture and use the information about the fact that risk interdependency is managed by one or two different actors. Forming alter-native teams based on interdependencies between project elements, which is complementary to the classical project breakdown structure organization, is an emerging and vital topic to the performance of projects. Some promising per-spectives arise from this work, like the dynamics of the model, and the robustness of proposed clusters to data changes, or the consideration of specific complex phenomena, like prop-agation chains and loops, in building complexity-oriented project organizations. Moreover, this work is a step between pure algorithmic-based organization reshuffling and putting the organization on a different management mode, more based on lateral interactions, distribution of authority, and incitation to coordination (more than collaboration). New ways of managing projects and organizations, like agile management or holacracy, will be developed in further work in order to use interdependence-based algorithms to serve such management modes.
Data Availability
Data which are not included in the paper are not available, due to confidentiality reasons.
Conflicts of Interest
The authors declare that there are no conflicts of interest regarding the publication of this paper.
References
[1] O. O. Ariyo, C. M. Eckert, and P. J. Clarkson, “Prioritising engineering change propagation risk estimates,” in Proceedings
of the International Conference on Engineering Design, ICED’07,
Paris, France, 2007.
[2] X. Qiu, Modeling Cascading Events Using Bayesian Networks, 2012.
[3] E. Zio, L. R. Golea, and G. Sansavini, “Optimizing protections against cascades in network systems: A modified binary differ-ential evolution algorithm,” Reliability Engineering and Systems
Safety, vol. 103, pp. 72–83, 2012.
[4] V. Latora and M. Marchiori, “Vulnerability and protection of infrastructure networks,” Physical Review E, vol. 71, p. 015103, 2005.
[5] R. Sanchez and J. T. Mahoney, “Modularity, flexibility, and knowledge management in product and organization design,”
Strategic Management Journal, vol. 17, no. 2, pp. 63–76, 1996.
[6] C. Terwiesch, C. H. Loch, and A. De Meyer, “Exchanging preliminary information in concurrent engineering: Alternative coordination strategies,” Organization Science, vol. 13, no. 4, pp. 402–457, 2002.
[7] M. Mane, D. DeLaurentis, and A. Frazho, “A markov perspective on development interdependencies in networks of systems,”
Journal of Mechanical Design, vol. 133, no. 10, p. 101009, 2011.
[8] S. D. Eppinger and T. R. Browning, Design Structure Matrix
Methods and Applications, Cambridge: MIT Press, Mass, USA,
2012.
[9] T. Williams, “Assessing and moving on from the dominant project management discourse in the light of project overruns,”
IEEE Transactions on Engineering Management, vol. 52, no. 4,
pp. 497–508, 2005.
[10] N. Worren, Organisation Design: Re-defining complex systems, Pearson, 2012.
[11] M. M. Baron and M. Elisabeth Pate-Cornell, “Designing risk-management strategies for critical engineering systems,” IEEE
Transactions on Engineering Management, vol. 46, no. 1, pp. 87–
100, 1999.
[12] D. Braha and Y. Bar-Yam, “The statistical mechanics of complex product development: Empirical and analytical results,”
Man-agement Science, vol. 53, no. 7, pp. 1127–1145, 2007.
[13] D. Braha and Y. Bar-Yam, “Information flow structure in large-scale product development organizational networks,” Journal of
Information Technology, vol. 19, no. 4, pp. 244–253, 2004.
[14] M. E. J. Newman, “Finding community structure in networks using the eigenvectors of matrices,” Proceedings of the National
Academy of Sciences, vol. 103, Article ID 036104, pp. 8577–8582,
2006.
[15] T. P. Peixoto, “Eigenvalue spectra of modular networks,” Physical
Review Letters, vol. 111, no. 098701, 2013.
[16] B. Morel and R. Ramanujam, “Through the looking glass of complexity: the dynamics of organizations as adaptive and evolving systems,” Organization Science, vol. 10, no. 3, pp. 278– 293, 1999.
[17] I. Giannoccaro, G. F. Massari, and G. Carbone, “Team resilience in complex and turbulent environments: The effect of size and density of social interactions,” Complexity, vol. 2018, Article ID 1923216, 11 pages, 2018.
[18] C. Gomez, M. Sanchez-Silva, and L. Duenas-Osorio, “Clus-tering methods for risk assessment of infrastructure network systems,” Applications of Statistics and Probability in Civil
Engineering, pp. 1389–1397, 2011.
[19] F. Borjesson and K. H¨oltt¨a-Otto, “A module generation algo-rithm for product architecture based on component interac-tions and strategic drivers,” Research in Engineering Design, vol. 25, no. 1, pp. 31–51, 2014.
[20] H. D. Sherali and J. Desai, “A global optimization RLT-based approach for solving the hard clustering problem,” Journal of
Global Optimization, vol. 32, no. 2, pp. 281–306, 2005.
[21] R. Day, R. B. Stone, and K. G. Lough, “Validating module heuristics on large scale products,” in Proceedings of the ASME
International Design Engineering Technical Conference IDETC,
pp. 1079–1087, 2009.
[22] R. B. Stone, K. L. Wood, and R. H. Crawford, “A heuristic method for identifying modules for product architectures,”
Design Studies, vol. 21, no. 1, pp. 5–31, 2000.
[23] S. Fortunato, “Community detection in graphs,” Physics Reports, no. 486, pp. 75–174, 2010.
[24] F. Amirahmadi and F. Choobineh P.E., “A heuristic grouping procedure for component family formation in a cellular man-ufacturing environment,” Computers & Industrial Engineering, vol. 23, no. 1-4, pp. 69–72, 1992.
[25] R. Whitfield, J. Smith, and A. Duffy, “Identifying component modules,” in Proceedings of the 7th International Conference on
Artificial Intelligence in Design AID’02, pp. 571–592, 2002.
[26] S. Jung and T. W. Simpson, “A clustering method using new modularity indices and genetic algorithm with extended chro-mosomes,” in Proceedings of the 16th International Dependency
and Structure Modeling Conference DSM, pp. 167–176, 2014.
[27] A. K. Kamrani and R. Gonzalez, “A genetic algorithm-based solution methodology for modular design,” Journal of Intelligent
Manufacturing, vol. 14, no. 6, pp. 599–616, 2003.
[28] H. Wang, Z. Zhao, Z. Guo, Z. Wang, and G. Xu, “An improved clustering method for detection system of public security events based on genetic algorithm and semisupervised learning,”
Complexity, vol. 2017, Article ID 8130961, 10 pages, 2017.
[29] S. E. Schaeffer, “Graph clustering,” Computer Science Review, vol. 1, no. 1, pp. 27–64, 2007.
[30] M. Filippone, F. Camastra, F. Masulli, and S. Rovetta, “A survey of kernel and spectral methods for clustering,” Pattern
Recognition, vol. 41, no. 1, pp. 176–190, 2008.
[31] D. Ben-Arieh and R. Sreenivasan, “Information analysis in a distributed dynamic group technology method,” International
Journal of Production Economics, vol. 60-61, pp. 427–432, 1999.
[32] C. Hennig and B. Hausdorf, “A robust distance coefficient between distribution areas incorporating geographic distances,”
Systematic Biology, vol. 55, no. 1, pp. 170–175, 2006.
[33] Y. Dong, Y. Zhuang, K. Chen, and X. Tai, “A hierarchical clustering algorithm based on fuzzy graph connectedness,”
Fuzzy Sets and Systems, vol. 157, no. 13, pp. 1760–1774, 2006.
[34] D. Gusfield, Algorithms on Strings, Trees and Sequences, Cam-bridge University Press, 1997.
[35] E. Kuntsche, Cluster Analysis, vol. 62, Wiley, Chichester, UK, 3 edition, 2003.
[36] B. S. Everitt, S. Landau, M. Leese, and D. Stahl, Cluster Analysis, Wiley, Chichester, UK, 2011.
[37] H. Zhao, Z. Xu, S. Liu, and Z. Wang, “Intuitionistic fuzzy MST clustering algorithms,” Computers & Industrial Engineering, vol. 62, no. 4, pp. 1130–1140, 2012.
[38] M. Girvan and M. E. J. Newman, “Community structure in social and biological networks,” Proceedings of the National
Acadamy of Sciences of the United States of America, vol. 99, no.
12, pp. 7821–7826, 2002.
[39] L. Freeman, “Set of measures of centrality based on between-ness,” Sociometry, vol. 40, no. 1, pp. 35–41, 1977.
[40] A. Clauset, M. E. J. Newman, and C. Moore, “Finding com-munity structure in very large networks,” Physical Review E:
Statistical, Nonlinear, and Soft Matter Physics, vol. 70, no. 066111,
Article ID 066111, pp. 1–6, 2004.
[41] E. A. Leicht and M. E. J. Newman, “Community structure in directed networks,” Physical Review Letters, vol. 100, no. 11, Article ID 118703, 2008.
[42] V. D. Blondel, J. Guillaume, R. Lambiotte, and E. Lefebvre, “Fast unfolding of communities in large networks,” Journal
of Statistical Mechanics: Theory and Experiment, vol. P10008,
Article ID P10008, 2008.
[43] K. H¨oltt¨a-Otto and O. de Weck, “Degree of modularity in engineering systems and products with technical and business constraints,” Concurrent Engineering Research and Applications, vol. 15, no. 2, pp. 113–125, 2007.
[44] Q. D. Van Eikema Hommes, “Comparison and application of metrics that define the components modularity in complex products,” in Proceedings of the ASME International Design
Engineering Technical Conference IDETC, pp. 287–296, 2008.
[45] B. Wang and E. K. Antonsson, “Information measure for modularity in engineering design,” in Proceedings of the ASME
International Design Engineering Technical Conference IDETC,
pp. 449–458, 2004.
[46] F. Guo and J. K. Gershenson, “A comparison of modular product design methods based on improvement and iteration,” in Proceedings of the ASME International Design Engineering
Technical Conference IDETC, pp. 261–269, 2004.
[47] C. I. Gutierrez-Fernandez, Integration Analysis of Product
Archi-tecture to Support Effective Team Co-Location, Massachussets
Institute of Technology, 1998.
[48] R. E. Thebeau, Knowledge Management of System Interfaces and
Interactions for Product Development Process, Massachussets
Institute of Technology, 2001.
[49] N. Biggs, Algebraic Graph Theory, Cambridge University Press, UK, 1994.
[50] I. J. Farkas, I. Der´enyi, A.-L. Barab´asi, and T. Vicsek, “‘Real-World’ Graphs: Beyond the Semicircle Law,” Physical Review
E: Statistical, Nonlinear, and Soft Matter Physics, vol. 64, no.
026704, Article ID 026704, 2001.
[51] M. A. de Aguiar and Y. Bar-Yam, “Spectral analysis and the dynamic response of complex networks,” Physical Review E:
Statistical, Nonlinear, and Soft Matter Physics, vol. 71, no. 016106,
2005.
[52] M. E. Newman, “Spectral methods for community detection and graph partitioning,” Physical Review E, vol. 88, no. 042822, 2013.
[53] J. MacQueen, “Some methods for classification and analysis of multivariate observations,” Computational Chemistry, vol. 4, pp. 257–272, 1967.
[54] M. P. Tan, J. R. Broach, and C. . Floudas, “A novel clustering approach and prediction of optimal number of clusters: global optimum search with enhanced positioning,” Journal of Global
Optimization, vol. 39, no. 3, pp. 323–346, 2007.
[55] R. Kuo, L. Ho, and C. Hu, “Cluster analysis in industrial market segmentation through artificial neural network,” Computers &
Industrial Engineering, vol. 42, no. 2, pp. 391–399, 2002.
[56] D. Ben-Arieh and D. K. Gullipalli, “Data envelopment analysis of clinics with sparse data: Fuzzy clustering approach,”
Comput-ers & Industrial Engineering, vol. 63, no. 1, pp. 13–21, 2012.
[57] R. Zhou, Y. Zhang, S. Feng, and N. Luktarhan, “Research article a novel hierarchical clustering algorithm based on density peaks