HAL Id: hal-01115422
https://hal.archives-ouvertes.fr/hal-01115422
Submitted on 4 Aug 2020
HAL is a multi-disciplinary open access
archive for the deposit and dissemination of
sci-entific research documents, whether they are
pub-lished or not. The documents may come from
teaching and research institutions in France or
abroad, or from public or private research centers.
L’archive ouverte pluridisciplinaire HAL, est
destinée au dépôt et à la diffusion de documents
scientifiques de niveau recherche, publiés ou non,
émanant des établissements d’enseignement et de
recherche français ou étrangers, des laboratoires
publics ou privés.
Adriatic paleohydrology
G. Siani, M. Magny, M. Paterne, Maxime Debret, Michel Fontugne
To cite this version:
G. Siani, M. Magny, M. Paterne, Maxime Debret, Michel Fontugne. Impact of the Holocene climate
variability on the Adriatic paleohydrology. Climate of the Past, European Geosciences Union (EGU),
2013, 9 (1), pp.499-515. �10.5194/cp-9-499-2013�. �hal-01115422�
Clim. Past, 9, 499–515, 2013 www.clim-past.net/9/499/2013/ doi:10.5194/cp-9-499-2013
© Author(s) 2013. CC Attribution 3.0 License.
EGU Journal Logos (RGB)
Advances in
Geosciences
Open Access
Natural Hazards
and Earth System
Sciences
Open AccessAnnales
Geophysicae
Open AccessNonlinear Processes
in Geophysics
Open AccessAtmospheric
Chemistry
and Physics
Open AccessAtmospheric
Chemistry
and Physics
Open Access DiscussionsAtmospheric
Measurement
Techniques
Open AccessAtmospheric
Measurement
Techniques
Open Access DiscussionsBiogeosciences
Open Access Open Access
Biogeosciences
DiscussionsClimate
of the Past
Open Access Open Access
Climate
of the Past
Discussions
Earth System
Dynamics
Open Access Open Access
Earth System
Dynamics
DiscussionsGeoscientific
Instrumentation
Methods and
Data Systems
Open Access
Geoscientific
Instrumentation
Methods and
Data Systems
Open Access DiscussionsGeoscientific
Model Development
Open Access Open Access
Geoscientific
Model Development
DiscussionsHydrology and
Earth System
Sciences
Open AccessHydrology and
Earth System
Sciences
Open Access DiscussionsOcean Science
Open Access Open Access
Ocean Science
Discussions
Solid Earth
Open Access Open Access
Solid Earth
DiscussionsThe Cryosphere
Open Access Open Access
The Cryosphere
DiscussionsNatural Hazards
and Earth System
Sciences
Open Access
Discussions
Paleohydrology reconstruction and Holocene
climate variability in the South Adriatic Sea
G. Siani1, M. Magny2, M. Paterne3, M. Debret4, and M. Fontugne3
1IDES UMR 8148 CNRS, D´epartement des Sciences de la Terre, Universit´e Paris Sud, 91405 Orsay, France 2Laboratoire de Chrono-Environnement, UMR 6249 du CNRS, UFR des Sciences et Techniques, 16 route de Gray,
25 030 Besanc¸on, France
3Laboratoire des Sciences du Climat et de l’Environnement (LSCE), Laboratoire mixte CNRS-CEA, Domaine du CNRS,
Avenue de la Terrasse, 91118 Gif sur Yvette, France
4Laboratoire Morphodynamique Continentale et Cˆoti`ere (M2C) (UMR CNRS 6143),
Universit´e de Caen Basse-Normandie et Universit´e de Rouen, 14000 Caen/76821 Mont-Saint-Aignan, France
Correspondence to: G. Siani ([email protected])
Received: 9 August 2012 – Published in Clim. Past Discuss.: 7 September 2012
Revised: 27 December 2012 – Accepted: 28 January 2013 – Published: 28 February 2013
Abstract. Holocene paleohydrology reconstruction is
de-rived combining planktonic and benthic stable oxygen and carbon isotopes, sea surface temperatures (SSTs) and oxygen isotope composition of seawater (δ18Ow)from a high
sed-imentation core collected in the South Adriatic Sea (SAS). Core chronology is based on 10 AMS 14C measures on planktonic foraminifera and tephra layers. Results reveal two contrasted paleohydrological periods that reflect (i) a marked lowering of δ18Ow/salinity during the early to mid-Holocene
(11.5 ka to 6.3 ka), including the two-step sapropel S1 depo-sition, followed during the mid- to upper Holocene by (ii) a prevailing period of increased salinity and enhanced arid conditions in the South Adriatic Basin. Superimposed on these trends, short-term centennial-scale hydrological events punctuated the Holocene period in the SAS. During the early to mid-Holocene, two main SST coolings together with prominent δ18Ow/salinity lowering delineate the sapropel
S1 interruption and the post-sapropel phase between 7.3 to 6.3 ka. After 6 ka, centennial-scale δ18Ow and G. bulloides
δ13C lowering, mostly centered between 3 to 0.6 ka, reflect short-term hydrological changes related to more intensive runoff of the Po and/or Apennine rivers. These short-term events, even of lesser amplitude compared to the early to mid-Holocene period, may have induced a lowering of sea surface density and consequently reduced and/or inhibited the formation of deep bottom waters in the SAS. Compar-ison of the emerging centennial- to millennial-scale
hydro-logical record with previous climatic records from the cen-tral Mediterranean area and north of the Alps reveal possible synchronicities (within the radiocarbon-dating uncertainty) between phases of lower salinity in the SAS and periods of wetter climatic conditions around the north-central Adriatic Sea. Finally, wavelet analyses provide new clues about the potential origin of climate variability in the SAS, confirm-ing the evidence for a mid-Holocene transition in the central Mediterranean climate and the dominance of a ∼ 1670-yr pe-riodicity after 6 ka, reflecting a plausible connection with the North Atlantic climate system.
1 Introduction
Because of its geographical positioning at the transition be-tween two climatic zones (subtropical high pressure and sub-polar depression), the Mediterranean region is particularly sensitive to regional impacts of climatic changes and ex-treme events (Giorgi and Lionello, 2008). Giving that, ow-ing to the population density in this region, a forecast of the environmental response of the Mediterranean to future cli-mate change is a crucial point, and investigations on clicli-mate archives covering periods of time longer than the instrumen-tal record are required to refine a proper consideration of the natural climate variability. In this way, a better knowledge of the Holocene climate variability in the Mediterranean area
is an essential step to provide new insights for predictive climate models.
Over the last decades, the Mediterranean region has been the focus of studies carried out on the complex interactions between the North Atlantic and North Africa tropical cli-matic systems (Zolitschka et al., 2000). More generally, these interactions accounted for variations (1) of the position of the westerlies and intensity of the African monsoon systems, and subsequently (2) the quantity of precipitation brought to this zone (Bar-Matthews et al., 2000). In addition, proxy recon-structions from Holocene continental and marine archives have suggested periodicities of the climate at decadal, sec-ular and millennial timescales (Kallel et al., 1997a, b; Ched-dadi et al., 1997; Roberts et al., 2001; Sadori and Narcisi, 2001; Rohling et al., 2002; Magny et al., 2003, 2006; Frigola et al., 2007; Marino et al., 2009) related to changes in Earth’s orbital parameters and solar activity (Mayewski et al., 2004; Magny et al., 2007).
The South Adriatic Sea (SAS) is an area characterized by very high sedimentation rates that favor the analysis of Holocene climatic changes at centennial temporal resolution and the interactions between strong atmospheric forcing, pre-cipitation and river runoff (Fontugne et al., 1989; Asioli et al., 2001; Oldfield et al., 2003; Sangiorgi et al., 2002, 2003; Piva et al., 2008). Moreover, this basin is one of the sources of modern deep-sea water formation, playing a key role in changes in the thermohaline circulation in the Mediterranean Sea (Pinardi and Masetti, 2000), and in the North Atlantic Ocean (Sch¨onfeld and Zahn, 2000; Rogerson et al., 2005; Voelker et al., 2006).
Here we present a highly detailed reconstruction of the Holocene paleohydrology at a decadal-scale time resolu-tion, from a high-sedimentation deep-sea core recovered in the SAS. Past circulation dynamic was assessed by sea surface temperature (SST) using the modern analog tech-nique (MAT) coupled with oxygen and carbon isotope mea-surements performed on the planktonic foraminifera
Glo-bigerina bulloides and on the benthic foraminifera Cibi-cidoides pachydermus. Oxygen isotopes on the planktonic
foraminifera G. bulloides and SST reconstructions allow for derivation of changes in the oxygen isotope composition of seawater (δ18Ow), a proxy for salinity, providing clues on
the freshwater budget and paleoceanographic changes in this basin. Our climatic investigation benefits from a very de-tailed chronological framework based on a large data set of AMS14C dating of monospecific planktonic foraminifera coupled to tephra layers (Siani et al., 2004, 2010).
In addition, because of the high timescale resolution, results were compared to marine and continental climate records from the central and eastern Mediterranean areas and north of the Alps in west-central Europe. Finally, wavelet analysis of the paleohydrological record was used to shed light on the possible driver and timing of the Holocene climate variability in the SAS.
2 Studied area and modern circulation pattern in the Adriatic Sea
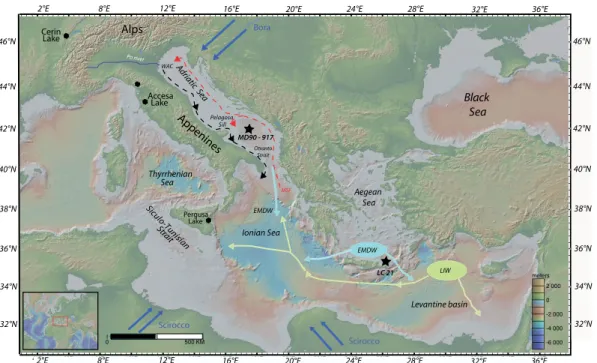
The Adriatic Sea is a semi-enclosed basin detached from the Ionian Sea by the sill of the Otranto Strait (780 m). It is characterized to the north by a wide continental shelf sloping down to 100 m and by the shallow Pelagosa sill (∼ 120 m) that separates the middle basin from the southern-most part, featured by the largest topographic depression of about 1200 m, the South Adriatic Pit (Fig. 1).
The Adriatic Sea is situated between the subtropical high-pressure zone and the mid-latitude belt, in which winds move generally from west to east with sharp seasonal differ-ences (Orlic et al., 1992). In winter, the dominant winds are the Bora blowing from the northeast and the Sirocco from the south, whereas during summer the general atmospheric circulation is dominated by the westerlies.
The modern oceanic circulation pattern depends on several factors including (1) episodic atmospheric events (i.e. Bora) that produce wind-driven currents promoting intense mixing and dense water formation, (2) freshwater discharge char-acterized by strong river runoff from the Po and numerous surrounding rivers, and (3) exchange flow with the Ionian Sea through the Otranto Strait. This produces a seasonal cy-clonic circulation with a northerly inflow component, flow-ing along the eastern coast, represented by the Mediterranean Surface Water (MSW) from the Ionian Basin through the Otranto Strait and by a second southerly outflow compo-nent, i.e. the Western Adriatic Current (WAC) along the west-ern coast (Artegiani et al., 1997; Poulain, 1999). The out-flow is reinforced by a high amount of freshwater, nutri-ents and suspended matter through the Po River with an an-nual mean freshwater discharge rate of about 1500 m3s−1 (Raicich, 1996). In winter, a further inflow of more saline Levantine Intermediate Water (LIW) originating from the eastern Mediterranean Sea spread along the eastern Adri-atic coast. The mixing between LIW and MSW in the South Adriatic Pit forms the Eastern Mediterranean Deep Water (EMDW) that represents the major source of the densest wa-ter in the easwa-tern Mediwa-terranean Sea (Artegiani et al., 1989; Manca et al., 2002). In this context, temperature changes, in-creased terrestrial freshwater runoff and/or a slowdown of incoming saltier LIW in the Adriatic Sea could affect the sea surface hydrology and consequently reduce and/or inhibit the formation of deep waters in the basin.
3 Material and methods
Core MD90-917 was collected during the PROMETE II cruise by the French R/V Marion Dufresne in the deep South Adriatic Basin (41◦170N, 17◦370E, 1010 m; Fig. 1). Coring at this site recovered a fairly uniform succession of 21 m of gray to brown carbonaceous clays, including a black layer in the upper part of the core that referred to the two sub-units
Ionian Sea Thyrrhenian Sea Pergusa Lake Levantine basin Cerin Lake Aegean Sea Accesa Lake Appenines LC 21 Otranto Strait MD90 - 917 Adriatic Sea EMDW LIW Alps Po river
2°E 8°E 12°E 16°E 20°E 24°E 28°E 32°E 36°E
2°E 8°E 12°E 16°E 20°E 24°E 28°E 32°E 36°E 46°N 44°N 42°N 40°N 38°N 36°N 34°N 32°N 46°N 44°N 42°N 40°N 38°N 36°N 34°N 32°N EMDW WAC MSF Pelagosa Sill Bora Siculo-Tunisian Str ait Black Sea Scirocco Scirocco
Fig. 1. Location of the studied core MD90-917 and reference sites in the Mediterranean and north of the Alps. Core LC-21 (Rohling et al.,
2002; Marino et al., 2009), Cerin Lake (Magny et al., 2011a), Accesa Lake (Magny et al., 2007), Pergusa Lake (Magny et al., 2012a). Blue arrows correspond to the main low-level winds (Bora and Scirocco). LIW = Levantine Intermediate water, EMDW = Eastern Mediterranean Deep Water, MSF = Mediterranean Surface Water, WAC = Western Adriatic Current.
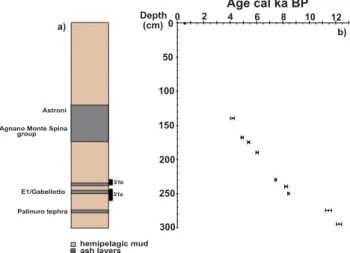
of the sapropel S1 and several ash layers (Siani et al., 2004). Sapropel S1 was deposited during the most recent period of stagnation in the eastern Mediterranean Sea between ca. 10 and 6 cal. ka BP (Rossignol-Strick et al., 1982; Rohling, 1994; Fontugne et al., 1994; Mercone et al., 2000; De Lange et al., 2008) and is characterized in the studied core by two levels of black-gray sediments from 229 cm to 255 cm (S1a and S1b), separated by a thin horizon of white hemipelagic ooze between 239 cm and 247 cm corresponding to the sapro-pel interruption (Fig. 2). For this study, the first 3 m of the core have been analyzed.
Oxygen and carbon isotope measurements (δ18O, δ13C) were performed on the planktonic foraminifera G. bulloides and on the benthic foraminifera C. pachydermus, respec-tively, in the size fraction (250–315 µm). The foraminifera
δ18O is a function of both temperature and seawater δ18O (δ18Ow), the latter reflecting mainly the changes of the global
ice volume and local hydrological variations (Shackleton, 1974). The δ13C measured on planktonic foraminifera is an ideal proxy for understanding the carbon relationships among the land, atmosphere and sea, as well as the carbon exchange within the water column. On the other hand, the
δ13C signal of benthic foraminifera gives information on the oceanic carbon cycle, and it is largely used to reconstitute past oceanic circulation changes as well as organic carbon flux in the oceanic bottom waters (Blanc and Duplessy, 1982; Duplessy et al., 1988; Sarnthein et al., 1994; Mackensen et al., 2001; Curry and Oppo, 2005).
In this study, 35 additional stable isotope analyses of planktonic foraminifera integrate the previously published data set (Siani et al., 2010) with a sampling resolution every 2 cm. By contrast, due to the lesser occurrence of the oxic benthic foraminifera species along the core, a lower sam-pling resolution was obtained for oxygen and carbon isotope measurements on the epibenthic foraminifera C.
pachyder-mus. Isotope analyses were performed at LSCE on a
Finni-gan D+ and Elementar Isoprime mass spectrometers. Results are expressed versus Vienna Pee Dee Belemnite standard (VPDB), in per mil with respect to NBS-19 calcite standard (δ18O = −2.20 ‰ and δ13C = +1.95 ‰). The mean exter-nal reproducibility (1σ ) of carbonate standards is ± 0.06 ‰ for δ18O and ± 0.04 ‰ for δ13C; measured NBS- 18 δ18O is −23.2 ± 0.2 ‰ VPDB, and δ13C is −5.0 ± 0.1 ‰ VPDB. The samples were cleaned in a methanol ultrasonic bath for a few seconds and roasted under vacuum at 380◦C for 45 min prior to analysis, following the procedure described by Duplessy (1978).
Sea surface temperatures (SSTs) were determined us-ing planktonic foraminifera assemblages. Each foraminifera sample (> 150 µm fraction) was split into 300–1000 individ-uals for identification and counting. The SSTs were calcu-lated by applying the modern analog technique (Prell, 1985), using the Mediterranean database (Kallel et al., 1997a) and the PaleoAnalogs software (Theron et al., 2004). As for the oxygen isotope record, 35 additional SST estimates have been carried out along the first 3-m of the core to complete
Astroni
Agnano Monte Spina group E1/Gabellotto Palinuro tephra hemipelagic mud ash layers 0 2 4 6 8 10 12 0 50 100 150 200 250 300 Age cal ka BP Depth (cm) S1a S1b a) b)
Fig. 2. (a) Lithology as a function of depth of the core MD90-917.
S1a and S1b refer to the two-step sapropel units. Gray lines mark tephra layers recovered along the core and their origin. (b) Age– depth relation for core MD90-917 based on 10 linearly interpolated
14C AMS dates.14C ages are shown in calendar ka BP including a
reservoir14C age correction as indicated in Siani et al. (2000, 2001).
the previous record of Siani et al. (2010). Reliability of SSTs is estimated using a square chord distance test (dissimilarity coefficient) that represents the mean degree of similarity be-tween the sample and the best ten modern analogs. When the dissimilarity coefficient is lower than 0.25, the recon-struction is considered to be of good quality (Overpeck et al., 1985). Besides winter and summer SST estimates, we have derived SSTs during April–May as the isotopic temper-ature of G. bulloides and the April–May Levitus SST are best correlated (Kellel et al., 1997a; Levitus, 1982, Levitus and Boyer, 2004). These results coincide with the most produc-tive period during the spring and the contemporary bloom of
G. bulloides in the Mediterranean Sea (Pujol and
Vergnaud-Grazzini, 1995). Good dissimilarity coefficients generally
<0.25 are calculated in core MD90-917 with an average value at 0.15. The calculated mean standard deviation of SST estimates is ∼ 0.7◦C.
Sea surface salinity as expressed by the local seawater
δ18Ow was determined following the method proposed by
Duplessy et al. (1991). SST and planktonic foraminifera
δ18O records were used to estimate the surface water
δ18Ow variations by solving the paleotemperature
equa-tion of Shackleton (1974), using the April–May SSTs that represent the period when G. bulloides species de-posited their shell in isotopic equilibrium with ambient water (Kallel et al., 1997a):
T (C◦) =16.9 − 4.38(δ18Ocalcite−δ18Ow+0.27)
+0.1(δ18O foraminifera − δ18Ow+0.27)2.
δ18Owvariations reflect both the global change of the mean
oceanic isotopic composition due to continental ice vol-ume changes and the local change due to the variations of
the freshwater inflow and evaporation balance. Local δ18Ow
changes were then obtained by subtracting the effect of con-tinental ice melting on global seawater δ18O. The latter is assumed to be equal to the deglacial sea level curve of Lam-beck and Chappell (2001) multiplied by a constant coeffi-cient of 1.1 ‰/130 m from Waelbroeck et al. (2002). We did not convert the δ18Ow values into salinity units because of
uncertainty resulting from possible temporal changes in the slope of the δ18Ow/salinity relationship at the studied core
site (Kallel et al., 1997b). The accuracy of the δ18Ow
esti-mates depends primarily on that of the SST estiesti-mates. Tak-ing into account the 0.07 ‰ error due to mass spectrome-ter measurements and the mean standard deviation on SSTs (∼ 1◦C error for SST estimates would result in a 0.23 ‰ error in the calculated δ18Ow value), the averaged error on
the δ18Owestimate is 0.18 ± 0.06 for the South Adriatic Sea
(σ SSTsv= 0.7◦C).
Wavelet analysis (WA) is a technique used for the identifi-cation of spectral signatures in paleoclimate time series, with the particular advantage of describing non-stationarities, i.e. discontinuities and changes in frequency or magnitude (Torrence and Compo, 1998). In contrast to classical Fourier analysis, the local wavelet spectrum provides a direct visu-alization of the changing statistical properties in stochastic processes over time. Here, the Morlet wavelet (a Gaussian-modulated sin wave) was chosen for the continuous wavelet transform. The data series was zero-padded to twice the data length in order to avoid edge effects and spectral leakage pro-duced by the finite length of the time series. The statistical significance of peaks in the local wavelet spectrum was as-sessed using a Monte Carlo simulation. Singular spectrum analysis was employed to estimate and separate background noise. Autoregressive modeling was used to determine the AR(1) stochastic process against which the initial time se-ries was to be tested; AR(1) background noise is red noise (AR(1) > 0). Black lines on the scalogram define 95 % con-fidence. By using wavelet reconstruction it is possible to re-construct the signal in various spectral bands. In this way, we use it to reconstruct the millennial-scale component in the paleoclimatic data.
4 Chronological framework
The age model, based on 10 AMS 14C measurements performed on monospecific planktonic foraminifera in the size fraction > 150 µm, was previously given in Siani et al. (2010; Fig. 2). We do not take into account ageing of
14C dates by bioturbation processes because of the high
sed-imentation rate in the core, estimated at 35 cm ka−1 for the Holocene period and at 20 cm ka−1 during the sapropel S1 interval (Mercone et al., 2000; Charbit et al., 2002). This re-sults in a time resolution of sampling intervals for δ18O on planktonic foraminifera G. bulloides, SST and δ18Ow
sapropel S1, respectively. The conventional radiocarbon ages have been subsequently converted into calendar ages, based on INTCAL04 (Reimer et al., 2004) using the14C calibra-tion software CALIB 6. The calibracalibra-tion integrates a marine
14C reservoir age correction R(t) at 390 ± 85 yr according to
Siani et al. (2000, 2001). In addition, the age model is com-plemented by five tephra layers previously identified along the first 3 m of the core, providing further dating points and allowing for a better and more precise chronological frame-work covering the last 11 500 cal. yr BP (Siani et al., 2004). In this study, hereafter, all ages are discussed as cal. ka BP.
5 Results
5.1 Sea surface temperature record
During the Holocene, South Adriatic April–May SST esti-mates range from 18◦C to 13◦C (Fig. 3b). The Younger Dryas–Holocene transition was recorded at ∼ 11.5 ka, and the highest SSTs were achieved during the Holocene climatic optimum at ∼ 8.4 ka coeval to the sapropel S1a deposit. Con-versely, during the sapropel S1b SSTs are slightly lower and similar to the modern ones. Then, two main cold spells mark the S1 interruption at 8.2 ka and after the S1b deposit be-tween 7.3 to 6.3 ka respectively. Interruption of the sapropel formation has been previously observed in the Adriatic Sea (Bottema and Van Straaten, 1966; Mangini and Schlosser, 1986; Fontugne et al., 1989; Sangiorgi et al., 2003) and a short duration estimated at around 200 yr (Rohling et al., 1997). This short event was also recorded by marine and ter-restrial pollen records from the Northern Aegean Sea (Kot-thoff et al., 2008a, b; Pross et al., 2009) and more recently in the far south of this basin by artificial neural networks (ANN) based summer SST estimations on planktonic foraminifera abundance (Fig. 4c; Marino et al., 2009). After the cold 8.2-ka event, SSTs rise by about 3◦C, displaying similar val-ues to the modern ones, followed by a short-lived centennial lighter cooling (∼ 1◦C) between 7.8 and 7.5 ka at the time of sapropel S1b (Fig. 3b).
A more pronounced SST cooling between 7.3 ka and 6.3 ka by some 4◦C marks the post-sapropel S1b deposi-tion even though the general cooling trend is interrupted by two short centennial warm spells centered at 7.1 and 6.5 ka respectively. These cooling phases are marked by the dom-inance of the sub-polar planktonic foraminifera
Neoglobo-quadrina pachyderma right coiling, as previously observed
in the Adriatic Sea (Giunta et al., 2003; Sangiorgi et al., 2003) and in the Tyrrhenian Sea by Kallel et al. (1997a). By contrast, the alkenone SST reconstructions obtained in the close South Adriatic core AD91-17 indicate no cooling dur-ing the sapropel interruption or between 7.3 and 6.3 ka (San-giorgi et al., 2003). This discrepancy between the alkenone SST reconstructions and the MAT could be due to differences in the growing season of the calcareous nannoplankton as-semblages as already pointed out by Sangiorgi et al. (2003).
S1a S1b
HOLOCENE YoungerDryas
-42 -40 -38 -36 -34 0 0,2 0,4 0,6 0,8 1,0 1,2 1,4 1,6 1,8 a) b) c) d) e) f ) g) Roman Period -2,5 -2,0 -1,5 -1,0 -0,5 0 0 1 2 3 4 5 6 7 8 9 10 11 1213 2,5 2,0 1,5 1,0 0,5 0 1,5 2,0 2,5 3,0 3,5 4,0 0,5 1,0 1,5 2,0 2,5 3,0 0 8 10 12 14 16 18 Age cal. ka BP δ 18O (‰ vs. SMOW) δ 18 O G. bulloides (‰ vs. PDB) SST (°C) april-may δ18 O C.Pachydermus (‰ vs. PDB) δ 13 C C.pachydermus (‰ vs. PDB) δ13 C G. bulloides (‰ vs. PDB) δ 18 Ow (‰ vs. SMOW) more saline less saline
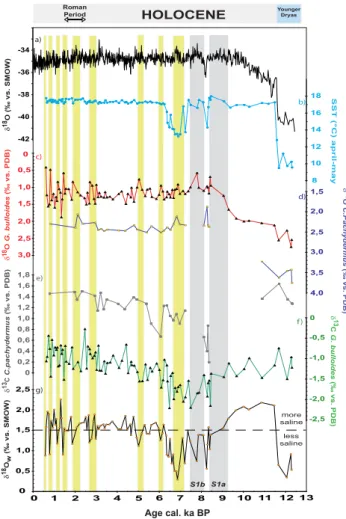
Fig. 3. Climatic record from core MD90-917 and comparison
with Greenland ice core since the Younger Dryas–Holocene tran-sition vs. age (cal. ka BP): (a) oxygen isotope record from GISP 2 ice core. (b) April–May sea surface temperature as determined by the modern analog technique (MAT). (c) δ18O of the plank-tonic foraminifera Globigerina bulloides. (d) δ18O of the ben-thic foraminifera Cibicidoides pachydermus. (e) δ13C of the ben-thic foraminifera Cibicidoides pachydermus. (f) δ13C of the plank-tonic foraminifera Globigerina bulloides. (g) Calculated sea water
δ18O record (δ18Ow)generated from the SST by MAT and G. bul-loides δ18O by solving the paleotemperature equation of Shackle-ton (1974); dashed line corresponds to modern δ18Owvalues in the
South Adriatic after Pierre (1999). S1a and S1b refer to the two-step sapropel S1 deposition. Yellow bars indicate low δ18Ow/salinity
values.
However, even though South Adriatic SST reconstructions by MAT are in agreement with the Tyrrhenian Sea ones, they differ considering that the SST decrease in the Tyrrhenian Sea cannot be referring to the sapropel (s.s.) deposit due to the absence of a well-marked sapropelic horizon in this basin (Kallel et al., 1997a). Finally, a further SST increase occurred at 6.8 ka, and temperature has remained on a stable trend since about 6.3 ka displaying mean values similar to those observed today (Fig. 3b).
S1a S1b a) b) c) d) 8 10 12 14 16 18 20 4 5 6 7 8 9 10 11 12 13 S.Adriatic SST (°C) april-may 16 18 20 22 24 26 28 Aegean ANN Summer SST (°C) 0,5 1 1,5 2 2,5 0 S.Adriatic δ18 Ow (‰ vs. SMOW) 1 1,5 2 2,5 3 3,5 Aegean δ18 O w (‰ vs. SMOW) Age cal. ka BP 8.2 event
HOLOCENE YoungerDryas
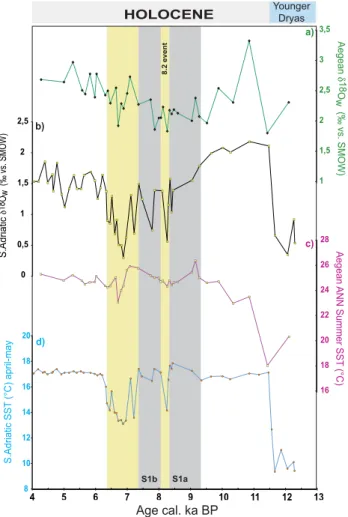
Fig. 4. Comparison between the South Adriatic Sea (this study)
and the Aegean Sea climatic record from core LC-21 (Rohling et al., 2002; Marino et al., 2009) vs. age (cal. ka BP). (a) Aegean Sea δ18Ow record. (b) South Adriatic δ18Ow record. (c)
Artifi-cial neural networks (ANN) based summer SST estimations in the Aegean Sea. (d) April–May South Adriatic Sea surface temperature by MAT. Gray areas refer to S1a and S1b sapropel deposition and yellow areas to the S1 interruption and post-S1b phase in the South Adriatic Sea.
5.2 Stable isotopes
The δ18O records from core MD90-917 show values range from 0.4 to 2.5 ‰ for G. bulloides and from 1.8 ‰ to 2.6 ‰ for C. pachydermus (Fig. 3c, d). A shift from 11.5 ka to 8.4 ka toward depleted δ18O in the G. bulloides values marks the second step of the deglaciation. In detail, the G. bulloides
δ18O record shows the highest values of ∼ 2.5 to 2 ‰ at the Younger Dryas–Holocene transition (11.5 ka), whereas the lowest values are at 7.8 ka and 0.6 ka respectively. The δ18O record of the epibenthic species C. pachydermus exhibits a feature similar to the G. bulloides δ18O one with the highest values centered at 11.5 ka and the lowest during the sapro-pel S1 interruption at 8.2 ka as displayed by a 0.5 ‰ oxygen isotope depletion (Fig. 3d). Nonetheless, no data are
avail-able during the sapropel S1a and S1b due to anoxic condi-tions, hence the lack of benthic foraminifera generally used for isotope analyses.
Similarly, the most striking characteristic of the δ13C Holocene records is the high variability with values ranging from −2.2 to −0.3 ‰ for G. bulloides and between 1.6 ‰ and 0.2 ‰ for C. pachydermus (Fig. 3e, f). A general decreas-ing trend marks the G. bulloides δ13C record from 11.5 ka to 6.3 ka with the higher values centered at the onset of the Holocene and the more depleted values characterizing the pe-riod of the sapropel S1 deposition (Fig. 3e). The C.
pachy-dermus δ13C record displays a similar trend even though, as seen above, the lack of oxic benthic foraminifera during the sapropel S1 precludes a continuous bottom waters hydrolog-ical record (Fig. 3f). Since then, a rise of δ13C values for both planktonic and benthic foraminifera records character-izes the post-sapropel period (Fig. 3e, f). However, irrespec-tive of their general trends, both δ18O and δ13C records dis-play short-term centennial- to millennial-scale fluctuations throughout the Holocene period.
5.3 Sea surface δ18Ow/salinity record
δ18Ow values display a high variability between 2.2 ‰ and
0.3 ‰ over the last 11.5 ka (Fig. 3g). The highest δ18Ow
values occurred at the early and upper Holocene, while the lowest ones are associated with (i) the sapropel S1 deposi-tion, (ii) the cold event at 8.2 ka and (iii) the post-sapropel S1b phase between 7.3 and 6.3 ka (Fig. 3g). The transi-tion between the Younger Dryas event and the Holocene is characterized by an abrupt δ18Ow increase of 1.8 ‰. Then,
from ∼ 11 ka to ∼ 6.8 ka, the δ18Ow compositions lie on a
decreasing trend of some 1.9 ‰, suggesting a pronounced surface water salinity decrease. Smaller centennial fluctu-ations of about 0.7 ‰ and 1 ‰ are superimposed over the inferred main decreasing trend during the sapropel S1a and S1 interruption respectively (Fig. 3g). Moreover, the sapro-pel S1b is punctuated by high amplitude δ18Ow short-term
changes with a more saline phase between 8.1 and 7.8 ka and at ∼ 7.5 ka separated by a pronounced salinity decrease recorded at ∼ 7.7 ka. Finally, a large δ18Owdrop (1 ‰)
oc-curred at the end of the sapropel S1b between 7.3 and 6.8 ka separated by an abrupt short-term δ18Ow increase at 7.1 ka.
Therefore, the main salinity (δ18Ow)decreases do not occur
during the deposition of the sapropelic horizons but rather during the S1 interruption and the post-sapropel S1 depo-sition. We can thus infer that the whole salinity increase at the transition between the Younger Dryas and the Holocene is completely counterbalanced after the second phase of the sapropel S1.
A more pronounced increase in surface water δ18Ow
(∼ 1 ‰) was finally recorded from ∼ 6.9 ka, suggesting a progressive salinity rise before attaining mean present-day values at about 6.3 ka. However, it should be empha-sized that, despite the salinity rise, short-term centennial- to
millennial-scale δ18Owfluctuations distinguished the mid- to
upper Holocene period (Fig. 3g).
6 Discussion
6.1 Holocene hydrological changes in the SAS
The stratigraphical record and SST estimates of the marine deep-sea core MD 90–917 have shown that the major cli-matic changes in this basin are in phase with the Greenland ice core record (Fig. 3a, b; Siani et al., 2001, 2010). This rep-resents a solid starting point to provide new insight about the exact timing of the past hydrological evolution in the South Adriatic Sea, thus facilitating comparison with other climatic records at regional and global scale.
Our multi-proxy paleohydrological reconstructions have revealed two majors trends: an early to mid-Holocene pat-tern between 11.5 ka and 6.3 ka marked by a lowering of
δ18Ow/salinity and of the planktonic and benthic δ13C
val-ues followed by a shift toward higher valval-ues during the mid-to upper Holocene (Fig. 3e, f, g).
Superimposed on the general δ18Owand G. bulloides δ13C
trends, short-term centennial- to millennial-scale fluctuations characterized the Holocene period in the SAS. It was also revealed that during the early to mid-Holocene South Adri-atic SST changes match short-term δ18Owfluctuations.
Con-versely, since about 6 ka, SSTs display rather weak variabil-ity, whereas sea surface water proxies show higher amplitude oscillations, indicating a disconnection from temperature in-fluence. Interestingly, most of the δ18O
w/salinity lowering
match well G. bulloides δ13C ones, suggesting a causal link between both records (Fig. 3f, g).
The G. bulloides δ13C record of Adriatic surface water could reflect a combination of global carbon budget changes, the degree of air–sea isotopic equilibration and regional changes in upwelling or in δ13C of its source waters (Pierre, 1999). The oligotrophic state of the Mediterranean Sea after the phase of the sapropel S1, and the absence of correspon-dence between temporal δ13C changes and the global rise of atmospheric CO2, allow us to relate lower G. bulloides
δ13C values to the increasing input via the Po and/or coastal Italian, Apennine and Albanian rivers of remineralized conti-nental organic matter presenting depleted δ13C values. In this regard, a recent survey of the carbon isotope composition of the planktonic foraminifera along the southern Italian coast of the Adriatic Sea pointed out a strong relationship between lower δ13C values and the increasing influence of less saline waters originated from the input of the Po River (Grauel and Bernasconi, 2010).
6.1.1 Millennial-scale Holocene climatic variability
During the early Holocene (11.5 to 9 ka) the δ18Ow record
from core MD90-917 indicates significant millennial-scale hydrological changes in accordance with previous
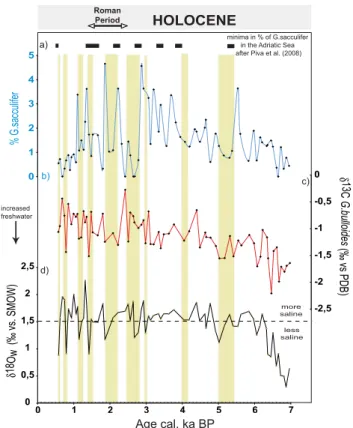
recon-increased freshwater a) c) HOLOCENE Roman Period δ18 Ow (‰ vs. SMOW) Age cal. ka BP 0 0,5 1 1,5 2 2,5 0 1 2 3 4 5 6 7 δ 13 C G.bulloides (‰ vs PDB) -2,5 -2 -1,5 -1 -0,5 0 0 1 2 3 4 5 % G.sacculifer d) b) minima in % of G.sacculifer in the Adriatic Sea after Piva et al. (2008)
more saline
less saline
Fig. 5. Comparison of the surface dwelling foraminifera Glo-bigerinoides sacculifer abundance and hydrological changes in core
MD90-917 vs. age (cal. ka BP). (a) G. sacculifer minima events recorded in the Adriatic Sea (Piva et al., 2008). (b) Percentage of G. sacculifer in core MD90-917. (c) δ13C of the planktonic foraminifera G. bulloides. (d) Sea water δ18O record (δ18Ow).
Yel-low bars indicate δ18Ow/salinity and G. bulloides δ13C minima.
structions in the Tyrrhenian and Aegean seas, in the Strait of Sicily and in the Levantine Basin (Kallel et al., 1997a; Emeis et al., 2000; Essellami et al., 2007; Marino et al., 2009). This is in turn confirmed by the planktonic foraminifera δ18O records displaying a trend identical to the SAS one with a similar negative ∼ 2 ‰ shift during the same time interval (Fig. 3c). This suggests that these basins were influenced by similar climatic conditions, and the salinity lowering of the surface waters had probably a common origin. Such hydro-logical changes occurred during the intensification of the or-bitally forced African monsoon activity establishing the on-set of humid conditions in the eastern Mediterranean Basin (Rossignol-Strick et al., 1982; Richie et al., 1985). This in-duced an intensified flooding of the Nile and small African tributary rivers and the resulting input of isotopically light freshwater, weakening the Mediterranean thermohaline cir-culation and leading to the sapropel S1 formation (Rossignol-Strick et al., 1982; Fontugne et al., 1994; Rohling, 1994; Kallel et al., 1997b; Emeis et al., 2000; Scrivner et al., 2004). The large drop in salinities at the beginning of the Holocene and during the sapropel S1 was observed during increased
pluvial conditions in the South Adriatic Sea (Combourieu-Nebout et al., 1998) coeval to a period of enhanced rainfall in the eastern Mediterranean region (Bar-Matthews et al., 2000). Likewise, Kallel et al. (1997b) showed that sea sur-face salinity during the sapropel S1 was lower than today and almost homogeneous in the whole Mediterranean Sea according to marked pluvial conditions that equilibrated the negative freshwater budget.
During the early to mid-Holocene (9 to 6.3 ka), the emerg-ing hydrological pattern observed in the South Adriatic record presents a feature similar to that documented in the Aegean Sea (Rohling et al., 2002; Marino et al., 2009). The strong resemblance between both climatic records, as also pointed out by similar δ18Owamplitude changes, emphasizes
a broad climatic link between these basins (Fig. 4). Inter-estingly, the post-sapropel S1 SST cooling recorded in the Aegean Sea is coeval, within chronological 1σ uncertain-ties, to the SAS one dated between 7.3 and 6.3 ka (Fig. 4c, d; Marino et al., 2009). Such cooling has been related to a long-term (multi-decadal) period of severe winter outbreaks of cold and dry northeast winds (Rohling et al., 2002). There-fore, we argue that these cooling events may have induced the resumption of deep-water formation after the sapropel S1b both in the Adriatic and Aegean seas. Indeed, density of the surficial waters was sufficiently high during the post-sapropel termination to enable the ventilation of the deep Adriatic Basin, due to the counterbalance between salinity depletion and SST decrease. This scenario is also confirmed by higher benthic δ13C values (∼ 1.1 ‰) recorded between 7.3 and 6.3 ka, attesting to a resumption of the Adriatic deep-sea wa-ter formation just afwa-ter the sapropel S1b phase (Fig. 3e). Such a feature is corroborated by a significant increase in the abun-dance of the benthic foraminifera Cibicidoides observed in the Aegean Sea (Kuhnt et al., 2007; Abu-Zhied et al., 2008) and in the South Adriatic (Jorissen et al., 1993) indicating the return to full oxic conditions.
The increased precipitation during the sapropel S1 event does not necessarily represent the sole condition which re-leased a drop in sea surface salinity favoring deep water stag-nation. Indeed, the global climatic pattern observed at the time of sapropel S6 formation coincided with an arid cli-mate phase as indicated by the reduction of Mediterranean evergreen vegetation and by the pollen sequence of
Quer-cus (Cheddadi and Rossignol Strick, 1995). This large drop
in salinities, observed during the sapropel S1, was also syn-chronous to the Holocene sea-level rise by ∼ 35 m in the ocean (Lambeck and Chappell, 2001), and persisted until the second SST cooling observed between 7.3 and 6.3 ka while the melting of the global ice sheets was largely complete The sea level rise was probably the sole short event which could have influenced the oceanic circulation in the Mediterranean Sea at the time of sapropel S1. In the Adriatic Sea a sea level rise of ∼ 35 m probably induced a seawater transgression, flooding the ancient coastlines. Such a transgression gave rise to erosional and depositional processes, increasing markedly
the feeding of continental organic matter in the seawater dur-ing the sapropel S1. This hypothesis agrees with data pro-posed by Fontugne et al. (1989) on the origin of the organic matter in the Adriatic Sea during the sapropel S1 deposition. The large G. bulloides δ13C drop by about 1 ‰ between 9.1 and 6.3 ka indicates prominent sea surface water δ13C de-pletion during and after the sapropel S1 period (Fig. 3f). The low δ13C values of surface CO2might be resulted from the
remineralization of continental organic matter that presents depleted δ13C values. Fontugne and Calvert (1992) proposed that markedly low δ13C values of the planktonic foraminifera
Globigerinoides ruber in the sapropels probably reflect the
shift in isotopic composition of dissolved inorganic carbon due to the mixing of freshwater. The sapropel S1 δ13C deple-tion could also indicate a decrease of the level of photosyn-thesis, as generally it extracts light CO2from surface waters
and leads to increased13C content (Shackleton et al., 1983). The following mid- to upper Holocene period is charac-terized by a δ18Ow/salinity increase since ∼ 6 ka, attesting to
an aridification phase in the South Adriatic Sea coeval to the end of the postglacial sea level rise (Fig. 3g). This interval is accompanied by the complete resumption of deep convec-tion in the Adriatic Sea since 6 ka as indicated by higher C.
pachydermus δ13C values (∼ 1.3 ‰) similar to the modern
ones (Fig. 3e). This result is in agreement with the last oc-currence in the subsurface water masses of the planktonic foraminifera Globorotalia inflata that marks the onset of the modern circulation regime distinguished by changes in Adri-atic water column structure becoming more oligotrophic at surface as today (Siani et al., 2010).
6.1.2 Centennial-scale Holocene climate variability
The SAS hydrological record from core MD90-917 also il-lustrates Holocene short-term centennial climatic variabil-ity. During the early to mid-Holocene, a short-term SST and
δ18Ow/salinity decrease was observed during the S1
interrup-tion, coeval to the δ18O minimum recorded in Greenland ice cores and in lacustrine series at 8.2 ka (Fig. 3b, g; Johnsen et al., 1992; von Grafenstein et al., 1998). During the S1 interruption, density of the surficial waters was sufficiently high to permit ventilation of the deep Adriatic Basin, due to the counterbalance between salinity depletion and SST de-crease. However, the benthic δ13C record in core MD90-917 indicates lower values compared to modern ones during the S1 interruption (between 0.9 to 0.2 ‰), probably due to a mixture between the stagnant and old carbon depleted deep-water masses at the time of the sapropel S1 and those of the “new” formation (Fig. 3e). Resumption of a major deep-water convection during this short event is also distinguished by the re-occurrence of benthic oxygen supply foraminifera in the SAS (Jorissen et al., 1993; Rohling et al., 1997).
The most striking feature that punctuated the mid- to up-per Holocene in the SAS is the occurrence of short-lived low
2–1.8, 1.4, 1.2 and 0.8–0.6 ka (Fig. 3g). As already discussed above, most of the δ18Ow/salinity short-term lowering
corre-spond to the drop in G. bulloides δ13C values and do not re-flect primarily temperature changes as displayed by the SST record. Therefore, these short δ13C spells should rather be re-lated to lower salinity events. Such negative salinity anoma-lies may be attributed either to an enhanced river flooding from the Po, Apennine and Albanian rivers or to reduced Levantine Intermediate Waters intrusion in the SAS.
To verify the hypothesis of a plausible influence of en-hanced riverine freshwater, we considered the abundance dis-tribution of the oligotrophic, shallow water dweller plank-tonic foraminifera Globigerinoids sacculifer in core MD90-917 (Fig. 5). According to the micropaleontological study of Piva et al. (2008) carried out on several cores in the Adriatic Sea, the frequency peaks of G. sacculifer were interpreted in terms of hydrological optimum conditions characterized by low turbidity of the water column and reduced river runoff. Conversely, the drop in G. sacculifer concentration was re-lated to short-lived phases of cool and rainy events and in-creased river runoff (Piva et al., 2008).
Interestingly, over the last 6 ka the main frequency of G.
sacculifer minima previously recorded in the southern and
central Adriatic at around 1.4, 2.2, 3.2–2.7, 3.8 and 5 ka (Piva et al., 2008) are coeval, within chronological 1σ uncertain-ties, with the G. sacculifer minima events recorded in core MD90-917 (Fig. 5a, b). In addition, with the exception of the event dated at 2.9 ka, the short-lived phases of δ18Ow/salinity
and G. bulloides δ13C match well changes of G. sacculifer distribution in core MD90-917 (Fig. 5c, d). This provides ad-ditional constrains for an increased riverine discharge most likely from the Po River around the semi-enclosed Adriatic Basin. However, we cannot discard the influence of distinct inputs from several Apennine rivers (Frignani et al., 2005; Palinkas and Nittrouer, 2006).
A further valuable support to our interpretation is based on sedimentological and micropaleontological studies carried out on marginal Adriatic marine deposits to reconstruct the depositional evolution of the Po River delta (Correggiari et al., 2005; Stefani and Vincenzi, 2005; Amorosi et al., 2008; Rossi and Vaiani, 2008). These studies have shown evidence of increased Po River discharge events, which took place after the maximum marine transgression dated at ∼ 5.5 ka. Accordingly, the temporary increase of Po River discharge at 4.7 ± 0.15 ka (Rossi and Vaiani, 2008) is coeval, within chronological 1σ uncertainties, to the G. bulloides δ13C and
δ18Owminima event dated in core MD90-917 between 5 and
4.8 ka. Similarly, the occurrence of several generation of cus-pate delta developed across the Po Plain between 3 to 0.9 ka have also been related to an increasing sediment supply trig-gered both by the clearing of forest in the watershed and by increased precipitation and/or meltwater (Correggiari et al., 2005; Stefani andVincenzi, 2005).
Interestingly, most of the δ18Owand δ13C minima events
recorded in core MD90-917 fall within the same time interval (Figs. 3, 5).
The centennial-scale SAS hydrological events also corre-spond to the wet-dry-wet cycle reconstructed in the central Mediterranean during the Roman Period (RP) between ca. 2.6 and 1.6 ka (Dermody et al., 2012). These events, mainly related to the position and intensity of the jet streams, have been correlated to millennial changes in North Atlantic os-cillation mode (Chen et al., 2011; Dermody et al., 2012).
An alternative hypothesis to decipher these short-term events could relate to the balance between the strengthening or weakening in the rate of LIW formation and its intrusion in the South Adriatic Sea. A slowdown of the LIW forma-tion in the Levantine Basin marked by a pronounced salinity lowering was observed at ca. 3 ka (Emeis et al., 2000). This event could correspond to the δ18Ow/salinity minima event and be the coeval short-term C. pachydermus δ13C decrease centered at around 2.9 ka in the SAS (Fig. 3e, g).
The inferred short-term hydrological changes, even of lesser amplitude compared to the early to mid-Holocene pe-riod, might have precluded the formation of deep bottom wa-ters in the South Adriatic Sea. In fact, it is well known that the formation of deep Adriatic bottom waters is very sensi-tive to small increases in water temperature (0.7◦C) or small decreases in salinity (0.2 per mil) promoting stratification of water masses (Mangini and Sclosser, 1986). Striking ev-idence was observed for 2 to 0.8 ka, where the centennial-scale δ18Owand δ13C minima events correspond to the lack
of oxic benthic foraminifera in core MD90-917, suggesting a period during which the formation of deep bottom waters in the South Adriatic Sea was probably more reduced than today.
6.2 Holocene land–sea climatic comparison
To decipher possible land–sea relationships as suggested by the examination of the isotope records from core MD90-917 in the preceding discussion, Fig. 6 presents comparisons of the sea surface δ18Ow/salinity record of core MD90-917 with
paleohydrological records established in the central Mediter-ranean area and north of the Alps in west-central Europe. The data collected in the central Mediterranean are based on (1) pollen-inferred quantitative estimates of annual precipi-tation (PANN) in Pergusa (Sadori and Narcisi, 2001; Magny et al., 2012a), (2) glacier advances and alluvial events in the Gran Sasso Massif in central Italy (Giraudi, 2005a, b), (3) paleohydrological variations reconstructed in southern and central Italy (Giraudi et al., 2011) from various prox-ies, and (4) the lake-level records from Lake Accesa in cen-tral Italy (Magny et al., 2007, 2012b). The data collected north of the Alps in west-central Europe are based on (1) a lake-level record reconstructed at Lake Cerin in the Jura Mountains (Magny et al., 2011a) and a regional lake-level record established for west-central Europe (Magny, 2004,
Core MD90-917 (Adriatic Sea)
PANN at Lake Pergusa in Sicily (Magny et al., 2012a)
1,5 1 -0.5 2 5 0 10 15 Subfossil woods and peat discs washed out by glacier streams
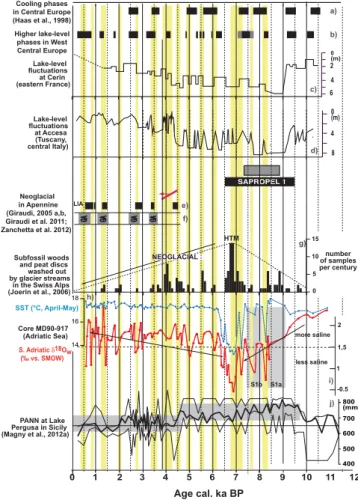
in the Swiss Alps (Joerin et al., 2006) number of samples per century NEOGLACIAL HTM LIA 0 1 2 3 4 5 6 7 8 9 10 11 12 S1b S1a more saline less saline SAPROPEL 1 400 500 600 700 800 (mm) GA GA GA GA 4 8 0 (m) Lake-level fluctuations at Accesa (Tuscany, central Italy) 0 (m) 2 4 6 Lake-level fluctuations at Cerin (eastern France) 14 16 18 S. Adriatic δ18Ow (‰ vs. SMOW) Higher lake-level phases in West Central Europe Cooling phases in Central Europe (Haas et al., 1998) SST (°C, April-May) a) b) c) d) e) f) g) h) i) j) Age cal. ka BP Neoglacial in Apennine (Giraudi, 2005 a,b, Giraudi et al. 2011; Zanchetta et al. 2012)
Fig. 6. Comparison between the hydrological record from core
MD90-917 (this study) and continental climate proxies: (a) cen-tral Europe cooling events reconstructed from various proxies in the Swiss Plateau and Alps (Haas et al., 1998). (b) Phases of higher lake level in west-central Europe (Magny, 2004, 2006). (c) Lake-level record of Cerin (Magny et al., 2011a); (d) lake-Lake-level record of Accesa (Magny et al., 2007). (e) Phases of cooler/wetter climatic conditions reconstructed in southern and central Italy (Giraudi et al., 2011; Zanchetta et al., 2012); LIA = Little Ice Age; red arrow corresponds to the onset of the Neoglacial period. (f) Glacial ad-vances in the Gran Sasso Massif, central Italy (Giraudi 2005a, b); GA = glacier advance. (g) Frequency of subfossil woods and peat discs in proglacial fluvial sediments in the Swiss Alps (Joerin et al., 2006). (h) South Adriatic Sea surface temperature (this study). (i) South Adriatic δ18Owrecord (this study). (j) Pollen-inferred
quan-titative estimates of annual precipitation at Pergusa, central Sicily (Magny et al., 2012a). S1a and S1b refer to the two-step sapropel S1 units in the SAS. The yellow lines indicate low δ18Ow/salinity
values in core MD90-917.
2006), (2) cooling events identified from various proxies in the Swiss Plateau and Alps (Haas et al., 1998), and (3) glacier variations reconstructed in the Swiss Alps from radiocarbon-dated subfossil woods and peat discs washed out by glacier streams (Joerin et al., 2006).
At a pluri-millennial scale, the general trends shown by the sea surface salinity record from core MD90-917 appear to be in general agreement with the PANN record of Pergusa (Fig. 6j; Magny et al., 2012a). The maximum of precipita-tion observed in central Sicily around 9.5 to 7 ka is consistent with lower salinity values in the SAS during the early to mid-Holocene. In contrast, the aridification trend suggested by higher salinity values during the second half of the Holocene corresponds to a general decrease in PANN at Pergusa after 7 to 6.5 ka. Considered as a whole, the mid-Holocene phase of salinity minimum in the SAS appears to be also consis-tent with a maximum of humidity in the winter season in the north-central Mediterranean suggested by minimum values in the oxygen isotope record from Corchia cave (Zanchetta et al., 2007) and pollen-inferred maximum of winter precip-itation at Lake Accesa (Peyron et al., 2011; Magny et al., 2012a).
At a centennial scale, during the second half of the Holocene, Fig. 6 shows possible synchronicities (within the radiocarbon-dating uncertainty) between phases of lower salinity in the SAS and periods of wetter climatic conditions around the north-central Adriatic Sea, marked by glacial ad-vances in the Gran Sasso Massif and lake-level changes at Lakes Accesa. However, the SAS salinity record does not display any strong signature in correspondence with the ini-tiation of the Neoglacial period dated to ca. 4.5–4 ka in the north-central Mediterranean (Zanchetta et al., 2012) and well marked by an abrupt rise in lake level at lakes Accesa (Fig. 6d) and Ledro (Magny et al., 2007, 2012b). At more southern latitudes in the central Mediterranean, the strong temperature decreases in the MD90-917 SST record around 8.2 and 7.3 to 6.3 ka coincided with drier climatic conditions around 8.4 to 8.2 and 7.4 ka at Lake Preola in Sicily, with a maximal lowering around 7.3 ka and resuming eolian deposi-tion (Magny et al., 2011b). Stable isotope data from a cave in northern Sicily indicate two successive cold and dry events that interrupted the wet mid-Holocene at ca. 8.2 and 7.5 ka (Frisia et al., 2006). Stable-isotope and pollen records from the northern Aegean Sea have also given evidence of cold and dry intervals marked by drops of deciduous tree pollen at around 8.3–8, 7.5–6.3 and 4.4–4 ka (Kotthoff et al., 2008a, b; Schmiedl et al., 2010). A similar decrease in arboreal vege-tation has been observed during the period immediately after the sapropel 1 deposition in core MD90-917 (Combourieu-Nebout et al., 1998).
Figure 6 gives evidence of other possible correlations be-tween short-lived phases of cooler/wetter climatic conditions north of the Alps and centennial-scale phases of lower salin-ity in the SAS. Regarding the region north of the Alps, Fig. 6 also presents striking similarities at a centennial scale be-tween phases of lower salinity in the SAS and those of higher frequency of subfossil woods recognized in proglacial fluvial sediments in the Swiss Alps (Joerin et al., 2006). According to these authors, the peaking frequency of subfossil remains of wood and peat discs dated to the mid-Holocene reflects an
G. Siani et al.: Paleohydrology reconstruction and Holocene climate variability 509
elevation maximum of the Alpine timberline favored by the Holocene Thermal Maximum. At a centennial scale, these authors also interpret the successive peaks of subfossil woods as glacier recessions favoring forest expansions. However, the significance of peaks of subfossil woods and peat discs reconstructed by Joerin et al. (2006) may be not straightfor-ward. Considering their timing, they also could correspond, at least partly, to phases of glacier advances and increasing runoff responsible for forest destruction in high-elevated ar-eas and for accumulation of remains of woods and peat in proglacial fluvial sediments downstream of glacier tongues, as suggested for instance by a peak of subfossil woods con-temporaneous with an advance of the Aletsch Glacier around 1.3 ka (Joerin et al., 2006; Holzhauser et al., 2005). Such an alternative interpretation is also supported by apparent syn-chronicities between peaks of subfossil woods in the Swiss Alps and cooler/wetter phases marked north of the Alps by higher lake levels (Magny, 2006) as well as in Alpine and central European paleoclimatic series, e.g. glaciers, treelines, and chironomids (Haas et al., 1998; Heiri et al., 2004). Thus, the period around the 8.2 ka event corresponds to an inter-ruption of S1 deposition, higher lake levels in central and northern Italy, a cooling event (Haas et al., 1998) and a peak of subfossil woods (Joerin et al., 2006) in the Swiss Alps. A similar observation may be developed for the cool-ing period between 7.3 and 6.3 ka marked by a minimum in salinity and SST in the SAS. The Holocene glacier his-tory reconstructed by Luetscher et al. (2011) from Alpine speleothems in Switzerland shows that the Upper Grindel-wald Glacier readvanced from ca. 7.2 to 6.8 ka. As discussed by Magny et al. (2011a, 2012b), imprints of a climatic re-versal at ca. 7.5 to 7 ka may be found also in Mediterranean paleoclimatic records from lakes Medina in southern Spain (Reed et al., 2001), Xinias in Greece (Digerfeldt et al., 2007), and G¨olhisar in southwestern Turkey (Eastwood et al., 2007). Moreover, its range may have exceeded the European conti-nent as suggested by a near cessation of the early to mid-Holocene sea level rise (Bird et al., 2010), as well as by a major IRD peak in the North Atlantic (Bond et al., 2001) and an expansion of polar water in the Nordic seas (Rasmussen and Thomsen, 2010). The interval at 8 to 7 ka also appears to be synchronous with the highest rate of change in annual insolation for the Holocene (Zhao et al., 2010).
6.3 Frequency of the Holocene climatic variability in the SAS
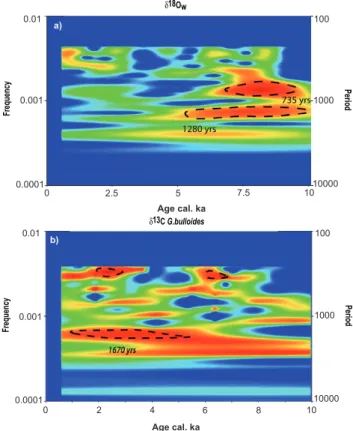
In order to shed light on the origin of the Holocene climate variability in the central Mediterranean area, we have used wavelet analysis of the SAS hydrological record. During the early to mid-Holocene between ca. 10 and 6 ka, wavelet anal-ysis on the δ18Owrecord show two main frequency patterns:
one at ∼ 1280 and one at 735 yr (Fig. 7). After 6 ka only the wavelet analysis on the G. bulloides δ13C record defines a frequency at ∼ 1670 yr. These results clearly show that both
D18Ow Period Frequency 0.01 0.001 0.0001 100 1000 10000 Age ka 0 2.5 5 7.5 10 a) Frequency 0.01 0.001 0.0001 Period 100 1000 10000 0 2 4 6 8 10 Age ka D13C G.bulloides b) FIGURE 7 Age cal. ka Age cal. ka Period Frequency 0.001 0.0001 1000 10000 Age ka 0 2.5 5 7.5 10 a) Frequency 0.01 0.001 0.0001 Period 100 1000 10000 0 2 4 6 8 10 Age ka D13C G.bulloides b) FIGURE 7 Age cal. ka Age cal. ka
Fig. 7. Wavelet spectrum of the MD90-917 marine hydrological
record for (a) δ18Ow/salinity and (b) δ13C Globigerina bulloides.
The 95 % confidence level is indicated by a dashed line.
δ18Ow and δ13C signals are structured by different
millen-nial frequency patterns. The δ18Owrecord displays
frequen-cies present exclusively during the early to mid-Holocene, whereas the δ13C record suggests an inverse pattern with a significant millennial-scale frequency between 6 and 0.6 ka. Consequently, these two signals are not related to the same forcing in terms of millennial-scale climate changes.
The early to mid-Holocene δ18Owfrequencies are not
typ-ical of a well-known spectral imprint (Debret et al., 2009). However, these frequencies indicate that the signal is struc-tured, suggesting that δ18Ow records significant variations
related to climate or environmental changes. Conversely, the
δ18Owwavelet analysis does not allow identification of a
pe-riodic behavior of the climate at centennial and millennial scales after 6 ka. It is likely that during the Holocene the
δ18Ow signal was disturbed by local precipitation, runoff,
melt water flux and evaporation changes produced in the semi-enclosed South Adriatic Basin that could have hidden the most meaningful frequencies.
Regarding the δ13C signal, it shows a frequency after 6 ka with a period at ∼ 1670 yr. A comparable frequency can be reported for an internal forcing probably attributed to ocean– atmosphere coupling (Debret et al, 2007, 2009; Hoogakker et al., 2011). A similar spectral signal was also identified in the oxygen isotopic record from a speleothem in southwestern
Age cal. ka Ic e la n d S to rm s δ 1 3 C G .b u llo id e s Figure 8
Fig. 8. Comparison of millennial-scale evolution of the 1670-yr
cy-cles between storm episodes in Iceland (blue line; Jackson et al., 2005) and the G. bulloides δ13C record in the South Adriatic Sea, showing the raw data (black line) and low-frequency band pass (red line).
Ireland (McDermott et al., 2001; Debret et al., 2007), sug-gesting a strong link between North Atlantic climate and ice core temperature. Interestingly, by comparing the SAS
δ13C frequency with that obtained from an Icelandic loes-sic sequence representative of stormy episodes in North At-lantic we find an imprint similar and coeval to that identi-fied by Jackson et al. (2005; Fig. 8). This implies that the identification of this frequency in the δ13C signal may in-dicate a common link between the central Mediterranean and North Atlantic area during the mid- to upper Holocene and consequently strengthens the relationship between δ13C and freshwater coming from the Po River. Today, the Po River runoff is closely linked to the negative North Atlantic oscillation (NAO) index exercising a strong influence on the winter precipitation pattern over Europe on an interan-nual to decadal timescale (Zanchettin et al., 2008). In addi-tion, both Adriatic and north Atlantic records present a co-eval mid-Holocene transition corresponding to a Holocene worldwide pattern (Debret et al., 2009), in agreement with the initiation of the Neoglacial period in the north-central Mediterranean (Zanchetta et al., 2012). This major outcome assesses the origin of the forcing factors leading to these short-term climatic changes during the Holocene in the SAS, even though the mechanisms responsible for millennial-scale climate variability still remain not completely understood.
7 Conclusions
The multi-proxy hydrological record from the SAS has pro-vided new clues on the Holocene climate changes produced in the central Mediterranean area. These reconstructions have revealed two major hydrological trends confirming the pres-ence of a strong climatic mid-Holocene transition in the South Adriatic Sea:
1. an early to mid-Holocene pattern between 11.5 ka and 6.3 ka marked by sea surface salinity lowering and reduced deep-sea convection mainly centered during
the sapropel S1 phase (9.3 to 7.4 ka) followed by a shift toward
2. more saline waters and arid conditions during the mid-to upper Holocene, attesting mid-to the resumption of the Adriatic deep water formation since about 6.3 ka. However, beyond the two main paleohydrological transi-tions, short-term centennial-scale hydrological changes have distinguished the entire Holocene. During the sapropel S1, despite the surface salinity lowering, short-term SST cool-ing spells are responsible for the resumption of deep-water formation and re-oxygenation phases in the South Adri-atic Basin during the S1 interruption. During the mid-Holocene, a significant SST cooling together with a promi-nent δ18Ow/salinity lowering (1 ‰) were recorded at the end
of the sapropel S1b between 7.3 and 6.8 ka separated by an abrupt short-term δ18Owincrease at 7.1 ka.
Conversely, since about 6 ka, SST reconstructions have in-dicated rather weak variability, whereas δ18Ow and G.
bul-loides δ13C values show short-term oscillations, suggesting a disconnection from temperature influence. Such centennial-scale changes, mainly centered between 3 and 0.6 ka, have been attributed to a major influence of freshwater from the Po River even though a possible influence of coastal Italian, Apennine and Albanian rivers cannot be discarded. These short-term hydrological changes, even of lesser amplitude compared to the early to mid-Holocene period, could have affected the sea surface hydrology and consequently reduced the formation of deep bottom waters in the SAS affecting the thermohaline circulation in the Mediterranean Sea.
The high time resolution SAS Holocene hydrological record has also enabled the carrying out of comparisons with previous paleohydrological records from the central Mediter-ranean area and north of the Alps in west-central Europe. Taken as a whole and beyond the uncertainties due to the age models of the different archives, these climatic oscillations revealed a possible link between phases of lower salinity in the SAS and periods of wetter climatic conditions around the north and south-central Mediterranean area.
Finally, the mid- to upper Holocene episodes marked by lower δ13C values and salinities and attributed to an increased supply of freshwater from the Po River have dis-played a periodicity of ∼ 1670 yr, reflecting the appearance after 6 ka of a millennial oscillation driven by an ocean– atmosphere forcing mainly centered in the North Atlantic region. These findings suggest significant coupling between high-latitude North Atlantic climate and the South Adriatic hydrologic cycle.
Acknowledgements. This study was supported by the French ANR
(project LAMA, M. Magny and N. Combourieu Nebout). Fabien Dewilde (LSCE) is gratefully acknowledged for the preparation of samples and assistance during isotope analyses. We also thank Nejib Kallel and Elisabeth Michel for useful discussions and two anonymous reviewers for their constructive suggestions.
Edited by: N. Combourieu Nebout
The publication of this article is financed by CNRS-INSU.
References
Abu-Zied, R., Rohling, E. J., Jorissen, F. J., Fontanier, C., Casford, J. S. L., and Cooke, S.: Benthic foraminiferal response to changes in bottom-water oxygenation and organic carbon flux in the east-ern Mediterranean during LGM to Recent times, Mar. Micropal., 67, 46–68, 2008.
Amorosi, A., Dinelli, E., Rossi, V., Vaiani, S. C., and Sacchetto, M.: Late Quaternary palaeoenvironmental evolution of the Adri-atic coastal plain and the onset of Po River Delta, Palaeogeogr. Palaeocl., 268, 80–90, 2008.
Artegiani, A., Azzolini, R., and Salusti, E.: On the dense water in the Adriatic Sea, Ocean. Acta, 12, 151–160, 1989.
Artegiani, A., Bregant, D., Paschini, E., Pinardi, N., Raicich, F., and Russo, A.: The Adriatic Sea general circulation: Part I. Air – sea interaction and water mass structure, Part II. Baroclinic circula-tion structure, J. Phys. Ocean., 27, 1492–1532, 1997.
Asioli, A., Trincardi, F., Lowe, J. J., Ariztegui, D., Langone, L., and Oldfield, F.: Sub-millennial scale climatic oscillations in the central Adriatic during the Lateglacial: palaeoceanographic im-plications, Quaternary Sci. Rev., 20, 1201–1221, 2001.
Bar-Matthews, M., Ayalon, A., and Kaufman, A.: Timing and hy-drological conditions of Sapropel events in the Eastern Mediter-ranean, as evident from speleothems, Soreq cave, Israel, Chem. Geol., 169, 145–156, 2000.
Bird, M., Austin, W. E. N., Wurster, C. M., Fifield, L. K., Mojtahid, M., and Sargeant, C.: Punctuated eustatic sea-level rise in the eraly mid-Holocene, Geology, 38, 803–806, 2010.
Blanc, P. L. and Duplessy, J. C.: The deep-water circulation during the Neogene and the impact of the Messinian salinity crisis, Deep Sea Res. Part A. Ocean. Res. Papers, 29, 1391–1414, 1982. Bond, G., Kromer, B., Beer, J., Muscheler, R., Evans, M. N.,
Show-ers, W., Hoffmann, S., Lotti-Bond, R., Hajdas, I., and Bonani, G.: Persistent solar influence on North Atlantic climate during the Holocene, Science, 294, 2130–2136, 2001.
Bottema, S. and Van Straaten, L. M. J. U.: Malacology and paly-nology of two cores from the Adriatic Sea floor, Mar. Geol., 4, 553–564, 1966.
Charbit, S., Rabouille, C., and Siani, G.: Effects of benthic transport processes on abrupt climatic changes recorded in deep-sea
sed-iments: A time-dependent modeling approach, J. Geophys. Re., 107, 3149, doi:10.1029/2000JC000575, 2002.
Chedaddi, R. and Rossignol Strick, M.: Eastern Mediterranean Qua-ternary paleoclimates from pollen and isotope records of ma-rine cores in the Nile cone area, Paleoceanography, 10, 291–300, 1995.
Cheddadi, R., Yu, G., Guiot, J., Harrison, S. P., and Colin Prentice, I.: The climate of Europe 6000 years ago, Clim. Dynam., 13, 1–9, 1997.
Chen, L., Zonneveld, K. A. F., and Versteegh, G. J. M.: Short term climate variability during “Roman Classical Period” in the east-ern Mediterranean, Quateast-ernary Sci. Rev., 30, 3880–3891, 2011. Combourieu-Nebout, N., Paterne, M., Turon, J. L., and Siani, G.:
A high resolution record of the last deglaciation in the Central Mediterranean Sea: Paleovegetation and Paleohydrological evo-lution, Quaternary Sci. Rev., 17, 303–317, 1998.
Correggiari, A., Cattaneo, A., and Trincardi, F.: Depositional pat-terns in the Holocene Po Delta system, in: River Deltas: Con-cepts, Models and Examples, edited by: Bhattacharya, J. P. and Giosan, L., Society of Economic Paleontologists and Mineralo-gists Special Publication, 83, 365–392. 2005.
Curry, W. B. and Oppo, D. W.: Glacial water mass geometry and the distribution of δ13C of 6CO2in the western Atlantic Ocean,
Pa-leoceanography, 20, PA1017, doi:10.1029/2004PA001021, 2005. Debret, M., Bout-Roumazeilles, V., Grousset, F., Desmet, M., Mc-Manus, J. F., Massei, N., Sebag, D., Petit, J.-R., Copard, Y., and Trentesaux, A.: The origin of the 1500-year climate cy-cles in Holocene North-Atlantic records, Clim. Past, 3, 569–575, doi:10.5194/cp-3-569-2007, 2007.
Debret, M., Sebag, D., Crosta, X., Massei, N., Petit, J.-R., Chapron, E., and Bout-Roumazeilles, V.: Evidence from wavelet analysis for a mid-Holocene transition in global climate forcing, Quater-nary Sci. Rev., 28, 2675–2688, 2009.
De Lange, G. J., Thomson, J., Reitz, A., Slomp, C. P., Principato, M. S., Erba, E., and Corselli, C.: Synchronous basin-wide forma-tion and redox-controlled preservaforma-tion of a Mediterranean sapro-pel, Nat. Geosci., 1, 606–610, 2008.
Dermody, B. J., de Boer, H. J., Bierkens, M. F. P., Weber, S. L., Wassen, M. J., and Dekker, S. C.: A seesaw in Mediterranean precipitation during the Roman Period linked to millennial-scale changes in the North Atlantic, Clim. Past, 8, 637–651, doi:10.5194/cp-8-637-2012, 2012.
Digerfeldt, G., Sandgren, P., and Olsson, S.: Reconstruction of Holocene lake-level changes at Lake Xinias, central Greece, The Holocene, 17, 361–367, 2007.
Duplessy, J. C.: Isotope studies, in: Climatic change, edited by: Gribins, J., Cambridge Univ. Press, London, 46–67, 1978. Duplessy, J. C., Shackleton, N. J., Fairbanks, R. G., Labeyrie, L.,
Oppo, D., and Kallel, N.: Deep water source variations during the last climatic cycle and their impact on the global deep water circulation, Paleoceanography, 3, 343–360, 1988.
Duplessy, J. C., Bard, E., Arnold, M., Shackleton, N. J., Duprat, J., and Labeyrie, L. D.: How fast did the ocean-atmosphere system run during the last deglaciation?, Earth Planet. Sci. Lett., 103, 41–54, 1991.
Eastwood, W. J., Leng, M. J., Roberts, N., and Davis, B.: Holocene climate change in the eastern Mediterranean region: a compari-son of stable isotope and pollen data from Lake G¨olhisar, south-west Turkey, J. Quaternary Sci., 22, 327–341, 2007.