DOI: 10.1007/s00340-006-2361-4 Lasers and Optics j.-p. besson1,u s. schilt1 f. sauser2 e. rochat2 p. hamel3 f. sandoz3 m. nikl`es2 l. th´evenaz1
Multi-hydrogenated compounds monitoring
in optical fibre manufacturing process
by photoacoustic spectroscopy
1Ecole Polytechnique F´ed´erale de Lausanne (EPFL), Nanophotonics and Metrology Laboratory,
1015 Lausanne, Switzerland
2Omnisens SA, Riond-Bosson 3, 1110 Morges, Switzerland
3Daetwyler Fiber Optics SA, Route de la Gare 70, 2017 Boudry, Switzerland
Received: 31 March 2006/Revised version: 26 May 2006 Published online: 14 July 2006 • © Springer-Verlag 2006
ABSTRACTSub-ppm hydrogen chloride (HCl) and water va-pour (H2O) monitoring using photoacoustic spectroscopy in optical fibre manufacturing is reported. The development and performance of a sensor based on an acoustic resonant config-uration is described, and on-site measurements are presented. Two DFB lasers emitting in the 1370 nm and 1740 nm range were used for the detection of H2O and HCl, respectively. A de-tection limit (defined for a SNR= 3) of 60 ppb for HCl and 40 ppb for H2O was achieved. Contamination sources of the car-rier gas used for the fibre preform manufacturing are identified and discussed.
PACS42.62.Fi; 43.35.Ud
1 Introduction
Trace gas analysis using laser diode photoacous-tic spectroscopy (PAS) is a well established technique suit-able for many applications such as environmental monitor-ing [1] or industrial process control [2, 3]. This method en-ables multi-components analysis, real-time and continuous measurement and provides an excellent linearity over several orders of magnitude and a great selectivity by using single-mode light-emitting sources. In addition, the use of standard semiconductor telecommunication laser diodes in combina-tion with a properly designed photoacoustic (PA) cell enables reaching of a sub-ppm detection limit for many species.
In this paper, we report a PA sensor developed to moni-tor hydrogen chloride (HCl) and water vapour (H2O) at the sub-ppm level for process control in the manufacturing of the novel low-water-peak fibres used in optical telecommunica-tions. These new type of fibres, also called metro fibres or zero-water-peak fibres (ZWPFs), are designed to enable opti-cal transmission in the E-band (1360–1460 nm), so that this window can be opened for implementing cost-effective coarse wavelength division multiplexing (CWDM) technology for current or future network applications [4]. In addition, a lower attenuation in the S-band (1460–1530 nm) makes optical am-plification by Raman effect possible instead of the classical
u Fax: +41-21-693 2614, E-mail: jean-philippe.besson@epfl.ch
use of fibre lasers, the pump being spectrally positioned in the E-band. The presence of a strong OH−absorption peak cen-tered at 1390 nm in standard silica optical fibres is mainly due to moisture contamination that occurs during the manufactur-ing process of the fibre preform, usually realised by modified chemical vapour deposition (MCVD). In this process, various gaseous chlorides (SiCl4, GeCl4, POCl3) are diluted in a car-rier gas that flows through a rotating fused silica tube. The carrier gas mainly contains oxygen (O2), together with helium (He) at a concentration of a few tens of percent in order to homogenise the gas temperature and therefore to increase the rate deposition of GeO2and SiO2on the inner wall of the silica tube. Silicon tetrachloride (SiCl4) and germanium tetrachlo-ride (GeCl4) are used to create the step index between the core and the cladding of the fibre. Phosphoric chloride (POCl3) is used in the cladding in order to lower the vitrification tem-perature to avoid mechanical deformation of the tube. Typical gaseous chemical reactions occurring between the chlorides and oxygen during the manufacturing of the preform are the following [5]:
SiCl4+ O2→ SiO2↓ +2Cl2 (1)
GeCl4+ O2→ GeO2↓ +2Cl2 (2)
4POCl3+ O2→ 2P2O5↓ +6Cl2 (3)
When water contamination diffuses in the gas mixture, HCl is produced as a result of the strong reactivity between water and chloride compounds:
SiCl4+ 2H2O→ SiO2↓ +4HCl (4)
GeCl4+ 2H2O→ GeO2↓ +4HCl (5)
POCl3+ 3H2O→ H3PO4↓ +3HCl (6)
The measurement of the HCl concentration in the process gas is therefore an excellent indicator of the quantity of water con-tamination present in the gas mixture.
The main source of contamination generally occurs during the replacement of an empty bubbler containing the chlorides. Unfortunately, this change has to be made manually for the POCl3container and requires opening of the gas line, result-ing in water result-ingress into the line. The purge time after the container’s exchange is a critical parameter, since it directly influences the production of new preforms. The developed PA
FIGURE 1 Schematic view of the PA cell consisting of three longitudinal modes operating in their first longitudinal mode. A piezo transducer is used for resonance frequency tracking
sensor is therefore used as a diagnostic instrument to monitor the quality of the carrier gas after the replacement of a bubbler. 2 Experimental details and calibration
2.1 Set-up
The PA sensor is based on resonant PAS in combi-nation with semiconductor laser diodes emitting in the near-infrared region. The resonant PA cell consists of three paral-lel tubes, each operating as an acoustic resonator, terminated by two larger buffer volumes (see Fig. 1). This configuration offers the possibility of measuring up to three gases sim-ultaneously using three different lasers (one laser beam per tube). For example, the sensor has been designed to monitor CH4, H2Oand HCl using three DFB lasers emitting
respec-tively in the 1650 nm, 1370 nm and 1740 nm range. For the on-site measurements reported here, methane has not been considered yet and the corresponding laser was simply not connected. The resonators oscillate in their first longitudinal mode at a frequency around 1 kHz in air. A gold coating was deposited on the inner surface of the cell to reduce adsorption– desorption processes. This is an important aspect to achieve accurate measurements of gas traces with a reasonable re-sponse time in the case of polar molecules such as HCl and H2O, which tend to stick to the walls of the cell. Heating
of the cell is an alternative technique to reduce these kind of processes [6], which is however difficult to implement in an industrial environment. Further developments of the sen-sor will include the possibility of heating the cell. Sensitive electret microphones, placed in the centre of each resonator, are used to detect the acoustic signals. The PA signal is am-plified and measured using a lock-in amplifier with a time constant usually set to 10 s. The pigtailed DFB lasers con-nected to fibered collimators are directly mounted on the outer flange of the cell and each of them was aligned along the axis of one resonator. An active tracking of the acoustic reson-ance frequency has been implemented with a piezo-electric transducer used as a speaker to secure long-term unattended operation of the instrument. Additional details on the sensor can be found in [7, 8].
In order to monitor HCl and H2Oconcentrations in the
manufacturing process of the ZWPF, the PA sensor has been inserted in a line parallel to the process line (Fig. 2). The
carrier gas was made of He, O2 and an additional O2 flow
saturated with either SiCl4, GeCl4 or POCl3. The
chloride-saturated gas was generated by bubbling pure O2 in a
con-tainer filled with SiCl4, GeCl4or POCl3at fixed temperatures
of respectively 39◦C, 39◦Cand 32◦C. Measurements were performed in a gas mixture which slightly differed from the carrier gas used in the process (see Tables 1 and 2). The prin-cipal reason is that we aimed at quantifying the contribution of each of the chlorides separately, whereas SiCl4, GeCl4and
POCl3are mixed together in the process gas. A total flow rate
of 1000 sccm (standard cubic centimeter per minute) has been used in order to grant a fast response time without adding any extra acoustic noise. Electro-valves were used to commute from the preform line to the measurement line, making trace gas monitoring without preform processing possible. The pre-cise gas mixture compositions were chosen in order to have a similar resonance frequency as used in the calibration phase (see Sect. 2.2). The final concentrations and gas mixtures used for HCl and H2Omeasurements are summarised in Table 1.
Before starting trace gas measurements, the PA cell was continuously purged with nitrogen (N2) over three days to
as-sure that no impurities were introduced by the sensor. This is particularly important for H2Odue to the sticky nature of
FIGURE 2 Gas distribution system for the preform manufacturing. The PA sensor is inserted in a line parallel to the process line. Mass-flow controllers (MFC) and electro-valves enable dilutions of different gas mixtures
Chloride T (◦C) Saturated vapour He (sccm) O2(sccm) O2+ chloride Chloride
pressure (mb) [13] (sccm) concentration (%)
POCl3 32 66.5 450 150 400+ 29 2.79
SiCl4 39 534.6 700 200 100+ 115 10.31
GeCl4 39 215.9 500 400 100+ 28 2.68
TABLE 1 Gas mixtures and chloride concentrations used for HCl and H2O monitoring
Chloride concentration (%) H2O concentration (ppm) HCl concentration (ppm)
Chloride Meas. gas Process gas Meas. gas Process gas Meas. gas Process gas
POCl3 2.79 0.088 0.92 0.03 15 0.47
SiCl4 10.31 7.85 – – 2.6 2
GeCl4 2.68 2.81 0.095 0.1 0.76 0.8
TABLE 2 Comparison of chlorides, H2O and HCl concentrations between the buffer gas used for PAS measurements and the
process gas used in optical fibre manufacturing
this polar molecule [9] and its high natural abundance, since the PA cell has been subject to a H2Oconcentrations as high
as 1%, corresponding to typical humidity content of air. Dur-ing the campaign, a continuous N2 flow of about 1000 sccm
passed through the cell when no chloride was flowing through the sensor in order to maintain a clean environment. HCl and H2Owere measured during an 11 day period after the
inser-tion of a new POCl3bubbler in order to evaluate the required
purge time of the installation. After this time a preform can be manufactured to fulfill the requirements for a low-water-peak fibre. At the end of the campaign, additional measurements were carried out with SiCl4and GeCl4.
2.2 Calibration of the PA sensor
Calibration of the PA sensor was performed in the laboratory under similar conditions to those experienced on-site. Different gas mixtures and various concentrations of hydrogenated compounds were obtained from certified cylin-ders of HCl, H2O, He and O2using mass-flow controllers. The
total gas flow was maintained at 1000 sccm at atmospheric pressure. The influence of the chloride compounds was not considered in the calibration phase, as these chemical prod-ucts are very corrosive, difficult to handle and need neutrali-sation processing before being rejected into the air. However, since the concentration of POCl3and GeCl4did not exceed
3%and SiCl410.5% in the measured carrier gas (see Table 1),
their influence on the spectroscopic parameters (foreign-gas broadening coefficient of the considered absorption line) is expected to be minor. The effect of the chlorides on the reson-ance frequency was taken into account, since the gas mixture in the manufacturing was adapted to obtain the same reson-ance frequency as used for the calibration.
A typical calibration curve for HCl was obtained by di-luting a certified mixture of 50 ppm HCl buffered in He, with pure O2and He (60% O2and 40% He) (Fig. 3a). The
reson-ance frequency and the quality factor obtained in these condi-tions were respectively 1137 Hz and 20. Calibration for water vapour at a low mixing ratio is delicate owing to the polarity of the molecule and its resulting adsorption–desorption pro-cesses problems [6]. Therefore, higher H2Oconcentrations
(up to a few ppm) in combination with a flow of 1000 sccm have been used to determine the calibration slope and to
ex-trapolate the detection limit (Fig. 3b). The range of H2O
con-centrations considered in the calibration (5–10 ppm) is of the same order of magnitude as that encountered on-site after the change of the POCl3 bubbler (0.4–1.8 ppm). Water vapour
FIGURE 3 Calibration curves for (a) HCl and (b) H2O in a 60% O2-40%
He mixture. Error bars shown on the plot correspond to the uncertainty on HCl and H2O concentrations generated with the MFCs (horizontal axis) and
to the standard deviation of the PA signal recorded in a 5-min period (verti-cal axis) The integration time was 1 s for HCl and 10 s for H2O. Dots are the
monitored in GeCl4 resulted in a lower level in the 100 ppb
range, but previous results obtained for methane monitor-ing usmonitor-ing the same set-up have shown an excellent linearity over several orders of magnitude (5000–0.5 ppm) and down to a value of a few detection limits [10]. H2Ocalibration was
per-formed by diluting a certified mixture of 50 ppm H2Obuffered
in nitrogen with O2and He, so that a residual of several
per-cent of N2was still present in the He-O2mixture. A detection
limit (defined for a signal-to-noise ratio SNR= 3 and with 10 sintegration time) of 60 ppb for HCl and 40 ppb for H2O
resulted from these calibration curves.
Finally, the modulation parameters of the lasers were opti-mised to maximize the PA signal [10] and were kept constant during the whole calibration procedure. The same parameters were then used for the on-site measurements.
3 Results and discussion
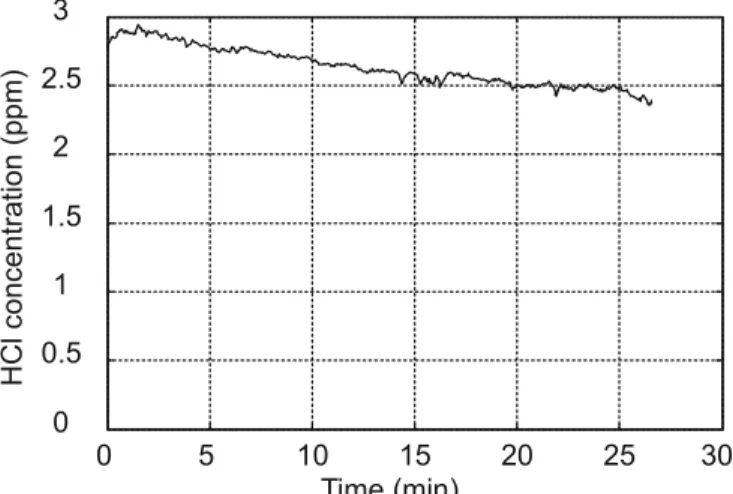
Figure 4 shows representative measurements of HCl and H2Operformed in the gas mixtures described in
Table 1 immediately after the change of the POCl3 bubbler
and one day after. A very high concentration of HCl (up to 0.3%) was present at the beginning, showing that the carrier gas was highly contaminated due to the change of the POCl3
container. In contrast, the water vapour level was in the ppm range due to the fact that most of the water content present in the gas was readily transformed into HCl (see chemical re-action (4)–(6)). As oxygen was flowing through the POCl3
bubbler, the HCl concentration decreased along with time due to the purge of the container. The evolution of HCl and H2O
concentrations over 11 days is presented in Figs. 5 and 6. The variation of the HCl concentration shows a regular decrease during the purge of the container: on day one, the bubbler was changed, producing a high degree of water contamina-tion transformed into HCl and after a continuous purge of the container with O2 over 49 h, the concentration decreased to
reach a level of 5 ppm. No purging and no measurements were performed the following day (day four) as a result of a ma-chine maintenance. Therefore, a higher HCl concentration of 40 ppmwas observed at the beginning of day five due to wa-ter desorption in the teflon head of the container when the O2
purge was interrupted. The concentration decreased down to 21 ppmafter 2 h of purging. After a new break of two days (week-end), the concentration increased again up to 77 ppm to reach a level of 15 ppm after 5 h of continuous flow of O2. The
evolution of the water vapour concentration over these days was quite different as the range of observed variations (from a maximum of 1.8 ppm to a minimum of 0.40 ppm) was much reduced compared to HCl, and the H2Oconcentration did not
change in a regular way. During the purge, the measured H2O
concentration decreased with time at high HCl levels (day 1 and the beginning of day 2), but tended to increase in an inter-mediate range of HCl concentration of 10–100 ppm (see day 2, 5 or 8). To explain this behaviour, we believe that the meas-ured H2Osignal originates from two different contributions.
The first one is due to the real water vapour content in the gas that results from residual water introduced in the line dur-ing the exchange of the POCl3bubbler and not transformed
into HCl. This contribution is expected to be dominant in the early phase of the purge and to decrease with the purge time
FIGURE 4 Typical concentration measurements over several minutes. (a) HCl and (b) H2O concentration on day one (black curve) and day two
(grey curve) after the POCl3bubbler exchange. The decrease of the
concen-tration of HCl is due to purging of the POCl3container by a continuous flow
of O2. H2O concentration variations originate from two contributions: real
water vapour content in the process gas and desorption effects (see text for details)
in a similar way as observed for the HCl concentration (see Fig. 4). A second contribution may result from a process of water desorption from the walls of the cell and possibly from the line. This contribution seems to be significant after a cer-tain purge duration, corresponding to an intermediate range of HCl concentrations of 10–100 ppm. This process is believed to be responsible for an increase of the observed H2O
concen-tration as illustrated in Fig. 4b.
It must be emphasized that the concentration of these con-taminants is much lower in the real carrier gas used in the preform manufacturing process, since the total carrier gas mixture is different. The POCl3 concentration in the process
is 0.088% (compared to 2.79% for the measurements) mean-ing that HCl and H2Oconcentrations are reduced accordingly
(see Table 2). However, the sensitivity of the sensor is suffi-cient to monitor HCl in the real process gas.
After these eight days of purging, a first preform was manufactured and a fibre was drawn in order to analyse its different parameters, in particular the spectral attenuation. To
FIGURE 5 HCl concentration level evolution over 11 days. The grouped circles represent several measurements performed on the same day during a time period varying from a few tens of minutes up to one hour. Each circle corresponds to one measurement point (integration time of 10 s) taken at the beginning or at the end of that period
FIGURE 6 H2O concentration level evolution over 11 days. The grouped
circles represent several measurements performed on the same day during a time period varying from a few tens of minutes up to one hour. Each circle corresponds to one measurement point (integration time of 10 s) taken at the beginning or at the end of that period
be compliant with ITU recommendation for a low-water-peak fibre [11], the attenuation measured at the maximum of the OH−peak at 1383 nm must be lower than the attenuation at 1310 nmafter hydrogen (H2) ageing [12]. Attenuation curves
of the fibre manufactured from the preform processed on day nine is presented in Fig. 7. A second fibre manufactured seven days later is shown in the same figure. These measurements were carried out after the drawing of the fibre, but without performing H2ageing. However, H2ageing is not
systemati-cally performed and a security margin of 0.02 dB/km is added to the attenuation coefficient to take this effect into account. A maximum of 0.34 dB/km at 1383 nm is acceptable for the fibre to be considered as a low-water-peak fibre. On Fig. 7, no significant attenuation improvement in the E-band and S-band region can be noticed between the two fibres. In addition, both fibres present an attenuation of 0.320 dB/km (fibre of day eight) and 0.318 dB/km (fibre of day 15) at 1383 nm, which satisfies the criteria defined above.
Finally, HCl and H2Owere monitored in gas mixtures
con-taining GeCl4and SiCl4to identify the contribution of these
FIGURE 7 Attenuation of the low-water-peak fibres manufactured 8 days (solid line) and 15 days (dashed line) after the replacement of the POCl3
container
FIGURE 8 HCl (a) and H2O (b) measurements in a gas mixture of
100 sccm O2saturated with GeCl4, 400 sccm O2and 500 sccm He
chloride compounds to the OH−peak. Figure 8 displays the measured concentrations in the case of GeCl4for the gas
mix-tures described in Table 1. The measured concentrations were below 1 ppm for HCl and around 0.1 ppm for H2O. The same
measurements using SiCl4 are presented in Fig. 9.
FIGURE 9 HCl measurements in a gas mixture of 100 sccm O2saturated
with SiCl4, 200 sccm O2and 700 sccm He
reasons. Here again, the gas mixtures used for the evaluation of H2Oand HCl contamination were different from the one
used in the process. The GeCl4and SiCl4concentrations used
in the process are 2.81% and 7.85% respectively compared to 2.68% and 10.31% in our measurements, meaning that the measured HCl and H2Oconcentrations were comparable to
the real process concentrations.
In order to compare the different contamination sources, typical chloride concentrations present in the process gas are used to extrapolate HCl and H2Oconcentrations from the
ob-tained measurements (see Table 2). The substitution of the POCl3bubbler results in an HCl concentration of 15 ppm and
a H2Oconcentration of 0.92 ppm (last measured points before
preform manufacturing after eight days of purging) corres-ponding to 0.47 ppm of HCl and 0.03 ppm of H2Oin the gas
mixture used in the process. HCl and H2Oconcentrations
re-sulting from the GeCl4 bubbler correspond to 0.76 ppm and
0.10 ppm in the process gas, respectively. Finally, HCl com-ing from the SiCl4 container results in a concentration of
2 ppm. This comparison shows that the principal contamina-tion source comes from the SiCl4container, considering that
the purge of the POCl3bubbler was done during a sufficient
period of time.
4 Conclusion
Laser diode photoacoustic spectroscopy has been demonstrated to be an efficient and reliable measure-ment technique for trace gas analysis in process gases, and is especially well adapted to on-line continuous detection and quantification of contamination down to a few tens of ppb. Sensitivity obtained using mW-power laser diodes is suf-ficient to detect hydrogenated contaminants to a level low enough to secure a ZWPF production. Further improvements of the system are under way, and are aiming at an enhanced signal-to-noise ratio performing at ppb level sensitivity which will still broaden the range of application of the measurement technique.
ACKNOWLEDGEMENTS The authors would like to acknowl-edge the Commission of Technology and Innovation (CTI) of the Swiss Government for the financial support. The authors are also grateful to NTT Electronics Corporation for providing DFB lasers.
REFERENCES
1 R.A. Rooth, A.J.L. Verhage, W. Wouters, Appl. Opt. 29, 3643 (1990) 2 M.W. Sigrist, Rev. Sci. Instrum. 74, 486 (2003)
3 S. Schilt, L. Th´evenaz, M. Niklès, L. Emmenegger, C. Hüglin, Spec-trochim. Acta A 60, 3259 (2004)
4 K. Kincade, Laser Focus World 39, 97 (2003)
5 J. Gowar, Optical Communication Systems, Prentice-Hall Int. Series in Optoelec. (London, 1984)
6 A. Schmohl, A. Miklos, P. Hess, Appl. Opt. 40, 2571 (2001)
7 J.-P. Besson, S. Schilt, L. Th´evenaz, Spectrochim. Acta A 60, 3449 (2004)
8 J.-P. Besson, S. Schilt, L. Th´evenaz, Spectrochim. Acta A 63, 899 (2006) 9 Z. Bozoki, M. Szakall, A. Mohacsi, G. Szabo, Z. Bor, Sens. Actuators B
91, 219 (2003)
10 S. Schilt, J.-P. Besson, L. Th´evenaz, In Second European Workshop on
Optical Fiber Sensors, Vol. 5502, ed. by J.M. L ´opez-Higuera, B.
Cul-shaw, SPIE, Bellingham, WA (2004), p. 317
11 International Telecommunication Union, ITU-T G652 (2003/03) 12 International Electrotechnical Commission (IEC), 60793-2-50
(2004-01)
13 Nat. Inst. of Standards and Technology, http://webbook.nist.gov/chemistry