Effects of age on the soccer-specific
cognitive-motor performance of elite young soccer
players: Comparison between objective
measurements and coaches’ evaluation
Halim Hicheur1*, Alan Chauvin2, Steve Chassot1, Xavier Chenevière1, Wolfgang Taube1 1 Sport and Movement Sciences, Dept of Medicine, University of Fribourg, Fribourg, Switzerland, 2 Laboratoire de Psychologie et NeuroCognition, CNRS–UMR 5105, Univ. Grenoble Alpes, Grenoble, France
Abstract
The cognitive-motor performance (CMP), defined here as the capacity to rapidly use sen-sory information and transfer it into efficient motor output, represents a major contributor to performance in almost all sports, including soccer. Here, we used a high-technology system (COGNIFOOT) which combines a visual environment simulator fully synchronized with a motion capture system. This system allowed us to measure objective real-time CMP param-eters (passing accuracy/speed and response times) in a large turf-artificial grass playfield. Forty-six (46) young elite soccer players (including 2 female players) aged between 11 and 16 years who belonged to the same youth soccer academy were tested. Each player had to pass the ball as fast and as accurately as possible towards visual targets projected onto a large screen located 5.32 meters in front of him (a short pass situation). We observed a lin-ear age-related increase in the CMP: the passing accuracy, speed and reactiveness of play-ers improved by 4 centimetplay-ers, 2.3 km/h and 30 milliseconds per year of age, respectively. These data were converted into 5 point-scales and compared to the judgement of expert coaches, who also used a 5 point-scale to evaluate the same CMP parameters but based on their experience with the players during games and training. The objectively-measured age-related CMP changes were also observed in expert coaches’ judgments although these were more variable across coaches and age categories. This demonstrates that high-tech-nology systems like COGNIFOOT can be used in complement to traditional approaches of talent identification and to objectively monitor the progress of soccer players throughout a cognitive-motor training cycle.
Introduction
Physical capacities represent an important component of performance in soccer. However, soccer is also a cognitive activity where players have to select appropriate solutions while facing multiple stimuli (e.g. the ball, moving teammates and opponents, see [1] for a review). The
a1111111111 a1111111111 a1111111111 a1111111111 a1111111111 OPEN ACCESS
Citation: Hicheur H, Chauvin A, Chassot S,
Chenevière X, Taube W (2017) Effects of age on the soccer-specific cognitive-motor performance of elite young soccer players: Comparison between objective measurements and coaches’ evaluation. PLoS ONE 12(9): e0185460.https://doi.org/ 10.1371/journal.pone.0185460
Editor: Riccardo Di Giminiani, University of
L’Aquila, ITALY
Received: April 20, 2017 Accepted: September 13, 2017 Published: September 27, 2017
Copyright:© 2017 Hicheur et al. This is an open access article distributed under the terms of the Creative Commons Attribution License, which permits unrestricted use, distribution, and reproduction in any medium, provided the original author and source are credited.
Data Availability Statement: All relevant data are
within the paper and its Supporting Information files.
Funding: The authors received no specific funding
for this work.
Competing interests: The authors have declared
cognitive-motor performance (CMP), defined here as the capacity to rapidly use sensory infor-mation and transfer it into efficient motor output, determines performance in almost all sports, including soccer. In fact, most of the game situations in soccer require interactions between the perceptual, memory, decisional and motor systems. These multiple and parallel processing stages begin with the transmission of information from sensory receptors (from visual, proprioceptive/tactile and vestibular sources) to primary sensory areas. The detection-to-perception stage is modulated by the influence of attention and memory on the processing of environmental features, which result inperceptual decisions (see [2] and [3] for reviews spe-cific to the visual and somatosensory systems). Perception is thus an active, high-order process where part of the actual sensory flow is compared to memorized ones, resulting in a particular interpretation of the actual situation. The output of this processing can consist in different actions like i) intercepting the ball ii) keeping the ball iii) passing the ball iv) dribbling or v) kicking the ball.
The CMP is often referred to as “perceptual-cognitive” expertise, performance or skill (for a documented review, see [1] and [4]). The integration and consideration of the motor compo-nent in CMP’s is motivated by several reasons. First, players with high perceptual skills (e.g. shortperceptual reaction times) can have poor motor skills: thus, CMP measurements should include both cognitive-motor (e.g. response times) and motor variables (e.g. passing accuracy) to evaluate soccer-specific CMP. This corresponds to the coaches’ emphasis on the need to ‘not only quickly pick up visual informationbut also to use this information to adequately exe-cute the task’. Second, testing situations where players know that they have to respond via a joystick/oral reports can substantially bias their attention towardsexternal sources, thereby reducing their personal investment in the task [5]. In contrast, one can reasonably assume that motor responses through real soccer gestures augment the personal investment (attention) of players in the task.
The non-motor component of the CMP was investigated in soccer players using specific and non-specific protocols [1,4].Specific and non-specific refer in these studies to the type of situations being tested. A standard psychological test like the Stroop test [6] is considered as non-specific while a task where participants would face a realistic soccer field projected on a screen is considered asspecific. Compared to age-matched control participants, superior antic-ipation, decision-making or higher-order cognitive skills were exhibited by soccer players in specific [7,8] and non-specific [8–11] tasks. These superior perceptual-cognitive abilities (e.g. greater response accuracies and/or shorter reaction times) were found to be associated with specific visual search strategies and verbal reports in expert players. This was observed in a series of tasks replicating realistic situations such as anticipating the future direction of a pen-alty kick or making the most appropriate choice in simulated defensive/offensive situations [7,
12–15].
Interestingly, these specific strategies implemented by soccer experts are associated with particular brain activity patterns. Indeed, activations of brain areas (known as the Action Observation Network) were found to be stronger in soccer experts compared to controls in a task where participants had to identify deceptive soccer moves [16,17]. A recent study [18] revealed that repetitive transcranial magnetic stimulation (rTMS) disrupted performance more strongly in soccer experts than novices in a task where participants had to predict the future direction of the ball after having viewed the initial phases of a penalty kick. This was especially evident when rTMS was applied in the dorsal premotor cortex, with a similar ten-dency observed only for goalkeepers when rTMS was applied over the Superior Temporal Sul-cus, a region known to be involved in biological motion perception [19]. This observation and others (e.g. [20]) indicate that perceptual-cognitive skills rely not only on sensory but also on motor cortical areas that are part of the mirror neuron system. How soccer experience
progressively generates such changes in the brain activity has not been investigated yet. How-ever, the average hours accumulated per year during childhood (and during adolescence to a lesser extent) in soccer-specific play activity were found to be the strongest predictor of supe-rior anticipation and decision making in soccer players [12].
The aim of this study was twofold. At the theoretical level, we wanted to investigate the respective effects of age and soccer practice experience on the CMP in young elite soccer play-ers in a passing situation, an issue which has received little attention so far. Following earlier reports [12], we assumed that the childhood-to-adolescence transition period represents a crit-ical phase in the development of perceptual-cognitive (and motor) abilities of young soccer players. In particular, we wanted to test the hypothesis that the reactiveness and the passing accuracy of young soccer players improve substantially during the critical pre-adolescence– mid-adolescence period. At the methodological level, we wanted to compare the objectively determined outcome measures of a new high-technology system (COGNIFOOT, patent pend-ing) when assessing the cognitive-motor performance of soccer players in a short pass situa-tion to the more subjective judgements of expert coaches.
Materials and methods
Participants
Players. Forty-six elite young soccer players, aged between 11 and 16 years, participated
in this study. They belonged to the same elite youth soccer academy, which meticulously selects their players. All the selected players trained at the academy during the week and competed (every week-end)–depending on their age–at the elite regional or national levels resulting in a total of 6 (U12 category) to 8.5 (U14 to U16 categories) hours of soccer specific practice per week. They belonged to different age categories: U12 (N = 14, age = 11.56± 0.31 years, whole soccer practice experience = 6.57± 0.85 years, including 1.21 ± 0.43 years at the elite level), U13 (N = 7, age = 12.59± 0.22 years, whole soccer practice experience = 6.71 ± 1.38 years, including 2.71± 0.49 years at the elite level), U14 (N = 10, age = 13.56 ± 0.79 years, whole soccer practice experience = 8.00± 1.05 years, including 3.50 ± 0.53 years at the elite level; one female player) and U15U16 (U15 category included two extra players from U16, N = 15, age = 14.71± 0.43 years, whole soccer practice experience = 9.30 ± 1.07 years, includ-ing 3.97± 0.61 years at the elite level; one female player). Each category of players was trained by two expert coaches. All participants (coaches, players and players’ parents) provided in-formed consent and the research procedures were approved by the local ethics committee at the University of Fribourg.
Coaches. Nine coaches (three head coaches of the academy, two coaches for each of the
U15U16 and U13 categories, and one coach for each of the U12 and U14 categories) partici-pated in the study by providing their judgements about the performance level of the young players under their responsibility (see Procedure section). The coaches were experienced (8.8± 6.9 years of coaching practice at the elite level) and certified trainers. They hold the UEFA-Pro (N = 4), UEFA-A (N = 1), UEFA-B (N = 3) or ASF-C (Swiss Federation of Soccer, N = 1, the C diploma corresponds to ground level before the UEFA-B level) licenses.
Cognifoot system
The COGNIFOOT system (patent pending at the Swiss Federal Institute of Intellectual Prop-erty under the referenceCH00215/16) is a real-time high-technology system combining a visual environment simulator synchronized with motion capture and ball-launching systems. In the present study, we used a first prototype of this system (COGNIFOOT v1—without
ball-launching robots) that we installed in a turf-artificial grass playfield on which players could execute real soccer skills while facing a large screen. The whole set-up is detailed below.
Playfield and support structures. The playfield size was equal to 8 x 5 x 5 (length x width
x height) meters. Artificial-grass floor texture (PurTurf 32, Realsport, Rossens, Switzerland) covered a surface of 8 x 4 meters (length x width). Metallic structures were located around the playfield in order to support motion capture cameras that were placed at a height of 5 meters.
Large screen and visual environment projection. A large screen (4 x 3 meters–width x
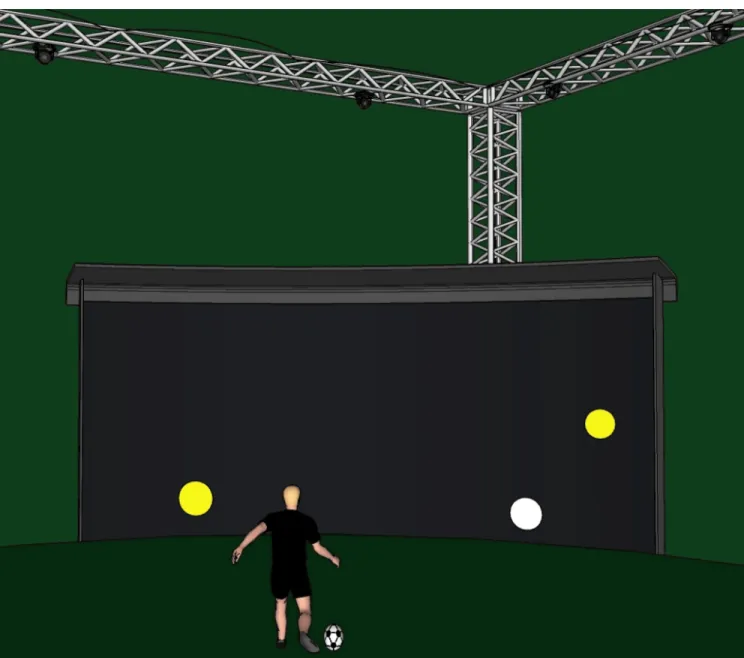
height) made of a shock absorbing tissue was located at a distance of 5.32 meters from the ball position (Fig 1). The visual environment was projected onto the screen using a beamer BenQ
Fig 1. Illustration of the experimental set-up. The player passed the ball towards the white target which could appear at one of 9 randomly-generated positions (here the right-intermediate height position). Visual distractors (yellow circles) could appear randomly on the screen together with the white target. The non-kicking foot had to remain within a black rectangle drawn on the artificial grass. Motion capture cameras were located above the player and tracked the ball movement in real-time. The videoprojector was placed behind the player at a height of 2.72 meters (not shown). Each player performed a total of 108 passes during a test session (see text for details).
MH740 (BenQ corporation Taipei, Taiwan, Full High Definition, luminosity: 4000 ANSI and 3D-compatible) located behind the player at a distance of 6.32 meters to the screen and at a height of 2.72 meters. The beamer was connected to a laptop (HP Elite Book, Hewlett-Packard, Palo Alto, CA, USA equipped with Intel i7 processor, DDR memory: 16 Go) via the HDMI port. The generated image size was equal to 3.80 x 2.01 meters (width x height). The default image background was black (same as the screen color) to ensure a constant contrast of the background between each trial.
Real-time ball motion tracking and screen calibration
The ball motion was tracked in real-time with 8 Optitrack Prime 17W cameras (NaturalPoint OR, USA). Small infra-red light reflective soft markers were fixed on the ball (standard ball size diameter equal to 22 cm) and after a calibration procedure, the 3D ball position (X, Y and Z spatial coordinates according to a reference frame centered on the initial ball position) was streamed in real-time at a frequency of 360 Hz to the laptop. Ball coordinates were then pro-cessed on-line using a self-written “main program” in Matlab (Mathworks Inc., Natick, MA, USA) to compute several parameters related to CMP (see next section). The calibration of the screen was performed using 4 markers located at the corners of the projected image. This allowed a conversion of the target position from pixels to (Y, Z) coordinates (same reference frame used for ball motion tracking). Post-calibration measurements were realized by fixing markers at different locations on the screen (e.g. screen corners and 5 random positions). The spatial coordinates of these markers were then converted into pixel coordinates. Targets of the same size as the one used in the tests were then projected back to the screen using these coordi-nates. During pilot testing, it was ensured that the distance between each marker and the cen-ter of the corresponded (projected) target was systematically below one centimecen-ter. This guaranteed the accuracy of the ball position measurement at impact (whether in pixels or in metric units).
Reliability of the response time measurements
The accuracy of the automatically computed response times has been verified using a video-based image-by-image control procedure. This has been done manually using video images recorded with a high-speed camera (CASIO EXILIM, Casio Tokyo, Japan—sampling rate: 600 frames per second). The films were taken from a point of view that allowed viewing simulta-neously the initial ball position and the screen while the player had to kick the ball towards the target. A fully-identifiable piece of tape was located on the floor at the ball level. The frame by frame scroll of image was performed for 9 consecutive passes. The frames at which the stimu-lus appeared on the screen and at which the ball went beyond the piece of tape were visually detected. The delay between these instants was converted from a number of frames into time units (ms). The correlation coefficient between these manually-computed response times and automatically-computed response times (COGNIFOOT v1 main program) was equal to 0.99, guaranteeing that our computation of response times was reliable.
Procedure
Visual stimulus. The properties of the visual environment (e.g. the number, location and
duration of the stimuli, inter-trial displays) were programmed using self-written Matlab rou-tines and the Psychophysics Toolbox extensions [21–23] in Matlab. A total of 108 stimuli (one stimulus per trial) were used during a single test. The player faced a large screen onto which a white circular target (diameter = 0.20 meter) appeared at one of 9 randomly-generated posi-tions: eccentricities (LEFT, CENTER, RIGHT) x vertical positions (FLOOR, INTERMEDIATE
and HIGH). The CENTER position of the target was located directly in front of the player/ini-tial ball position (distance of 5.32 m, 0 degree of visual angle along the eye-target longitudinal axis, perpendicular to the screen). The LEFT and RIGHT positions were located -1.30 and +1.30 meters away (-14.57 and 14.57 degrees of visual angle) from the player. The FLOOR, INTERMEDIATE and HIGH vertical positions were displayed at a height of 0.08, 0.38 and 0.68 meter with respect to the floor level, respectively.
The target appeared alone in one-third of the trials. Yellow circular distractor(s) (same size as the target) appeared together with the target in the rest of the trials. The number of distrac-tors could be equal to 1 or 2 and the distracdistrac-tors’ positions were randomly generated for each trial. The target plus the distractor(s) constituted one stimulus. The duration of appearance of this stimulus was randomly altered between trials to be 200, 300, 400 or 500 ms. Therefore, a total of 9 target positions x 3 distractors’ possibilities (0, 1 or 2) x 4 stimulus durations (200, 300, 400 or 500 ms) resulting in 108 different conditions were tested for each player/test.
Passing test
Players were required to pass the ball “as accurately and as quickly as possible” towards the tar-get. They were walking in place nearby the ball which was always placed at the same initial position (5.32 m). In order to maintain a good consistency when measuring the response times, players were not allowed to execute more than one step prior to foot-to-ball contact. This adjustment step usually corresponded to re-orienting the non-kicking foot which had to remain within a black rectangle drawn on the floor (Fig 1). Participants could not anticipate the location of the targets as they were displayed at random positions. A trial begun with a sound emitted by the main program and was followed one second later by the visual stimulus onset. The player then executed a pass towards the target. Once the ball had hit the screen, it was sent back to the player by two assistants (usually teammates) who were located at the edges of the screen (Fig 1). The player then placed the ball at the initial position and waited for the next sound. A period of 13 seconds separated the end of the stimulus appearance and the sound announcing the subsequent trial so that a single trial lasted at least 14.2 s. A rest period of 30 seconds was included every 18 trials. A total of 108 passes were performed: this number roughly corresponds to the maximal number of passes for the top 3 central midfielders ob-served in high-level competition matches [a mean number of passes of 70± 30 passes in the study of [24]]. The passing test lasted 30 to 35 minutes.
Pre-tests and experimental session recordings. Before performing the actual test, a
pre-test of 16 passes was performed by each player to become familiar with the task. The trials were similar to the ones used during the real test except that visuo-auditive feedback indicating pass success or failure was provided after each pass. Players were orally instructed to find the opti-mal trade-off between reactiveness and passing accuracy. Such feedbacks were not provided during the actual test. A typical experimental session (explanation of the task, pre-test and test) lasted 40 minutes per player. Players usually came by groups of three to serve as “passer” and “ball boys/girls”. The experiments took place in a covered hall within the Realsport Company in Rossens (Switzerland).
Ecological considerations. The ecological relevance of the tested task(s), the
“stimulus-response” compatibility, the accuracy of the measurements and the discriminative power of the tests and the type (stationary/movement) of response should be taken into account [4,14] when assessing the CMP in a soccer-specific environment. Another consideration that was directly addressed in the present study is the objectivity of the CMP measurement: passing or choice accuracy was often measured through human observation [4]. In the same vein, the reactiveness of players in a specific passing situation was not accurately measured in all of the
above-mentioned studies but one [25]. Here, we took into account each of these considerations although we had to find a trade-off between the practical relevance of the visual-motor condi-tions and the need to accurately monitor both the properties of the visual environment and the players’ responses. At the visual level, the choice of such simple objects (vs video-clips of real soccer situations used in some of the mentioned studies) was motivated by the observation that simple non-specific visual stimuli (comparable to the ones used here) are sufficient to discrimi-nate between experts and novices’ performances [8,10]. The choice of different randomly-gen-erated spatial positions of the target and the random appearance of visual distractors was motivated by the need to maintain a high level of attention of the player throughout the test.
At the motor execution level, the vertical positions were chosen to match different heights of passes. Relatively low heights were selected because higher positions would not have been realistic at this particular player-screen distance (5.32 meters). Besides, players often execute passes to teammates while being “pressed” by opponents who can be distinguished solely on the basis of the color of their uniforms: the different stimuli durations we tested and the pres-ence of distractors were dedicated to testing players in close-to-limit visual conditions compa-rable to the ones encountered in a real game. This experimental design generated different levels of spatial (presence of distractors) and temporal (duration during which information is available to the player) pressures, hence different levels of task difficulty. Taken together, we expected that based on the different difficulty levels, these conditions would be sufficiently demanding to discriminate between different performance levels of players of different ages.
Measures
Passing spatial error. The passing spatial error (PSE) was measured as the distance (in
centimeters) between the ball position at impact (on the screen) and the target position on the screen. The ball center and the target center were used to compute this distance.
Passing speed. The pass speed (PS) was monitored by dividing the 3D distance traveled
by the ball (from its initial position to screen impact position) by the corresponding temporal interval (the delay between the initial ball movement and the ball impact).
Response time. The reactiveness of the player was assessed by computing the response
time (RT). RT was computed as the delay between the instant of stimulus onset and the first instant of ball motion. The trials where players shot before the appearance of the stimulus (negative response time) were excluded from the analysis. This represented a total of 9 trials observed in 9 different players (out of 972 trials executed by these players).
Coaches’ judgments. The coaches were not present during the tests. Before providing
them any information about the performance of their players during thepassing tests, they were asked to assess three aspects of the CMP during ashort-pass situation based on their expe-rience with the players during games and training. This was done through individual inter-views between coaches and the same experimenter. A questionnaire was filled by each coach and the role of the experimenter was to explain the assessment procedure and instructions to the coaches. Each coach (or head coach) was instructed to judge only players that they know. We collected a total of 201 judgments (33, 24, 69 and 75 judgments for the U12, U13, U14 and U15U16 groups, respectively) across all coaches.
Absolute judgments: Each coach had to judge each player using 3 graduated horizontal scales for assessing, fromlow to high, the reactiveness (RE), the passing accuracy (PA) and the passing speed (PS) of the players in short pass situations. The scales were 5 centimeters-long, had 0.1 centimeter intervals and were printed on the questionnaire for each player and param-eter (0.1 point interval): coaches had to trace a vertical line on the scale to assess the score of a particular player. After each judgment, coaches had to tell the degree of certainty (DC) in their
judgments on another scale ranging from complete uncertainty (0%) to complete certainty (100%), using a graduated horizontal placed below each 5-point scale.
Relative judgments: Once they had filled out the whole questionnaire, coaches were asked to repeat the procedure but using relative judgments: here, coaches were told the name of a ref-erence player. This player belonged to the U15U16 group and obtained the best cumulated COGNIFOOT scores and was considered as the best (or one of the three best) players by coaches. Coaches were told that the maximal score of 5 points was the score of the reference player. They then had to provide their judgments relatively to the score of this reference player using the procedures described previously, but with a different color. The objective of this instruction was to force coaches to take into account the actual performance of a player in rela-tion to this reference player and not rate the player solely within his age-group.
Coaches’ judgements vs Cognifoot measurements. The COGNIFOOT measurements
(PSE, PS and RT) were converted into PA, PS and RE scores using the same 5-point scales, as follows. We first assigned the maximum scores PAmax, PSmax andREmax(5 points) to the
(mea-sured) lowest passing spatial error PSElowest, the fastest passing speed PSfastestand the shortest
response time RTbestmeasured across all players. The PSEplayer, PSplayerand RTplayerwere then
converted into a 5-point scale by computing the scores PAscore, PSscoreand REscorewhere
PAscore= (PSElowest/ PSEplayer) / PAmax, PSscore= (PSplayer/ PSfastest) / PSmaxand REscore=
(RTshortest/ RTplayer) / REmax. The PAscores, PSscores,and REscorescomputed with COGNIFOOT
and the ones provided by coaches were then compared.
Statistical analysis
The mean CMP parameters reflect the global passing performance of a player across all trials and were computed as the mean value (PSE, PS or RT) across all recorded passes of this partic-ular player. The effects of age (continuous predictor) on the mean CMP parameters (depen-dent variables) were assessed using a linear regression model which included 46 data points (players). The normality of each of the computed distributions was verified using Kolgo-morov-Smirnov tests. In a second stage, the same linear regression model was performed with soccer experience as a predictor. This was tested to determine whether the accumulated soccer experience, in addition to age, could also predict the mean CMP. The strength of the correla-tion was measured using the correlacorrela-tion coefficientr and the parameters of the regression line equation (intercept and slope). In particular, the slope was used to measure the age-related and soccer experience-related change in performance over years.
Another linear regression model (with age as a continuous predictor variable) was then used for individual CMP parameters (PSE, PS and RT, dependent variables): this model allowed dis-criminating between the tested conditions. In particular, we assessed the potential effects of the target position (3 eccentricities x 3 heights), the number of distractors (N = 3), the stimulus duration (N = 4) and the interaction effects on the CMP, in addition to the effect of age. The normality of each of the computed distributions was here also verified using Kolgomorov-Smir-nov tests prior to performing linear regressions. A total of 4879 data points was used for this model: 108 stimuli x 46 players = 4968minus 9 incorrect trials minus 80 missing passes for one player of the U14 group (for whom we met hardware problems with the laptop after 28 passes– data of this player were not included in the model). These data are detailed in the supplementary material S1. For all regressions, the significance level was fixed to p<0.05. Any significant main and interaction effects were followed up using Bonferroni-corrected pairwise comparisons.
The internal consistency of individual coaches’ scores (e.g. how much coaches changed their judgments across players, irrespective of the inter-coaches difference in the assessment of a particular player) was measured using the Cronbach’s Alpha (α) coefficient [26]. A value ofα
below 0.7 indicates that the consistency of coaches’ judgment is questionable [26]. Repeated-measures ANOVAs (2 types of judgments x 9 coaches) were performed on DCs to compare the DCs across coaches and type of judgments. Any potential interaction effect (coach x type of judgment) is mentioned in the text.
Results
Cognifoot measurements
Passing accuracy. The mean passing spatial error computed across the 108 passes
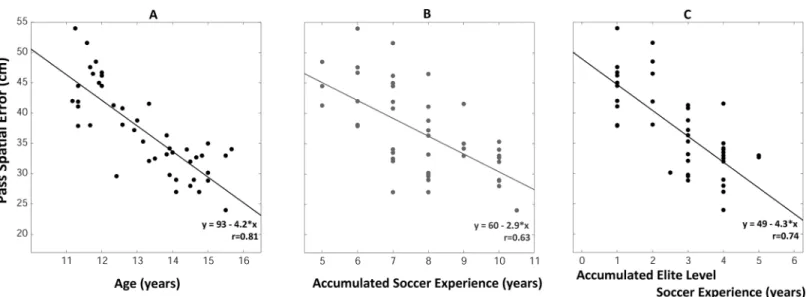
per-formed by each player is presented inFig 2. These data followed a linear relationship (F(1, 44) =
84.73, p<0.001, r = 0.81,Fig 2A): the passing spatial error decreased by 4 cm per year of age: it was equal to 45± 0.05 cm on average in the youngest (U12 group) players and reached a value of 30± 0.03 cm in the U15U16 group. Linear relationships were also observed when plotting the passing spatial error against the accumulated soccer experience (F(1, 44)= 29.77, p<0.001,
r = 0.63,Fig 2B) or the accumulatedElite Level soccer experience (F(1, 44)= 54.09, p<0.001,
r = 0.74,Fig 2C). The regression parameters (e.g. correlation coefficient and slope of the regression line) observed for theElite Level soccer experience (r = 0.74, slope = - 4.3) were comparable to those observed for age (r = 0.81, slope = - 4.2), but differed from those observed for the accumulated soccer experience (r = 0.63, slope = - 2.9, seeFig 2).
The linear regression analysis applied on all recorded passes confirmed the effect of age (F(1, 43)= 88.1, p<0.001). Statistically significant interaction effects were observed (target
lat-eral position and vertical position, the number of visual distractors and the duration of the stimuli—seeS1 Filefor details of all statistical effects, in particular Figure A inS1 File) In par-ticular, passes directed at the floor level were more accurate than passes in other target posi-tions (see supplementary material, page 1).
Passing speed. The mean passing speed as a function of age is presented inFig 3. A linear relationship was observed (F(1, 44)= 28.19, p<0.001,Fig 3A): the passing speed increased
grad-ually with age. The strength of this relationships (r = 0.62) was affected by the presence of two outliers corresponding to two (U12 and U14) players who kicked the ball at low speeds (around 20 km/h,Fig 3A). Notably, these players did not exhibit such outliers for passing accu-racy or response time. The passing speed was equal to 31.7± 3.8 km/h on average for the
Fig 2. Passing spatial error of elite young soccer players as a function of age (A), accumulated soccer experience (B) and elite level-soccer experience (C).
youngest players (U12 group) and increased by 2.3 km/h per year to reach 40.3± 2.0 km/h in the U15U16 group. Linear relationships were also observed when considering the accumulated soccer experience (F(1, 44)= 6.68, p = 0.013, r = 0.36,Fig 3B) or the accumulatedElite Level
soc-cer experience (F(1, 44)= 17.9, p<0.001, r = 0.54,Fig 3C). As for the passing spatial error/age
regressions, regression parameters observed for theElite Level soccer experience (r = 0.54, slope = 2.2) were comparable to those observed for age (r = 0.62, slope = 2.3), but differed from those observed for the accumulated soccer experience (r = 0.36, slope = 1.2, seeFig 3).
The linear regression analysis applied on all recorded passes confirmed the main effect of age (F(1, 43)= 27.6, p<0.001) on the passing speed. However, no statistically significant effect of
the target lateral position and vertical position, the number of visual distractors and the dura-tion of the stimuli on the passing speed was observed (p>0.05, no interacdura-tion effect–see sup-plementary material, pages 2–3 and Figure B inS1 File).
Response time. The mean response time as a function of age is presented inFig 4. A linear relationship was observed (F(1, 44)= 4.11, p = 0.048;Fig 4A): response times linearly decreased
Fig 3. Passing speed of elite young soccer players as a function of age (A), accumulated soccer experience (B) and elite level-soccer experience (C). https://doi.org/10.1371/journal.pone.0185460.g003
with age. The mean response time was equal to 1100± 102 ms on average for the youngest players (U12 group) and decreased by up to 30 ms per year to reach 1027± 193 ms in the U15U16 group. However, the dispersion of the data points for all ages (Fig 4A) was greater than for the passing accuracy (and speed) parameters, resulting in weak correlation coefficient between age and response time (r = 0.29). Such linear relationship was not statistically con-firmed for the response time/accumulated soccer experience (p>0.05, r = 0.13,Fig 4B) and the response time/accumulatedElite Level soccer experience (p>0.05, r = 0.23,Fig 4C).
The linear regression analysis applied on all recorded passes confirmed the main effect of age on response times although the effect was just at significance level (F(1, 43)= 4.01, p =
0.051). We observed a statistically significant effect of the vertical target position (and of age, see supplementary material): response times were shorter with increasing age and for targets located at floor level (see supplementary material S1, pages 3–4 and Figure C inS1 File).
Coaches’ judgements vs Cognifoot measurements
In this section, we focus on the scores provided by coaches in order to a) determine the extent to which they were also affected by the age of the players and b) to test how close they were to the objective measurements provided by the COGNIFOOT system.
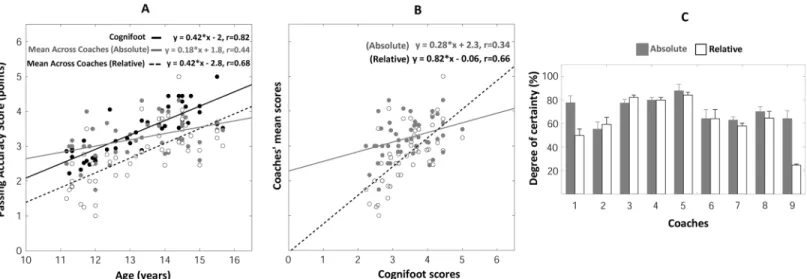
Passing accuracy judgments. The PAscoremeasured by the COGNIFOOT system linearly
increased with age (F(1, 44)= 91.8, p<0.001, r = 0.82,Fig 5A). The individualabsolute and
rela-tive PAscoresprovided by coaches also linearly increased with age although they were marked
by a higher dispersion of data points compared to COGNIFOOT scores, resulting in weaker correlation coefficients (see page 5 and Figure D ofS1 Filefor details). In contrast, the age / mean PAscore(Fig 5A) regressions were comparable to those obtained with COGNIFOOT
scores (F(1, 44)= 10.7, p<0.01, r = 0.44 and F(1, 44)= 37.7, p<0.001, r = 0.68, respectively for
theabsolute and relative judgments,Fig 5A). In particular, the similarity between meanrelative coaches’ judgments and COGNIFOOT scores was further documented by plotting the coaches’ mean scoresvs COGNIFOOT scores (Fig 5B). This revealed that meanrelative PAscoresand
COGNIFOOT scores were linearly correlated (F(1, 44)= 34.5, p<0.01, r = 0.66).
Passing speed judgments. The PSscoremeasured by the COGNIFOOT system linearly
increased with age (F(1, 44)= 28.6, p<0.001, r = 0.63,Fig 6A). The individualabsolute and
Fig 5. Passing accuracy scores as a function of age, measured by the Cognifoot system or judged by coaches (A)—Cognifoot scores vs mean coaches’ scores (B) Degrees of certainty of the coaches in their -passing accuracy- judgments (C).
relative PSscoresprovided by coaches also linearly increased with age (see page 6 and Figure E
ofS1 Filefor details) although the dispersion of data points of PSscoreswas higher than the one
of COGNIFOOT scores, resulting in weaker correlation coefficients. Computing the mean PSscoreacross coaches (Fig 6A) considerably reduced data dispersion and augmented
correla-tion coefficients (F(1, 44)= 14.4, p<0.001, r = 0.50 and F(1, 44)= 49.7, p<0.001, r = 0.73,
respec-tively for theabsolute and relative judgments,Fig 6A). The similarity between meanrelative coaches’ judgments and COGNIFOOT scores was further documented by plotting the coaches’ mean scoresvs COGNIFOOT scores (Fig 6B). This revealed that meanrelative PSscoresand
COGNIFOOT scores were linearly correlated (F(1, 44)= 18.2, p<0.001, r = 0.54).
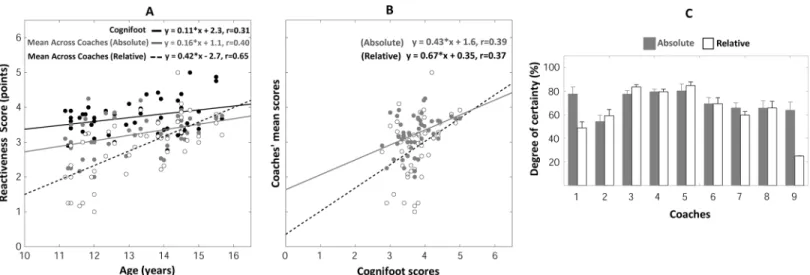
Reactiveness judgments. The REscoremeasured by the COGNIFOOT system linearly
increased with age (F(1, 44)= 4.7, r = 0.31, p = 0.036,Fig 7A). The individualabsolute and
rela-tive REscoresprovided by coaches also linearly increased with age (see pages 6–7 and Figure F
Fig 6. Passing speed scores as a function of age, measured by the Cognifoot system or judged by coaches (A)—Cognifoot scores vs mean coaches’ scores (B) Degrees of certainty of the coaches in their -passing accuracy- judgments (C).
https://doi.org/10.1371/journal.pone.0185460.g006
Fig 7. Reactiveness scores as a function of age, measured by the Cognifoot system or judged by coaches (A)—Cognifoot scores vs mean coaches’ scores (B) Degrees of certainty of the coaches in their -passing accuracy- judgments (C).
ofS1 Filefor details). The mean REscoreacross coaches (Fig 7A) also linearly increased with
age (F(1, 44)= 8.33, p<0.01, r = 0.40 and F(1, 44)= 32.4, p<0.001, r = 0.65, respectively for the
absolute and relative judgments,Fig 7A). Interestingly, the effect of age on the reactiveness of players was stronger in meanrelative coaches’ data than in COGNIFOOT data (0.65 vs 0.31, respectively).
Self-estimated reliability of coaches’ judgments. Coaches provided nearly-similar DCs
when judging passing accuracy, passing speed or reactiveness of a particular player, resulting in comparable DCs’ values (Figs5C,6Cand7C) for these three parameters: DCs typically ran-ged between 55 and 95% of certainty (except for tworelative judgments in coaches 1 and 9). Repeated-measures ANOVAs performed on DCs revealed that DCs significantly varied across coaches for passing accuracy (F(8, 185)= 54,9, p<0.001,Fig 5C), passing speed (F(8, 185)= 72,5,
p<0.001,Fig 6C) and reactiveness (F(8, 185)= 60,6, p<0.001,Fig 7C). DCs ofabsolute
judg-ments (averaged across coaches) were found to be significantly higher than DCs ofrelative judgments for passing accuracy (F(1, 185)= 100,8, p<0.001,Fig 5C), passing speed (F(1, 185)=
101,3, p<0.001,Fig 6C) and reactiveness (F(1, 185)= 70,9, p<0.001,Fig 7C). A significant
(coach x type of judgment) interaction effect was observed for passing accuracy (F(8,185)= 56,1,
p<0.001), passing speed (F(8,185)= 53,3, p<0.001) and reactiveness (F(8, 185)= 68,0, p<0.001).
However, the difference betweenabsolute/relative DCs was mainly induced by relative judg-ments data of coaches 1 and 9. No statistically significant difference between absolute/relative DCs was observed when excluding these coaches for all tested parameters (p>0.05). Notably, only coaches 5 and 6 orally reported thatrelative judgments were easier to provide while coaches 1 and 9 declared thatabsolute judgments were easier to provide.
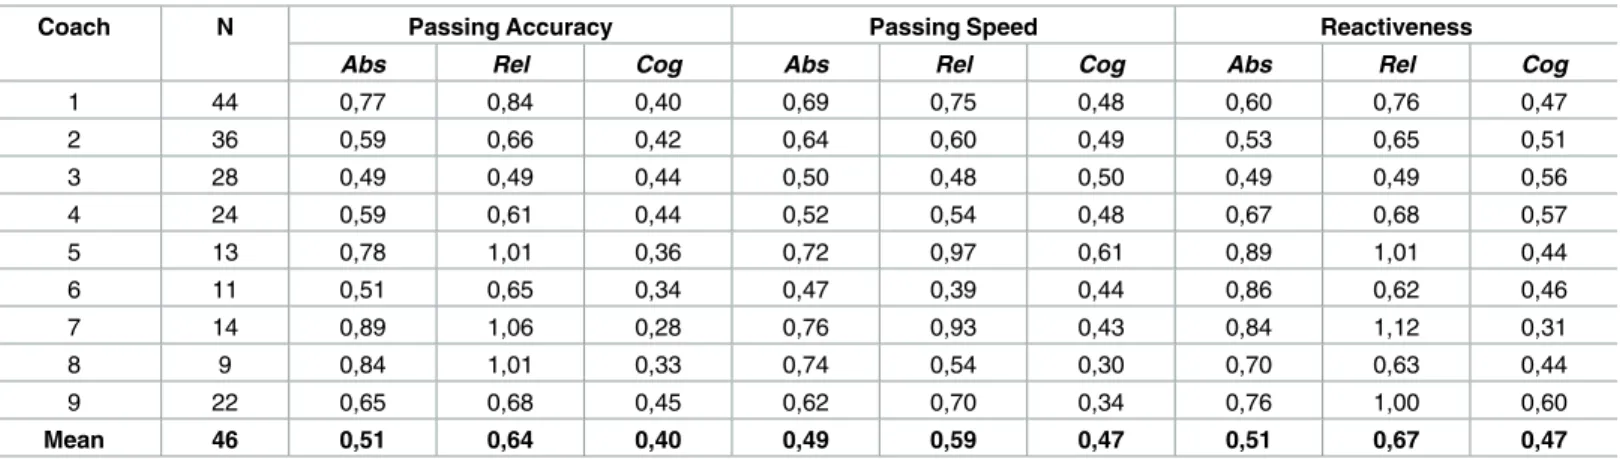
Variability of coaches’ judgments. TheTable 1was designed to complement the ob-servation of a higher dispersion of data points of coaches’ scores (see also supplementary mate-rial) compared to COGNIFOOT scores. Here, we isolated the judgments provided by each coach and computed the root mean squared error (RMSE) of the linear regression fit between scores and age performed only for the sample of players judged by each coach. The RMSE indi-cates how variable the scores around the linear fit were. The corresponding COGNIFOOT scores were extracted for the same samples to allow comparing the variability of coaches and Table 1. Root-mean-square-error (RMSE) of the age/scores regressions performed for every sample of players judged by coaches.
Coach N Passing Accuracy Passing Speed Reactiveness
Abs Rel Cog Abs Rel Cog Abs Rel Cog
1 44 0,77 0,84 0,40 0,69 0,75 0,48 0,60 0,76 0,47 2 36 0,59 0,66 0,42 0,64 0,60 0,49 0,53 0,65 0,51 3 28 0,49 0,49 0,44 0,50 0,48 0,50 0,49 0,49 0,56 4 24 0,59 0,61 0,44 0,52 0,54 0,48 0,67 0,68 0,57 5 13 0,78 1,01 0,36 0,72 0,97 0,61 0,89 1,01 0,44 6 11 0,51 0,65 0,34 0,47 0,39 0,44 0,86 0,62 0,46 7 14 0,89 1,06 0,28 0,76 0,93 0,43 0,84 1,12 0,31 8 9 0,84 1,01 0,33 0,74 0,54 0,30 0,70 0,63 0,44 9 22 0,65 0,68 0,45 0,62 0,70 0,34 0,76 1,00 0,60 Mean 46 0,51 0,64 0,40 0,49 0,59 0,47 0,51 0,67 0,47
Abs, Rel and Cognifoot correspond to absolute/relative coaches’ judgments and COGNIFOOT scores, respectively. The last “virtual” coach (Mean Coach) scores were computed by averaging the scores of different coaches for a same player. Note that except for coach 3, COGNIFOOT’ RMSEs are
systematically lower than coaches’ RMSEs, denoting a higher variability in coaches’ scores. Averaging coaches’ scores across players (Mean Coach) resulted in RMSE of similar magnitude between coaches and COGNIFOOT although the variability of COGNIFOOT scores is still systematically lower (see text for details).
COGNIFOOT scores. For all coaches, the RMSEs values (seeTable 1) were systematically higher than the scores obtained with COGNIFOOT. Only coach 3 provided scores with such a low magnitude of variability that was comparable to the COGNIFOOT scores. Averaging coaches’ scores across players (Mean Coaches’ scores, as those shown for the whole population in Figs5B1,6B1and7B1) resulted in RMSE of similar magnitude between coaches and COG-NIFOOT although the variability of COGCOG-NIFOOT scores was still systematically lower. These observations further show that individual coaches’ judgments were more variable than COG-NIFOOT measurements.
Internal consistency of coaches’ judgments. Theabsolute coaches’ scores performed for the group A had an internal consistency (α Cronbach coefficient) of αpassing accuracy= 0.88,
αpassing speed= 0.68 andαreactiveness= 0.68. Therelative coaches’ scores performed for the group
A had an internal consistency ofαpassing accuracy= 0.87,αpassing speed= 0.65 andαreactiveness=
0.73. Theabsolute coaches’ scores performed for the group B had an internal consistency of αpassing accuracy= 0.83,αpassing speed= 0.85 andαreactiveness= 0.85. Therelative coaches’ scores
performed for the group B had an internal consistency ofαpassing accuracy= 0.87,αpassing speed=
0.70 andαreactiveness= 0.91.
Taken together, these observations show that coaches’ judgments were consistent except for passing speed where alpha coefficient was below 0.7, a value for which the consistency is judged as questionable.
Discussion
The present study aimed i) to investigate the respective effects of age and soccer practice expe-rience on the CMP in young elite soccer players in a short passing situation, and ii) to compare the objectively determined outcome measures of a new high-technology system (COGNI-FOOT) to the more subjective judgements of expert coaches. Based on previous reports [12], we expected substantial improvements in the players’ reactiveness and passing skills from the U12 to the U16 age categories. Our observations went beyond these expectations as we observed linear age-related increases in the CMP. In particular, the passing accuracy, the pass-ing speed and the reactiveness of players improved by 4 centimeters, 2.3 km/h and 30 millisec-onds per year, respectively. These age-related CMP changes measured with COGNIFOOT were also observed in expert coaches’ judgments although these were more variable across coaches and age categories. These observations have several implications for talent identifica-tion and cognitive-motor training that we discuss below.
Effect of age on the cognitive-motor performance in soccer
We observed fine changes in CMP performance of elite young players during a short (5 meters) passing situation: in U12 players, the average spatial error was equal to 45 centimeters but decreased by around 4 centimeters per year to reach 30 centimeters at 15 years of age (Fig 2A). Whether purely cognitive or motor factors account for the age-related improvements reported here cannot be answered with our data. The effects of age and expertise level were examined in a battery of non-specific (basic visual function tests) and soccer-specific percep-tual-cognitive tests in a population of elite (recruited from English Premier League academies) and sub-elite soccer players aged from 9 to 17 years [27]. In this study, film-based simulations were projected on a large screen and participants responded using pencil and paper. Age, but not expertise, significantly affected the performance of participants in basic visual function tests: the visual acuity and the peripheral awareness improved from 9 to 13 years and from 11 and 15 years of age, respectively. Interestingly, age was a stronger predictor than expertise for two specific tests: a “structured memory recall” test where participants were asked to recall the
position of particular players from both teams and an anticipation test where participants had to anticipate the direction of a pass in a 3vs 3 situation. Expertise, but not age, had a significant positive effect on anticipation in 11vs 11 situations and percentage of key players highlighted (the players in a good position to receive the ball in 11 vs 11 situations). In the present study, all the players we tested competed at the elite level: testing novice players at different ages may help in further discriminating between the effect of age and expertise on CMP. While the data clearly indicate that there is a CMP increase with increasing age, we also raised the question whether other parameters such as the ‘accumulated soccer practice’ or the ‘accumulated soccer practice at the elite level’ may even better predict the development of CMP. We observed that age is a better predictor followed by accumulated soccer practice at the elite level and finally accumulated soccer practice for all measured parameters. Using tasks comparable to those tested by Ward and Williams (2003), Roca and Williams [12] reported that the accumulated soccer practice experience during childhood, followed by accumulated soccer practice ex-perience during adolescence were the best predictors of perceptual-cognitive expertise in a population of adult soccer players (around 21 years of age on average) with different levels of expertise (semi-professional, amateur and recreational). The potential separate effects of accu-mulated soccer practice at the elite level and accuaccu-mulated soccer practice were not documented in Roca study. Therefore, including realistic motor responses as in the present study and better discriminating the accumulated soccer practice (elitevs non-elite) may help to provide a better understanding of how cognitive and motor components of the CMP evolve with age and soc-cer practice level.
Assessing the CMP during short-pass situations in soccer
As the importance of CMP assessment has been identified relatively recently (see [4] for a review), the development of adequate tests is still at its beginning. Concerning soccer passing tests, only few field tests provide quantitative and objective measurement of the passing perfor-mance. A widely used test, the Loughborough Soccer Passing Test (LSPT, see [4]), consists in a series of passes executed by players towards soccer-specific, color-coded plastic rebound boards placed along the sides of a 12 m x 9.5 m playfield. A limitation of the LSPT is that the passing accuracy is usually judged by solely one human observer. This can be overcome by measuring passing accuracy using digitizing video footage [28] rather than involving a human observer as in the LSPT studies. In this last study, the passing accuracy and speed during short passing situations (4.2 to 7.9 meters distance) ranged, on average, between 37 and 32 cm and between 42 and 48 km/h in adult recreationalvs professional players, respectively. The passing accuracy was of the same range as the one observed in our study (30–45 cm across age ries). However, the passing speed was lower in our study (30.7–40.3 km/h across age catego-ries). Interestingly, an increase of 2.3 km/h per year of age (as observed in our regressions) would predict a passing speed equal to 47.2 km/h at the adult age for the U15U16 players we tested, a value comparable to the one observed in adult players [28]. Besides, in these studies [28–31] and in contrast with the present study, the height of the target was not manipulated and all passes were performed at floor level. This could have had an effect on the measured parameters as we observed statistically significant effects of thetarget lateral position x vertical position and vertical target position on the passing accuracy and response times, respectively.
While these different testing protocols proved to successfully discriminate between the per-formance levels of male, female and adolescent players at the motor execution level [28–31], the visual environment was always static (four rebound boards/targets located at fixed loca-tions) and visual targets are visible for the whole test duration. Thus, the cognitive aspect of the test can be rated as not very demanding and cannot be easily adapted. This means that no
measurements of the response times (not documented in the mentioned studies) or passing speed in more dynamic environments, i.e. with targets appearing for random durations and at random positions, in presence of various numbers of visual distractors, as observed during real competition, can be provided. For this purpose, the COGNIFOOT system was developed that provides quantitative measurements automatically and in real-time. In the present study, we designed a test with higher perceptual demands and highly objective quantification of the outcome measures in order to judge CMP in young soccer players. Although we simulated simple visual stimuli, we could observe a statistically significant effect on the passing accuracy: the passing accuracy was greatest for targets at floor level, without visual distractors and for stimulus durations longer than 200 ms. It should be noted that new systems like COGNIFOOT allow a fine simulation of a theoretical infinite number of situations and the testing of several components of perceptual skills while at the same time recording accurately-measured CMP variables, a huge difference to the field tests developed so far.
Comparison between Cognifoot measures and coaches’ evaluation
Although more and more complex soccer tests and test batteries are developed, an influential part in talent selection is still the judgement of the coaches and/or talent scouts. Therefore, we compared the results obtained with COGNIFOOT with the evaluation provided by well-edu-cated and well-experienced coaches. Importantly, we obtained the ratings of the coaches in two different ways by asking them to provideabsolute and relative judgments: absolute judg-ments were evaluations of coaches without providing a specific reference whilerelative judg-ments asked coaches to give their judgejudg-ments with reference to one well-known player–the best player of the oldest category. We hypothesized that providing a reference would enable coaches to better differentiate their judgements across age groups and avoid biases due to tak-ing into account the potential of young players instead of their actual CMP-performance. In line with our hypothesis, the meanrelative coaching scores were closer to the objectively-mea-sured scores by the COGNIFOOT (Figs5B,6Band7B) and reflected better the progression with age and/or experience. This was also indicated by smaller variability of the data when using the relative compared to the absolute coaches’ judgement (Table 1). However, irrespec-tive of the way coaches judged the performance of their players (absolute or relairrespec-tive judge-ment) it has to be emphasized that only the mean score across all coaches for each individual player led to considerably reduced data dispersion and increased correlation coefficients. For the relative judgements, this procedure resulted in comparable regression line parameters as the ones obtained with COGNIFOOT (Fig 5B). This questions the reliability of evaluations that are based on one coach/scout only–especially if they are made without a specific reference, which may be important for talent selection procedures.
Implications for talent selection
The comparison of absolute and relative judgements in the present study has indicated that clear reference values, either the level of one specific player or a certain performance criterion may help to reduce variability across coaches’ judgements. This may be an important aspect to improve talent identification programs. However, in any case, objective measurements of quantitative data like those provided by the COGNIFOOT system have an even greater dis-criminative power as it relies on physical measurements of clearly-defined CMP parameters. Furthermore, as only the mean of the coaches’ score was comparable to the COGNIFOOT score, talent selection based on the judgement of one single coach may inherit serious limita-tions as mentioned earlier. At the same time, it has to be noted that the COGNIFOOT system only assessed CMP in short pass situations and does therefore not allow a more global
assessment. Therefore, future approaches using high-technology systems should be extended by including more realistically simulated situations that may further strengthen the ecological validity of these systems. In particular, the challenge would be to extend CMP measurements to soccer-specific CMP-skills such as long passes, free kicks, penalty or corner kicks as well as collective actions leading to one of these actions. Such progress may allow more reliable talent selection processes in the future.
Cognitive-motor training in soccer
The efficiency of any training program can only be assessed by having pre-training and post-training measurements. For physiological assessments in soccer, reliable field tests like the Yo-Yo test [32] are widely used in elite soccer. The COGNIFOOT prototype used in this study offers an interesting possibility for providing such objective and quantitative measurements of the CMP. In our study, we noticed few interaction effects between motor factors (linked to the diffi-culty to hit laterally-high targets) and visual factors (stimulus duration and number of visual dis-tractors) on the passing accuracy (see Figure A ofS1 File) or on the response times (see Figure C ofS1 File). Adding a textured background or a real image (or movie) may more significantly affect passing accuracy and response times. Exposing players to a variety of specific and non-spe-cific stimuli may provide new insights into the interaction between the cognitive demands of a situation and the quality of motor execution. It would also be interesting to reproduce these tests in combination with fatigue protocols in order to quantify a potential fatigue-effect on the CMP of soccer players (see for example [33] and [34].For example, shots and passes accuracy and/or speed were found to significantly decrease during the second half compared to the first half of a soccer match simulation [34]. However, despite accurate and reliable measurements of the CMP, current limits of this prototype should be overcome in the future: i) the ball was static at the beginning of each passing sequence and ii) the stimuli were static. Besides, future versions of the COGNIFOOT system may integrate ball launching devices and different types of visual envi-ronments (with static or moving targets, or freely-chosen pass destination when facing real game situations) in order to automatize the sequence of passes and for enhanced ecological validity. This would allow using the COGNIFOOT for testing different CMP training protocols.
Conclusions
Measuring the CMP of soccer players in realistic situations is of particular interest. Here we report objective CMP measurements showing linear improvements of the cognitive-motor performance with age in short-pass situations in young elite soccer players that, to the best of our knowledge, are documented for the first time. These observations confirmed that the pre-adolescence–mid-adolescence period is of critical developmental stage for the acquisition of superior perceptual-cognitive skills in soccer [12]. Besides, objectively-measured scores were comparable to mean expert coaches’ scores (although these were more variable across coaches and age categories), showing that high-technology systems like COGNIFOOT can be useful for talents’ identification. Through its high adaptability and real-time properties, such systems also offer a great potential for cognitive-motor training. Future studies using comparable methodologies are required to further document how cognitive and motor skills of soccer players evolve with soccer practice in adult players and with other factors like fatigue or exter-nal environmental features (e.g. humidity or temperature).
Supporting information
S1 File. Cognifoot measurements across all tested conditions (number of visual distractors, stimulus duration and target positions) and individual coaches’ judgments. Figure A:
Passing spatial error of elite young soccer players. Figure B: Passing speed of elite young soccer players. Figure C: Response times of elite young soccer players. Figure D: Passing accuracy scores measured by the Cognifoot system or judged by coaches. Figure E: Passing speed scores measured by the Cognifoot system or judged by coaches. Figure F: Reactiveness scores mea-sured by the Cognifoot system or judged by coaches.
(DOCX)
Acknowledgments
The authors are grateful to the players/coaches of the team AFF, especially to Erich Schafer, to Laurent Cle´ment (Realsport, Rossens, CH) for his help during the installation of the set-up and to Yves De´bonnaire (Association Suisse de Football) for interesting discussions.
Author Contributions
Conceptualization: Halim Hicheur, Xavier Chenevière.
Data curation: Halim Hicheur.
Formal analysis: Halim Hicheur, Alan Chauvin. Funding acquisition: Halim Hicheur.
Investigation: Halim Hicheur, Steve Chassot.
Methodology: Halim Hicheur, Alan Chauvin, Xavier Chenevière, Wolfgang Taube.
Project administration: Halim Hicheur, Wolfgang Taube. Resources: Halim Hicheur, Wolfgang Taube.
Software: Halim Hicheur. Supervision: Halim Hicheur. Validation: Halim Hicheur. Visualization: Halim Hicheur.
Writing – original draft: Halim Hicheur.
Writing – review & editing: Halim Hicheur, Alan Chauvin, Xavier Chenevière, Wolfgang Taube.
References
1. Williams AM. Perceptual skill in soccer: implications for talent identification and development. Journal of sports sciences. 2000; 18(9):737–50. Epub 2000/10/24.https://doi.org/10.1080/02640410050120113
PMID:11043899.
2. Romo R, Lemus L, de Lafuente V. Sense, memory, and decision-making in the somatosensory cortical network. Current opinion in neurobiology. 2012; 22(6):914–9. Epub 2012/09/04.https://doi.org/10. 1016/j.conb.2012.08.002PMID:22939031.
3. Sasaki Y, Nanez JE Sr., Watanabe T. Recent progress in perceptual learning research. Wiley interdisci-plinary reviews Cognitive science. 2012; 3(3). Epub 2012/05/01.https://doi.org/10.1002/wcs.1175
PMID:24179564; PubMed Central PMCID: PMC3811035.
4. Ali A. Measuring soccer skill performance: a review. Scandinavian journal of medicine & science in sports. 2011; 21(2):170–83. Epub 2011/01/08.https://doi.org/10.1111/j.1600-0838.2010.01256.x
PMID:21210855.
5. Schaefer S. The ecological approach to cognitive-motor dual-tasking: findings on the effects of exper-tise and age. Frontiers in psychology. 2014; 5:1167. Epub 2014/10/30.https://doi.org/10.3389/fpsyg. 2014.01167PMID:25352820; PubMed Central PMCID: PMC4196472.
6. Stroop JR. Studies of interference in serial verbal reactions. Journal of Experimental Psychology. 1935; 18(6).https://doi.org/10.1007/BF03348308PubMed PMID: 6895906.
7. Roca A, Ford PR, McRobert AP, Mark Williams A. Identifying the processes underpinning anticipation and decision-making in a dynamic time-constrained task. Cognitive processing. 2011; 12(3):301–10. Epub 2011/02/10.https://doi.org/10.1007/s10339-011-0392-1PMID:21305386.
8. Romeas T, Faubert J. Soccer athletes are superior to non-athletes at perceiving soccer-specific and non-sport specific human biological motion. Frontiers in psychology. 2015; 6:1343. Epub 2015/09/22.
https://doi.org/10.3389/fpsyg.2015.01343PMID:26388828; PubMed Central PMCID: PMC4558464. 9. Vestberg T, Gustafson R, Maurex L, Ingvar M, Petrovic P. Executive functions predict the success of
top-soccer players. PloS one. 2012; 7(4):e34731. Epub 2012/04/13.https://doi.org/10.1371/journal. pone.0034731PMID:22496850; PubMed Central PMCID: PMC3319604.
10. Faubert J. Professional athletes have extraordinary skills for rapidly learning complex and neutral dynamic visual scenes. Scientific reports. 2013; 3:1154. Epub 2013/02/05.https://doi.org/10.1038/ srep01154PMID:23378899; PubMed Central PMCID: PMC3560394.
11. Huijgen BC, Leemhuis S, Kok NM, Verburgh L, Oosterlaan J, Elferink-Gemser MT, et al. Cognitive Functions in Elite and Sub-Elite Youth Soccer Players Aged 13 to 17 Years. PloS one. 2015; 10(12): e0144580. Epub 2015/12/15.https://doi.org/10.1371/journal.pone.0144580PMID:26657073; PubMed Central PMCID: PMC4691195.
12. Roca A, Williams AM, Ford PR. Developmental activities and the acquisition of superior anticipation and decision making in soccer players. Journal of sports sciences. 2012; 30(15):1643–52. Epub 2012/07/ 10.https://doi.org/10.1080/02640414.2012.701761PMID:22769067.
13. Roca A, Ford PR, McRobert AP, Williams AM. Perceptual-cognitive skills and their interaction as a func-tion of task constraints in soccer. Journal of sport & exercise psychology. 2013; 35(2):144–55. Epub 2013/03/29. PMID:23535973.
14. Roca A, Williams AM, Ford PR. Capturing and testing perceptual-cognitive expertise: a comparison of stationary and movement response methods. Behavior research methods. 2014; 46(1):173–7. Epub 2013/06/25.https://doi.org/10.3758/s13428-013-0359-5PMID:23794270.
15. Smeeton NJ, Williams AM. The role of movement exaggeration in the anticipation of deceptive soccer penalty kicks. Br J Psychol. 2012; 103(4):539–55. Epub 2012/10/05. https://doi.org/10.1111/j.2044-8295.2011.02092.xPMID:23034111.
16. Bishop DT, Wright MJ, Jackson RC, Abernethy B. Neural bases for anticipation skill in soccer: an FMRI study. Journal of sport & exercise psychology. 2013; 35(1):98–109. Epub 2013/02/14. PMID:
23404883.
17. Wright MJ, Bishop DT, Jackson RC, Abernethy B. Brain regions concerned with the identification of deceptive soccer moves by higher-skilled and lower-skilled players. Frontiers in human neuroscience. 2013; 7:851. Epub 2014/01/02.https://doi.org/10.3389/fnhum.2013.00851PMID:24381549; PubMed Central PMCID: PMC3865769.
18. Makris S, Urgesi C. Neural underpinnings of superior action prediction abilities in soccer players. Social cognitive and affective neuroscience. 2015; 10(3):342–51. Epub 2014/04/29.https://doi.org/10.1093/ scan/nsu052PMID:24771282; PubMed Central PMCID: PMC4350476.
19. Thompson J, Parasuraman R. Attention, biological motion, and action recognition. NeuroImage. 2012; 59(1):4–13. Epub 2011/06/07.https://doi.org/10.1016/j.neuroimage.2011.05.044PMID:21640836. 20. Aglioti SM, Cesari P, Romani M, Urgesi C. Action anticipation and motor resonance in elite basketball
players. Nature neuroscience. 2008; 11(9):1109–16. Epub 2009/01/23. PMID:19160510.
21. Brainard DH. The Psychophysics Toolbox. Spatial vision. 1997; 10(4):433–6. Epub 1997/01/01. PMID:
9176952.
22. Pelli DG. The VideoToolbox software for visual psychophysics: transforming numbers into movies. Spa-tial vision. 1997; 10(4):437–42. Epub 1997/01/01. PMID:9176953.
23. Kleiner M, Brainard D, Pelli D. What’s new in Psychtoolbox-3? 36 ECVP Abstract Supplement: Percep-tion 2007.
24. Liu H, Gomez MA, Goncalves B, Sampaio J. Technical performance and match-to-match variation in elite football teams. Journal of sports sciences. 2016; 34(6):509–18. Epub 2015/11/28.https://doi.org/ 10.1080/02640414.2015.1117121PMID:26613399.
25. Causer J, McRobert AP, Williams AM. The effect of stimulus intensity on response time and accuracy in dynamic, temporally constrained environments. Scandinavian journal of medicine & science in sports. 2013; 23(5):627–34. Epub 2012/02/02.https://doi.org/10.1111/j.1600-0838.2011.01440.xPMID:
22292917.
26. Cronbach LJ. Coefficient alpha and the internal structure of tests. Psychometrika. 1951; 16(3):297– 334.
27. Ward P, Williams AM. Perceptual and Cognitive Skill Development in Soccer: The Multidimensional Nature of Expert Performance. Journal of Sport and Exercise Psychology. 2003; 25:93–111. 28. Russell M, Benton D, Kingsley M. Reliability and construct validity of soccer skills tests that measure
passing, shooting, and dribbling. Journal of sports sciences. 2010; 28(13):1399–408. Epub 2010/10/23.
https://doi.org/10.1080/02640414.2010.511247PMID:20967673.
29. Ali A, Williams C, Hulse M, Strudwick A, Reddin J, Howarth L, et al. Reliability and validity of two tests of soccer skill. Journal of sports sciences. 2007; 25(13):1461–70. Epub 2007/09/14.https://doi.org/10. 1080/02640410601150470PMID:17852682.
30. Ali A, Foskett A, Gant N. Validation of a soccer skill test for use with females. International journal of sports medicine. 2008; 29(11):917–21. Epub 2008/05/31.https://doi.org/10.1055/s-2008-1038622
PMID:18512177.
31. Le Moal E, Rue´ O, Ajmol A, Abderrahman AB, Hammami MA, Ounis OB, et al. Validation of the Lough-borough Soccer Passing Test in young soccer players. J Strength Cond Res. 2014; 28(5):1418–26.
https://doi.org/10.1519/JSC.0000000000000296PMID:24149764
32. Krustrup P, Mohr M, Amstrup T, Rysgaard T, Johansen J, Steensberg A, et al. The yo-yo intermittent recovery test: physiological response, reliability, and validity. Medicine and science in sports and exer-cise. 2003; 35(4):697–705. Epub 2003/04/04.https://doi.org/10.1249/01.MSS.0000058441.94520.32
PMID:12673156.
33. Casanova F, Garganta J, Silva G, Alves A, Oliveira J, Williams AM. Effects of prolonged intermittent exercise on perceptual-cognitive processes. Medicine and science in sports and exercise. 2013; 45 (8):1610–7. Epub 2013/03/09.https://doi.org/10.1249/MSS.0b013e31828b2ce9PMID:23470295. 34. Russell M, Benton D, Kingsley M. The effects of fatigue on soccer skills performed during a soccer
match simulation. International journal of sports physiology and performance. 2011; 6(2):221–33. Epub 2011/07/05. PMID:21725107.