Naming of the Waves in the ECG, With a Brief Account of Their Genesis
J. Willis Hurst, MD
T he purpose of this presentation is 2-fold: to tell the stories of the naming of the waves in the ECG and to discuss briefly the electrical activity that produces them.
PQRST and U Waves Naming the PQRST and U Waves
In March 1997, I wrote to Howard Burchell to inquire if the legend about the naming of the waves in the ECG was true or not. Did Einthoven really have the foresight to recognize that by choosing letters near the middle of the alphabet, letters would be available to label waves that might be discovered later? Burchell’s response, dated March 31, 1997, is repro- duced below:
I could never get a direct confirmation that the letters were intentionally chosen from the middle of the alphabet, but Snellen, his “official biographer,” has said so, and he should know.
There is another hypothesis put forward by Henson—relating an explanation of “P” standing for a point in a Descartes scheme—in the Journal of the
History of Medicine and Allied Sciences 1971,26:181.
A note on Descartes seems appropriate because although he was born in France in 1596 and died in 1650, he plays a major role in the story that unfolds.
1He invented analytical geometry. He was the first scientist to state the law of refraction, and he labeled some of the points on the curves he drew P and Q. As discussed later, Einthoven undoubtedly studied the work of Descartes, as did all serious students of geometry and physics.
The first human ECG, recorded by Waller
2in 1887 with Lippmann’s capillary electrometer, revealed only 2 deflec- tions. Being a physiologist, Waller labeled the waves as one would expect a physiologist to do: he used letters that suggested the anatomic parts of the heart that produced them.
Accordingly, he labeled the 2 waves V
1and V
2to indicate ventricular events. Einthoven, using a Lippmann capillary electrometer, also obtained tracings with 2 waves made by the ventricles and labeled them A and B. When Einthoven later recorded atrial excitation with an improved Lippmann elec- trometer, Waller labeled the newly discovered deflection with an A to indicate it was produced by the atria. Einthoven, who had already used A to label the first ventricular event, used P to designate the record made by the electrical activity
produced by the atria. His labeling of the primitive tracing was then mixed: A and B, the first letters of the alphabet, were used to indicate ventricular events, and P, from near the middle of the alphabet, was used to indicate atrial events.
When Einthoven used the letter P, he was undoubtedly thinking about Descartes’ use of the letter P to designate a point on a curve. As will be shown, this eventually led to the use of PQRST to designate the waves in the ECG. Waller, however, refused to use the new labels.
3The ECG recorded by Einthoven with an even more refined Lippmann capillary electrometer showed 4 deflec- tions.
4Einthoven labeled these waves ABCD. He eliminated the letter P, shifted the letter A to indicate electrical activity of the atria, and used B to designate the first downward deflection produced by electrical activity of the ventricles. He used C to designate the first upward wave and D to identify the last upward wave produced by electrical activity of the ventricles (now known as repolarization of the ventricles).
Einthoven developed a mathematical formula that compen- sated for the inertia and friction of the mercury column in the capillary tube of the refined Lippmann electrometer. In 1895 he published an illustration (Figure 1) that showed his mathematically corrected curve superimposed on the uncor- rected curve made by the refined Lippmann capillary elec- trometer.
5Note that Einthoven’s purpose was to show how his mathematically corrected ECG, which contained more waves, differed from the tracing made with the refined Lippmann capillary electrometer. Because he used ABCD to indicate the waves in the uncorrected tracing, he was forced to find other letters to label his corrected curve, which he superimposed on the uncorrected tracing. He chose PQRST.
One attractive hypothesis is that Einthoven chose these letters because Descartes had used them to identify successive points on a curve.
Henson’s magnificent article,
6cited by Burchell, supports the idea that Einthoven used letters popularized by Descartes.
I have simply highlighted the reason Einthoven no longer used ABCD; he had to change letters because in a single illustration he had to show how his corrected curve differed from the uncorrected curve.
Now let us look at Snellen’s account of the naming of the waves in the ECG. It is reprinted here with permission.
To eliminate confusion with the uncorrected trac- ings and to allow space for possible later additions (such as later actually happened with the U wave) the
From the Division of Cardiology, Department of Medicine, Emory University School of Medicine, Atlanta, Ga.
Correspondence to J. Willis Hurst, MD, 1462 Clifton Rd NE, Suite 301, Atlanta, GA 30322.
(Circulation. 1998;98:1937-1942.)
© 1998 American Heart Association, Inc.
1937
letters PQRST from the middle of the alphabet were substituted for ABCD in designating the different peaks in the ECG.
4Snellen’s account of the naming of the PQRST waves is correct. My only contribution is one of emphasis. I suspect, as the first 7 words of Snellen’s statement indicate, that the primary reason for changing the letters from ABCD to PQRST was to eliminate confusion in an illustration that showed both uncorrected and corrected curves. I believe that Einthoven recognized, perhaps as an afterthought, that by choosing PQRST he allowed space to add letters before P and after T.
Einthoven continued to use PQRST to identify waves in the ECG recorded with the string galvanometer. PQRST, of course, is still used today (Figure 2).
Einthoven identified the U wave a few years later.
7The U wave was detected only in ECGs made with the string galvanometer.
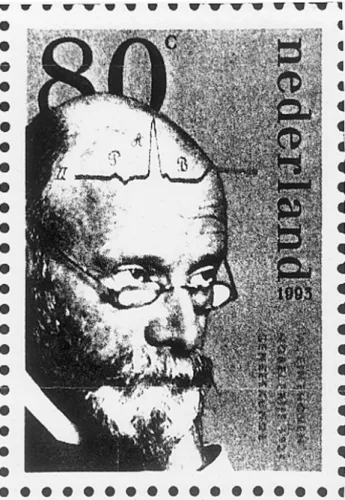
In 1993 Einthoven’s country, the Netherlands, issued a postage stamp in his honor (Figure 3). Note that the tracing used by the artist was made with a galvanometer and is similar to the ECG made by Einthoven and published as Figure 58B in the biography of Einthoven by DeWaart.
8Tracings made with Einthoven’s galvanometer were usu- ally routinely labeled PQRST. Why then did he use PAB to label a tracing made with his galvanometer? Such labeling harks back to an earlier period when the letters were used to identify waves in the tracing made by a slightly improved Lippmann capillary electrometer. Why Einthoven used the same labeling in a tracing made with his galvanometer remains a mystery.
Genesis of PQRST and U Waves
The first half of the P wave is produced largely by depolarization of the right atrium; the second half is produced largely by depolarization of the left atrium. The wave of depolarization spreads through the ventricles predominantly from the endocardial area to the epicar- dium. The initial 0.01 second of the QRS complex is caused by depolarization of the middle of the left side of the interventricular septum. The next few milliseconds of the QRS complex are produced by depolarization of the endocardium of both ventricles, and the next few by depolarization of a decreasing amount of the right ventricle and an increasing amount of the left ventricle. The last few milliseconds of the QRS complex are caused by depolar- ization of the basilar portion of the left ventricle.
9 Figure 1.Two ECGs are shown, 1 superimposed on the other.Einthoven wanted to show the difference in the 2 curves. He labeled the uncorrected curve ABCD. This tracing was made with his refined Lippmann capillary electrometer. The other curve was mathematically corrected by Einthoven to allow for inertia and friction in the capillary tube. He chose the letters PQRST to separate the tracing from the uncorrected curve labeled ABCD. The letters PQRST undoubtedly came from the system of labeling used by Descartes to designate successive points on a curve. From Reference 5.
Figure 2.This ECG shows the parts of the tracing that Einthoven labeled P, QRS, T, and U. This labeling was used routinely after tracings were made with the galvanometer.
Adapted from Hurst JW.Ventricular Electrocardiography.New York, NY: Gower Medical Publishing; 1991:5–26.
Figure 3.The postage stamp issued by the Netherlands in 1993 in honor of Einthoven. The ECG imprinted on his forehead was made with a galvanometer. It had become standard to label waves made by a galvanometer as PQRST. Note that Einthoven reverted to the use of PAB to label the waves in this particular ECG. Why he used an old, mixed rubric is unknown (see text).
The T wave is produced by repolarization of the ventricles.
The wave of repolarization moves predominantly from epi- cardium to endocardium. It puzzled scientists for many years why a mean vector representing the T waves was directed in almost the same direction as the mean vector representing the QRS complexes. This led to the development of the concept of the ventricular gradient.
The spectacular work of Antzelevitch and his coworkers should be reviewed by every clinician who uses the ECG as a diagnostic tool.
10,11Antzelevitch and his associates discovered and named the M cells (M stands for Antzelevitch’s institute [Masonic], midmyocardial [the approximate location of the cells], and Gordon K. Moe [Antzelevitch’s friend and mentor]).
These special ventricular myocytes are different from the other myocytes in the ventricular myocardium. The M cells are found from the deep subendocardium to midmyocardium in the lateral ventricular wall and throughout the ventricular wall in the region of the outflow tracts.
12The M cells are histologically similar to other myocytes, but they are electrophysiologically and pharma- cologically different. For example, the action potential of the M cells lasts longer than that of other myocytes. The M cells resemble Purkinje cells more than they do other myocytes, yet they differ from Purkinje cells in several ways. For example, the M cells and Purkinje cells respond in opposite ways to an
a-adrenergic agonist.
12Antzelevitch believes that normal U waves are produced by repolarization of the His-Purkinje cells. An abnormal U wave (large or inverted) is part of the T wave; it may be referred to as an interrupted T wave.
I wrote to Antzelevitch on June 7, 1997, and asked him to write a few sentences about the U wave. He answered on July 1, 1997:
The picture that is emerging from our studies is that the main forces underlying the T wave may be due to transmural voltage gradients and that the normal U wave is most likely due to repolarization of the His-Purkinje system. It is also becoming increasingly evident that most pathophysiological U waves are not U waves at all, but rather second components of an interrupted T wave. These entities, which more often than not are referred to as U waves in the literature, are due to crossover of voltage gradients flowing across the wall on either side of the M cells.
Delta Wave Naming the Delta Wave
The short PR interval and slurred initial portion of the QRS complex were noted by Wilson,
11Wedd,
13and Hamburger
14before publication of the famous 1930 paper in which Wolff, Parkinson, and White
15associated the abnormality with su- praventricular tachycardia. However, none of these research- ers, including Wolff, Parkinson, and White, labeled the slurred initial portion of the QRS complex as a delta wave (Figure 4A). Wolff, Parkinson, and White erroneously con- jectured that the wide QRS complex was caused by a type of bundle-branch block. This view was corrected in 1933 by Wolferth and Wood.
16I again wrote to Burchell on March 4, 1997, and asked him who named the slurred initial portion of the QRS complex.
He wrote, “The delta wave was in common use in the fifties and sixties, and Hans Hecht gives credit to Segers, Lequime and Denolin. One assumes the name came from the shape of the wave—not from any Greek fraternity member!”
Burchell wrote to Dennis Krikler about the matter. Krikler answered Burchell on March 25, 1997. He wrote, “Hecht was right in attributing the usage to Segers, Lequime and Denolin,” and provided the key reference.
17I wrote to Krikler on May 27, 1997, and asked him when Denolin and his colleagues first used the word delta. On June 6, 1997, he replied as follows:
. . . the best we can do is to deduce that they first used the word delta for the appropriate wave in 1942 and 1943.
Two further thoughts: I do not know which of the three it was, Segers, Lequime or Denolin, who first thought of using delta. . . . It may be preferable to give global credit to them as a trio.
Guy Fontaine answered my query on this subject in a letter dated June 26, 1997:
In the original paper by Segers, Lequime and Denolin, the delta wave was not written “delta” but was indicated by the Greek letter
Dto stress the shape of the triangle. In the description, which was written in French and which I read carefully, it was indicated that “this deformation of the PQ segment is the result
Figure 4.A, Delta wave, named by Segers, Lequime, and Denolin (see text and Refer- ence 17). It is caused by preexcitation of the ventricles via a congenital bypass tract.
Adapted from Hurst JW, Myerburg RJ.
Introduction to Electrocardiography.2nd ed. 1973:185. B, The term “Osborn wave”
designates the spike-and-dome shape of the QRS complex. The QT interval is pro- longed. The abnormal deflection is com- monly found in patients during extreme hypothermia. From Trevino A, Razi B, Beller BM. The characteristic ECG of accidental hypothermia.Arch Intern Med
1971;127:472. (Reprinted with permission.) C, The epsilon wave is common in patients with arrhythmogenic right ventricular dysplasia and is also seen in other diseases of the right ventricle. This figure was sent to the author by Dr Guy Fontaine; the recording is from a 27-year-old man who had episodes of palpitation.
of a supplementary electrical deflection that we pro- pose to call
D.”
Genesis of the Delta Wave
Wolferth and Wood pointed out that the abnormal slurring of the initial part of the QRS complex and prolongation of the QRS complex were not due to bundle-branch block as proposed by Wolff, Parkinson, and White but were caused by an “actual acceleration of the passage of the impulse from the auricle to a section of the ventricle.”
16They also stated, “all the data so far obtained are in keeping with the possibility that an accessory pathway of AV con- duction such as described by Kent [Reference 18] between the right auricle and right ventricle could be responsible for the phenomenon manifested by these cases.”
Osborn Wave
Naming the Osborn Wave
The scholarly article by Gussak and associates
19served as the source for most of the information that follows.
The J point in the ECG is the point where the QRS complex joins the ST segment.
19It represents the approximate end of depolarization and the beginning of repolarization as deter- mined by the surface ECG. There is an overlap of
'10 milliseconds.
20The J point may deviate from the baseline in early repolarization, epicardial or endocardial ischemia or injury, pericarditis, right or left bundle-branch block, right or left ventricular hypertrophy, or digitalis effect.
21,22The term J deflection has been used to designate the formation of the wave produced when there is a large, prominent deviation of the J point from the baseline. The J deflection has been called many names,
19including camel-hump sign,
23late delta wave,
24J-point wave,
25and Osborn wave.
26The prominent J deflection attributed to hypothermia was first reported in 1938 by Tomaszewski.
27The wave was observed by others, including Kossmann,
28Grosse-Brockhoff and Schoedel,
29Bigelow et al,
30Juvenelle et al,
31and Osborn.
26Over the years, the unusual wave increasingly has been called an Osborn wave (Figure 4B), probably because of Osborn’s excellent article written in 1953.
26Clinicians la- beled the deflection an Osborn wave in honor of Osborn, one of the first American Heart Association research fellows.
Much has been written about the abnormal J deflection observed in patients with hypercalcemia.
19Other conditions have been reported to cause an abnormal J deflection, including brain injury,
32subarachnoid hemorrhage,
33damage to sympathetic nerves in the neck,
34,35and cardiopulmonary arrest from oversedation.
36Brugada and Brugada
37reported patients with right bundle-branch block who exhibited non- coronary ST-segment elevation in the right precordial leads and experienced ventricular tachycardia or ventricular fibril- lation. A controversy now surrounds this condition because not all of the tracings show classic right bundle-branch block, and some patients might have arrhythmogenic right ventric- ular dysplasia.
All J-wave deflections do not look alike. Some are merely elevations of ST segments in leads V
1and V
2,
37whereas others are of the spike-and-dome variety.
26This leads to the conclusion that different mechanisms may be responsible for the size and shape of J-wave deflections.
Genesis of the Osborn Wave
Knowing the work of Wilson and Finch
38relating the effect of drinking ice water on T waves of the ECG, I assumed that intense total body hypothermia somehow delayed and slowed depolarization of a portion of the left ventricle. In our patients,
39the mean vector illustrating the Osborn wave was directed to the left and parallel with the frontal plane or slightly anterior. This led to the view that the left anterior portion of the left ventricle was cooled more than other parts of the left ventricle.
In 1996 Yan and Antzelevitch
40wrote
Our results provide the first direct evidence in support of the hypothesis that heterogeneous dis- tribution of a transient outward current-mediated spike-and-dome morphology of the action potential across the ventricular wall underlies the manifes- tation of the electrocardiographic J wave. The presence of a prominent action potential notch in epicardium but not endocardium is shown to pro- vide a voltage gradient that manifests as a J (Osborn) wave or elevated J-point in the ECG.
Epsilon Waves
Epsilon waves are often seen in the ECGs of patients with arrhythmogenic right ventricular dysplasia (Figure 4C).
These waves are best seen in the ST segments of leads V
1and V
2. They may be seen in leads V
1through V
4. The duration of the QRS complex may be a bit longer in leads V
1and V
2than in leads V
5and V
6. Although the small wiggles may be seen in the routine ECG, they may be seen more readily in Fontaine leads. Fontaine described these leads in a letter to me dated September 5, 1997, and reproduced here with slight modifications:
Such leads entail the placement of the right arm electrode (negative) on the manubrium and the left arm electrode (positive) on the xiphoid. This pro- duces a bipolar chest lead. The recording of the epsilon waves may also be enhanced by doubling the sensitivity of the record.
In addition to the electrode placement described above, the placement of the foot lead (positive) in position V
4provides, instead of regular leads I, II, and III, three bipolar chest leads that can be called FI, FII, and FIII. Tracings are then produced by setting the machine on regular leads I, II, and III. This arrange- ment is used to record specifically the potentials developed in the right ventricle, from the infundibu- lum to the diaphragmatic area.
The vertical bipolar lead FI, which is similar to VF,
seems to be the most appropriate to record epsilon
waves; it also magnifies the atrial potentials. It could
be useful in the search for AV dissociation in ven- tricular tachycardia or to study abnormal atrial rhythms when the P waves are too small on regular leads.
Naming the Epsilon Waves
Fontaine named the epsilon waves. His personal account of his discovery was described in his March 5, 1997, letter to me:
. . . after discovering the first cases of late (or delayed) potentials recorded at the time of surgery on the epicardium of patients with resistant ventricular tachycardia. It was quite exciting to demonstrate that these late potentials located on the free wall of the right ventricle of patients with arrhythmogenic right ventricular dysplasia could be recorded on the surface by signal averaging and in some circumstances by increasing the magnification of ECG recording.
As late potentials were supposed to be the result of late activation of a limited group of fibers, the term
“post-excitation” looked logical, since it was ob- served after the main excitation of the ventricle, leading to the QRS complex. The term “epsilon” was nice, because it occurs in the Greek alphabet after delta; thus, delta represents the preexcitation and epsilon the post-excitation phenomenon. In addition, epsilon is also used in mathematics to express a very small phenomenon . . .
Genesis of Epsilon Waves
Epsilon waves are caused by postexcitation of the myocytes in the right ventricle (Figure 4C). The young patient with ventricular tachycardia or syncope and epsilon waves on the ECG usually has arrhythmogenic right ventricular dysplasia.
In this condition, myocytes are replaced with fat, producing islands of the viable myocytes surrounded by fat. This causes a delay in excitation of some of the myocytes of the right ventricle and causes the little wiggles seen during the ST segment of the ECG.
Epsilon waves have also been described in patients with posterior myocardial infarction.
41F.I. Marcus has observed epsilon waves in a patient with sickle cell disease with right ventricular hypertrophy due to pulmonary arterial hypertension (written communication, February 1997). Other diseases of the right ventricle, including right ventricular infarction, infiltration disease, and sarcoidosis, might also produce the pathological substrate required for production of epsilon waves.
Conclusions
Einthoven named the waves in the ECG PQRST and U. Having labeled the uncorrected waves made by the Lippmann capillary electrometer ABCD, Einthoven wanted to show how his mathematically corrected waves differed from uncorrected waves. Therefore, he had to use labels other than ABCD. He chose PQRST because he was undoubtedly familiar with Descartes’ labeling of succes- sive points on a curve. Perhaps as an afterthought, he recognized that by choosing letters near the middle of the
alphabet, he would have other letters to label waves that might be found before the P wave or after the T wave. He later discovered the U wave when he developed the string galvanometer. Why Einthoven mixed the old with the new labeling in the tracing made with the string galvanometer shown in the postage stamp created to honor him is bewildering and unexplained.
Segers, Lequime, and Denolin named the delta wave. They chose delta because 1 side of the slurred part of the QRS complex seems to parallel 1 side of the Greek letter delta.
Clinicians named the spike-and-dome wave caused by hypothermia the Osborn wave in honor of Osborn. More research is needed to determine the mechanisms responsible for the abnormal J deflections that appear in a diverse group of conditions.
Fontaine discovered and named the epsilon waves. He chose the epsilon because it follows delta in the Greek alphabet and is the mathematical symbol for smallness.
Acknowledgments
I wish to thank Dr Howard Burchell, Dr Charles Antzelevitch, Dr Dennis Krikler, Dr Guy Fontaine, and Dr Clyde Partain for their help in the preparation of this manuscript. This dissertation could not have been written without their suggestions, but I wish to emphasize that any errors in the manuscript are mine and not theirs.
References
1. The World Book Encyclopedia. Field Enterprises Inc; 1959:1954.
2. Waller AD. A demonstration on man of electromotive changes accom- panying the heart’s beat. J Physiol. 1887;8:229 –234.
3. Burchell HB. A centennial note on Waller and the first human electro- cardiogram. Am J Cardiol. 1987;59:979 –983.
4. Snellen HA. Willem Einthoven (1860 –1927): Father of Electrocardiog- raphy. Dordrecht, Netherlands: Kluwer Academic Publishers; 1995:
23–27.
5. Einthoven W. Ueber die Form des menschlichen electrocardiogramms.
Arch Gesamte Physiol. 1895;60:101–123.
6. Henson JR. Descartes and the ECG lettering series. J Hist Med Allied Sci.
April 1971;181–186.
7. Snellen HA. Willem Einthoven (1860 –1927): Father of Electrocardi- ography. Dordrecht, Netherlands: Kluwer Academic Publishers;
1995:8 –9.
8. DeWaart A. Het levenswerk van Willem Einthoven, 1860 –1927. Haarlem, Netherlands: Bohn; 1957.
9. Durrer D. Electrical aspects of human cardiac activity: a clinical- physiological approach to excitation and stimulation. Cardiovasc Res.
1968;2:1–18.
10. Sicouri S, Quist M, Antzelevitch C. Evidence for the presence of M cells in the guinea pig ventricle. J Cardiovasc Electrophysiol. 1996;
7:503–511.
11. Wilson FN. A case in which the vagus influenced the form of the ventricular complex of the electrocardiogram. Arch Intern Med. 1915;16:
1008 –1027.
12. Antzelevitch C. The M cell. J Cardiovasc Pharmacol Ther. 1997;2:
73–76.
13. Wedd AM. Paroxysmal tachycardia; with reference to nomotopic tachycardia and the role of the extrinsic cardiac nerves. Arch Intern Med.
1921;27:571–590.
14. Hamburger WW. Bundle-branch block: 4 cases of intraventricular block showing some interesting and unusual clinical features. Med Clin North Am. 1929;13:343–362.
15. Wolff L, Parkinson J, White PD. Bundle-branch block with the short P-R interval in healthy young people prone to paroxysmal tachycardia. Am Heart J. 1930;5:685–704.
16. Wolferth CC, Wood FC. The mechanism of production of short P-R intervals and prolonged QRS complexes in patients with presumably undamaged hearts: hypothesis of an accessory pathway of auricu-
loventricular conduction (bundle of Kent). Am Heart J. 1933;8:
297–311.
17. Segers PM, Lequime J, Denolin H. L’activation ventriculaire pre´coce de certains coeurs hyperexcitables: etude de l’onde Dde l’e´lectrocardio- gramme. Cardiologia. 1944;8:113–167.
18. Kent AFS. A lecture on some problems in cardiac physiology. BMJ.
1914;2:105.
19. Gussak I, Bjerregaard P, Egan TM, Chaitman BR. ECG phenomenon called the J wave: history, pathophysiology, and clinical significance.
J Electrocardiol. 1995;28:49 –58.
20. Mirvis DM. Electrocardiography: A Physiologic Approach. St. Louis, Mo: Mosby-Year Book; 1993.
21. Hurst JW. Abnormalities of the S-T segment, part I. Clin Cardiol. 1997;
20:511–520.
22. Hurst JW. Abnormalities of the S-T segment, part II. Clin Cardiol.
1997;20:595– 600.
23. Abbott JA, Cheitlin MD. The nonspecific camel-hump sign. JAMA.
1976;235:413– 414.
24. Litovsky SH, Antzelevitch C. Rate dependence of action potential duration and refractoriness in canine ventricular endocardium differs from that of epicardium: role of the transient outward current. J Am Coll Cardiol. 1989;14:1053–1066.
25. Hugo N, Dormehl IC, van Gelder AL. A positive wave at the J-point of electrocardiograms of anaesthetized baboons (Papio ursinus). J Med Primatol. 1988;17:347–352.
26. Osborn JJ. Experimental hypothermia: respiratory and blood pH changes in relation to cardiac function. Am J Physiol. 1953;175:389 –398.
27. Tomaszewski W. Changements e´lectrocardiographiques observe´s chez un homme mort de froit. Arch Mal Coeur. 1938;31:525–528.
28. Kossmann CE. General cryotherapy: cardiovascular aspects. Bull N Y Acad Med. 1940;16:317.
29. Grosse-Brockhoff F, Schoedel W. Das bild der akuten unterkuhlung im tierexperiment. Arch Exp Path Pharmakol. 1943;201:417.
30. Bigelow WG, Lindsay WK, Greenwood WF. Hypothermia: its possible role in cardiac surgery: investigation of factors governing survival in dogs at low body temperatures. Ann Surg. 1950;132:849 – 866.
31. Juvenelle A, Lind J, Wegelius C. Quelques possibilitie´s offertes par l’hypothermie ge´ne´rale profonde provoque´e: une e´tude expe´rimentale chez le chien. Presse Med. 1952;60:973–978.
32. Hersch C. Electrocardiographic changes in head injuries. Circulation.
1961;23:853– 860.
33. De Sweit J. Changes simulating hypothermia in the electrocardiogram in subarachnoid hemorrhage. J Electrocardiol. 1972;5:93–95.
34. Hugenholtz PG. Electrocardiographic changes typical for central nervous system disease after right radical neck dissection. Am Heart J. 1967;74:
438 – 441.
35. Yanowitz R, Preston JB, Abildskov JA. Functional distribution of right and left stellate innervation to the ventricles: production of neurogenic electrocardiographic changes by unilateral alteration of sympathetic tone.
Circ Res. 1966;18:426 – 428.
36. Jain U, Wallis DE, Shah K, Blakeman BM, Moran JF. Electrocardio- graphic J waves after resuscitation from cardiac arrest. Chest. 1990;98:
1294 –1296.
37. Brugada P, Brugada J. Right bundle branch block, persistent ST segment elevation and sudden cardiac death: a distinct clinical and electrocardio- graphic syndrome: a multicenter report. J Am Coll Cardiol. 1992;20:
1391–1396.
38. Wilson FN, Finch R. The effect of drinking iced-water upon the form of the T deflection of the electrocardiogram. Heart. 1923;10:275–278.
39. Clements SD Jr, Hurst JW. Diagnostic value of electrocardiographic abnormalities observed in subjects accidentally exposed to cold. Am J Cardiol. 1972;29:729 –734.
40. Yan G-X, Antzelevitch C. Cellular basis for the electrocardiographic J wave. Circulation. 1996;93:372–379.
41. Fontaine G, Guiraudon G, Frank R, Vede K, Grosgogeat Y, Cabrol C, Facquet J. Stimulation studies and epicardial mapping in ventricular tachycardia: study of mechanisms and selection for surgery. In: Kulbertus HE, ed. Re-entrant Arrhythmias: Mechanisms and Treatment. Lancaster, Pa: MTP Publishers; 1977:334 –350.
KEYWORDS: electrocardiography
n
ECG waves, naming ofn
ECG waves,genesis of