HAL Id: hal-03204350
https://hal.archives-ouvertes.fr/hal-03204350
Submitted on 22 Apr 2021
HAL is a multi-disciplinary open access
archive for the deposit and dissemination of
sci-entific research documents, whether they are
pub-lished or not. The documents may come from
teaching and research institutions in France or
abroad, or from public or private research centers.
L’archive ouverte pluridisciplinaire HAL, est
destinée au dépôt et à la diffusion de documents
scientifiques de niveau recherche, publiés ou non,
émanant des établissements d’enseignement et de
recherche français ou étrangers, des laboratoires
publics ou privés.
Distributed under a Creative Commons Attribution| 4.0 International License
viperfish Chauliodus sloani reveal a key mesopelagic
player
Leandro Nolé Eduardo, Flávia Lucena-Frédou, Michael Maia Mincarone,
Andrey Soares, François Le Loc’h, Frédéric Ménard, Thierry Frédou, Arnaud
Bertrand
To cite this version:
Leandro Nolé Eduardo, Flávia Lucena-Frédou, Michael Maia Mincarone, Andrey Soares, François
Le Loc’h, et al.. Trophic ecology, habitat, and migratory behaviour of the viperfish Chauliodus
sloani reveal a key mesopelagic player. Scientific Reports, Nature Publishing Group, 2020, 10 (1),
�10.1038/s41598-020-77222-8�. �hal-03204350�
Trophic ecology, habitat,
and migratory behaviour
of the viperfish Chauliodus sloani
reveal a key mesopelagic player
Leandro Nolé Eduardo
1,2*, Flávia Lucena‑Frédou
1, Michael Maia Mincarone
3,
Andrey Soares
1, François Le Loc’h
4, Thierry Frédou
1, Frédéric Ménard
5& Arnaud Bertrand
1,2,6 Mesopelagic fishes are numerically the most important vertebrate group of all world’s oceans. While these species are increasingly threatened by anthropogenic activities, basic biological knowledge is still lacking. For instance, major uncertainties remain on the behaviour, ecology, and thus functional roles of mesopelagic micronektivores, particularly regarding their interactions with physicochemical features. Here, we examine the trophic ecology, habitat, and migratory behaviour of the viperfish (Chauliodus sloani)—a poorly known and abundant deep‑sea species—to further understand the ecology and thus functional role of mesopelagic micronektivores. Moreover, we explore how physical drivers may affect these features and how these relationships are likely to change over large oceanic areas. The viperfish heavily preys on epipelagic migrant species, especially myctophids, and presents spatial and trophic ontogenetic shifts. Temperature restricts its vertical distribution. Therefore, its trophodynamics, migratory behaviour, and functional roles are expected to be modulated by the latitudinal change in temperature. For instance, in most tropical regions the viperfish stay full‑time feeding, excreting, and serving as prey (e.g. for bathypelagic predators) at deep layers. On the contrary, in temperate regions, the viperfish ascend to superficial waters where they trophically interact with epipelagic predators and may release carbon where its remineralization is the greatest.Mesopelagic fishes (200–1000 m depth) are numerically the most important vertebrate group of the world’s oceans1, usually presenting global distribution2,3, high biodiversity4, and several adaptations to overcome
chal-lenges imposed by the deep-sea4. Most of these species vertically migrate to the surface to feed at night and
actively transport the ingested carbon to deep waters during daylight5, a pathway enhancing the oceanic carbon
storage and thus global carbon cycles6–8. Moreover, they are an important trophic link for the maintenance of
harvestable fish stocks9–11 and the connection between shallow and deep-sea ecosystems12. However, while there
is a major lack of knowledge regarding their global composition, ecology, and ecosystem functions13–15, these
species are increasingly threatened by anthropogenic activities. For instance, effects of climatic change16,17,
plas-tic pollution18, and exploitation of deep-sea resources15,19 stand to alter the structure and function of deep-sea
ecosystems. Therefore, as threats to the diversity and stability increase, the understanding of mesopelagic ecosys-tems, their processes, and functions is mandatory, especially when sustainability is intended to be achieved15,20.
Although research on mesopelagic species has considerably advanced over the past few years3,5,20–24, most
works focused on zooplanktivorous groups (e.g. myctophids, sternoptychids), while less attention has been paid to micronektivores (e.g. stomiids) that occupy higher trophic levels25. Given their high abundance26,
deep migrations26,27, great body mass4, and high predation on migrant zooplanktivorous fishes23, mesopelagic
micronektivores are a crucial component of deep-sea systems that hitherto has been overlooked. Indeed, the trophic ecology, migratory behaviour, and environmental interactions of mesopelagic micronektivores remains poorly known worldwide and unexplored in most oceanic areas13,15,25. It is therefore not clear how physical drivers
(e.g. temperature, oxygen) structure these communities and how these relationships are likely to change in the
OPEN
1Departamento de Pesca e Aquicultura, Universidade Federal Rural de Pernambuco, Recife, PE, Brazil. 2Institut de
Recherche Pour le Développement (IRD), MARBEC, Univ. Montpellier, CNRS, Ifremer, IRD, Sète, France. 3Instituto
de Biodiversidade e Sustentabilidade, Universidade Federal do Rio de Janeiro, Caixa Postal 119331, Macaé, RJ 27910-970, Brazil. 4IRD, Univ. Brest, CNRS, Ifremer, LEMAR, IUEM, 29280 Plouzane, France. 5Aix Marseille Univ.,
Université de Toulon, CNRS, UM110 Marseille, IRD, MIO, France. 6Departamento de Oceanografia, Universidade
space and time. Additionally, most of the previous studies addressing the trophodynamics of micronektivores do not include their predators and/or were based solely on stomach contents25,27,28, while further approaches
(e.g. stable isotopes, fatty acids, genetics) are required to provide a comprehensive picture of energy flows across trophic compartments20. Clarification of the ecology, vertical behaviour and trophic relationships of
micronek-tivores should provide key knowledge on mesopelagic communities and systems13–15. Moreover, it may help to
understand how these species might respond under climatic changes16 and what consequences it may have for
their functional role and thus ecosystems health.
In this context, here we examine the habitat, trophic ecology, and vertical migration of the viperfish
Chaulio-dus sloani (Stomiiformes: Stomiidae)—a poorly known and abundant deep-sea species29,30—to further understand
the ecology and thus functional role of mesopelagic micronektivores. For that, we combine several approaches and take advantage of a multidisciplinary deep-sea survey around oceanic islands and seamounts in the west-ern Tropical Atlantic. First, we assess the trophic ecology of the viperfish by coupling stomach content analyses with an extensive stable isotopic data (carbon and nitrogen) of its main probable trophic links, including zoo-plankton, crustaceans, fish larvae, zooplanktivorous fish, and epipelagic and bathypelagic potential predators. Second, we assess viperfish migratory behaviour by using novel information on its abundance, distribution, and physicochemical characteristics of its habitat (temperature and oxygen). Additionally, we combine our results with previous studies to construct a conceptual model, examining how temperature might influence trophic ecology and vertical movements of the viperfish and thus how latitudinal changes in sea temperature can affect its potential contribution to carbon sequestration.
Materials and methods
Specimens and data collection.
Specimens and data collection are described as follows in20,31. Data werecollected off northeastern Brazil (Fernando de Noronha Ridge) during the Acoustics along the BRAzilian COaSt 2 (ABRACOS2) survey, carried out from 9th April to 6th May 2017, onboard the French RV Antea. Sampling of mesopelagic fishes, crustaceans and gelatinous organisms was conducted during day and night at 33 stations by
using a micronekton trawl (body mesh: 40 mm, cod-end mesh: 10 mm) from 10 to 1,113 m (Fig. 1, Suppl.
Mate-rial 1). Targeted depth was defined for each tow according to the presence of acoustic scattered layer or patches as observed using a Simrad EK60 (Kongsberg Simrad AS) split-beam scientific echosounder, operating at 38, 70, 120 and 200 kHz. Each trawl was performed for about 30 min at 2–3 kt. Tow duration was considered from the moment of the arrival of the net on the pre-set depth to the lift-off time, recorded utilizing a SCANMAR system. The net geometry has also been monitored using SCANMAR sensors, to give headline height, depth, and distance of wings and doors to ensure the net was fishing correctly. As the trawl was not fitted with opening or closing mechanism, the collection of specimens during the lowering or hoisting of the net was reduced as much as possible by decreasing ship velocity and increasing winch speed.
Temperature, salinity, oxygen, and fluorescence profiles were collected using a CTDO (model: SeaBird911 + ;
Fig. 1). Particulate organic matter (POM) was sampled at 22 stations by filtering seawater from the maximum
fluorescence depth (~ 80 m depth) through GF/F filters (47 mm), followed by a dry proceeding of 36 h (40 °C)32.
Zooplankton samples were collected using bongo nets (four nets fitted with 64, 120, 300, and 500 µm mesh sizes) that were towed from 200 m depth up to the surface at 22 stations. Additional epipelagic sampling, targeting top predators, was performed aboard a sportfishing boat around the Fernando de Noronha Archipelago using hook and line.
Captured organisms were fixed in a 4% formalin solution for one month and then preserved in a 70% alcohol solution. At the laboratory, individuals were identified to the lowest taxonomic level, measured (nearest 0.1 cm of standard length, SL) and weighed (nearest 0.01 g of total weight, TW). Voucher specimens were deposited in the NPM – Fish Collection of the “Instituto de Biodiversidade e Sustentabilidade, Universidade Federal do Rio de Janeiro” (UFRJ). The authors confirm that all methods were approved and carried out in accordance with relevant guidelines and regulations of the Brazilian Ministry of Environment (SISBIO; authorization number: 47270–5).
Vertical distribution, habitat, and migration.
Viperfish vertical behaviour was characterised by using data on diel vertical distribution of abundance, size distribution, and physicochemical habitat. The relative index of abundance (Catch Per Unit of Effort—CPUE) was calculated considering the number and weight ofspeci-mens captured per hour, standardized to a similar net-mouth area of 120 m2 (estimated through SCANMAR
sensors). These values, as well as the mean length and weight of specimens, were considered according to the diel period (day/night), and depth strata (10–1000 m, intervals of 100 m). Day was considered to extend from one hour after sunrise to one hour before sunset, while the night was from one hour after sunset to one hour before sunrise. Dawn or dusk samples were discarded when studying day/night vertical distributions. Except for the layers 200–300 and 700–800 at night, where no aggregation of organism was observed through acoustics,
all depth strata were sampled at least once (Suppl. Material 1). A two-way ANOVA was performed33 to
deter-mine significant differences in SL and TW between period of the day and depth strata, following the necessary assumptions of normality (Kolmogorov–Smirnov test) and homoscedasticity (Levene’s test). Distribution pat-tern of specimens concerning their environment was analysed by combing data on vertical distributions and mean profiles of temperature and oxygen.
Trophic ecology.
Gut Content (GCA) and carbon and nitrogen Stable Isotopes Analyses (SIA) were imple-mented to assess the trophic ecology of the viperfish. Both analyses were performed considering three size classes (< 15 cm; > 15 cm; and pooled sizes), based on the viperfish size at sexual maturity (L50:15 cm)34. Additionally, weincluded stable isotopic data on potential viperfish predators to infer whether this species is being consumed by epipelagic and/or bathypelagic species. Based on data availability, local fauna, and literature information10,12,35,36,
the following species were considered as potential predators and thus included in the analyses: Ectreposebastes
imus, Sphyraena barracuda, Coryphaena hippurus, Elagatis bipinnulata, Acanthocybium solandri, Katsuwonus pelamis, and Thunnus albacares.
For GCA, each specimen had the stomach extracted and subsequently dissected under the stereoscope for content removal. Contents found in the mouth, oesophagus, and intestines were not considered in this study. Wherever possible, prey-size measurements to the nearest 0.1 mm were carried out with a binocular stereo-scope using an ocular micrometric scale. Standard length for fishes; back of eye socket to tip of telson length (excluding terminal spines) for decapods; and tip of rostrum to tip of telson length (excluding terminal spines) for euphausiids were measured.
The vacuity index (VI, %) was calculated as follows: VI = Nv/Ne × 100, where Nv is the number of empty stomachs and Ne the total number of examined stomachs. Vacuity index was calculated for day, night, and both periods together. Dietary indexes for coupled stomachs were calculated to assess the importance of each prey item in viperfish diet: frequency of occurrence (%FO), numerical abundance (%N) and weight percentage (%W)27. Additionally, to estimate the niche breadth of viperfish, the Levin’s standardized index was calculated
as follows: BJ = 1 n−1( 1 p2 ij
− 1) , where Bj is the Levin’s standardized index for the viperfish, whereas pi2j is the proportion in weight of prey i in the diet of predator j and n is the number of prey categories. This index varies from 0 (species that feed on only one item) to 1 (species that feed on the same proportion of all evaluated items)37.
Size-related differences were evaluated by comparing size classes through the non-parametric permutation pro-cedure ANOSIM (Analysis of Similarity).
SIA were conducted on viperfish and its most probable prey and predator groups, including two fish larvae groups (Teleostei larvae 5–10 mm and Teleostei larvae 15–20 mm); five crustaceans; five gelatinous (divided into Siphonophorae and Thaliacea); eight zooplanktivorous fishes; and seven potential predators of viperfish (Table 2). Samples of Particulate Organic Matter (POM) were also included. For each fish and crustacean, white muscular tissue was extracted and cleaned with distilled water to remove exogenous material such as carapace, scales, and bones. Gelatinous organisms were used in whole. Entire zooplankton samples have been stored in Eppendorf micro tubes. Samples were dried in an oven at 60 °C for 48 h and grounded into a fine powder with a mortar and pestle. To obtain unbiased values of carbon stable isotope composition due to carbonates, zoo-plankton and POM samples were split in two subsamples. One zoozoo-plankton sub-sample was acidified by adding approximately 2 ml of 0.5 mol l−1 hydrochloric acid (HCl)32,38. POM sub-samples were exposed to hydrochloric
acid (HCl) vapour. After 4 h, the filters and zooplankton were dried at 40 °C for 36 h. Untreated sub-samples of POM and zooplankton were analysed for nitrogen stable isotope composition and acidified one for carbon stable isotope composition. Each sample was analysed for carbon and nitrogen stable isotope ratios through a mass spectrometer (Thermo Delta V +) coupled to an element analyser (Thermo Flash 2000, interface Thermo
ConFio IV) in the Platform Spectrometry Ocean (PSO, IUEM, France). SIA results for carbon (δ13C) and
nitro-gen (δ15N) were derived from the relation of the isotopic composition from the sample and a known standard:
δ13C or δ15N = [(Rsample/Rstandard) – 1] × 103; in which R corresponds to the ratio between 13C:12C or 15N:14N.
As differential lipid contents can bias the interpretation of δ13C values, here we explored the potential lipid bias
by using C:N ratios by mass and the relationship between C:N (i.e., lipid content) and δ13C. As samples were
not treated to remove lipids before analysis to prevent loss of material, the few prey groups that exhibited C:N
Figure 1. Study area (Fernando de Noronha Ridge) with CTD, bongo, and micronekton-trawl sampling
dynamics consistent with high lipid content (C:N > 3.5) were normalized using the equation for aquatic animals31:
∆δ13C = − 3.32 + 0.99 × C:N, where ∆δ13C is the change in δ13C caused by lipids and C:N is the carbon-to-nitrogen
ratio (by mass) of the sample. To investigate the relationship between viperfish and potential prey and predators, isotopic values of carbon and nitrogen were analysed through a bi-dimensional plot. Further, viperfish trophic position (TP) was determined using the following formulae39:
where δ15N
consumer and δ15Nbaseline are the δ15N values of the target consumer and the baseline respectively; TDF is
the trophic discrimination factor and TPbaseline is the trophic position of the baseline. As POM may be influenced
by the co-occurrence of detritus40 and microzooplankton in the water column32, primary consumers (TP2) are
usually a better isotopic baseline to assess TP. Following the methodology of previous studies on the trophic position of mesopelagic, the baseline utilized was the zooplankton size fraction between 200–500 µm, which were
mainly composed of herbivores copepods32 that act as primary consumers (TP2). To account for uncertainty
associated with the index, a Bayesian model was incorporated in the calculation of TP using predict δ15N values
of the viperfish and a TDF of 3.15‰ ± 1.28‰41. The R package tRophicPosition42 was run for isotopic trophic
posi-tion calculaposi-tions. To explore how trophic levels and carbon source might change across ontogenetic phases, the relationship between fish size and δ13C and δ15N were assessed through a least-squares linear regression analysis.
The bayesian mixing model, MixSIAR43, provide the most accurate estimations of source or prey
contribu-tions when tissue and species-specific discrimination factors are used44. Using the R package “SIBER”45, we
applied mixing models to estimate the relative contribution of viperfish specific-prey utilization. To explore the relationships between source contribution and size, we performed three mixing models considering all size classes. Potential dietary endpoints applicable to viperfish included in mixing models were derived from stom-ach contents analyses, local fauna (e.g. the most abundant species of myctophids were selected), and published information27,28,46. The following prey species were included: i) Euphausia gibboides (Euphausiacea), ii) Diaphus
brachycephalus (Myctophidae), iii) Diaphus fragilis (Myctophidae), iv) Diaphus mollis (Myctophidae), v) Hygo-phum taaningi (Myctophidae), vi) Lampanyctus nobilis (Myctophidae), vii) Lepidophanes guentheri
(Myctophi-dae), viii) Symbolophorus rufinus (Myctophi(Myctophi-dae), ix) Promethichthys prometheus (Gempylidae).
Results
Oceanographic conditions.
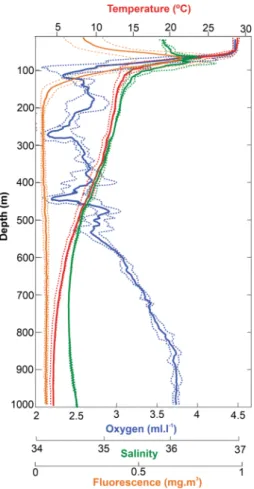
Mean hydrological profiles (Fig. 2) revealed the presence of a surface mixed layer, characterized by warm waters (28 °C), extending down to ~ 50 m. Below, a sharp thermocline extended from the lower limit of the mixed layer to 130 m with a thermal difference of 12.3 °C. Vertical profile of salinity showed a layer of saline water within the thermocline, between 80 and 120 m. Dissolved oxygen concentration was homogeneous at the mixing layer, decreased at the upper limit of the thermocline with values less than 2.5 ml l−1 at ~ 100 m, ~ 300 m, and ~ 450 m and then increased at depths higher than 550 m. The chlorophyll afluorescence maximum was generally located at the upper limit of the thermocline.
Vertical distribution, habitat, and migration.
A total of 304 specimens of viperfish was collected and utilized to investigate vertical habitat and behaviour. The mean and standard deviation of the relative index of abundance were 62.3 ± 87.2 ind.hour−1 (0.62 ± 0.86 kg.hour−1), ranging from 2.6 ind.hour−1 (0.03 kg.hour−1) to340 ind.hour−1 (3.37 kg.hour−1). Vertically, viperfish were captured only between 400 to 1000 m, showing
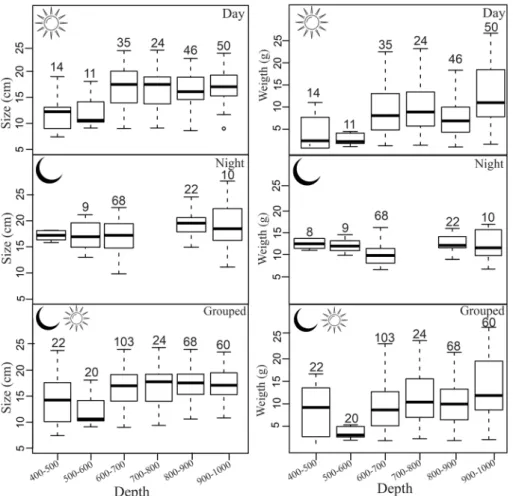
abun-dance peaks at 700–900 m (daytime) and 600–700 m (night-time). Both day and night specimens were found between 400 and 1000 m (Fig. 3), suggesting that only part of the population performs diel vertical migration. Additionally, size and weight varied significantly (p = 0.02) with the diel period and depth strata, indicating a possible ontogenetic shift on distribution and vertical migration pattern. At daytime, size distribution was heterogeneous among depth layers with larger organisms distributed below 500 m (difference of ± 5 cm/5 g). At night, however, larger individuals seem to migrate upwards, resulting in a more homogeneous size distribution (difference of ± 1 cm/2 g) according to depth layers. Coupling both periods, larger and heavier individuals were found at depths below 500 m (Fig. 4, Suppl. Material 3). Chauliodus sloani was captured in temperature ranging from 5 to 12 °C, well below the thermocline zone. Considering dissolved oxygen, the species was caught between 2.5 ml l−1 and 3.8 ml l−1 (Fig. 3).
Trophic ecology.
One hundred and ninety-seven individuals (7–25 cm SL) were dissected for investigation on the viperfish carbon source through GCA. From that, 76 (39%) had stomachs with content and were utilized for further analyses. The vacuity index was 72% for daytime, 50% for night, and 61% for pooled periods. Consid-ering all size classes, C. sloani feds largely on myctophids of the genus Diaphus (23% by weight, noted hereafter 23%W; 10–30 mm SL) and unidentified myctophids (36%W; 20–36 mm). Unidentified Teleostei (which may also include myctophids) was likewise important (31%W; 11–38 mm), followed by a few specimens ofHygo-phum sp. (3.4%W), C. sloani (2.4%W; 38 mm), Cyclotone spp. (1.5%W; 27 mm), Gempylidae (0.3%W; 35 mm)
and Euphausiidae (0.2%W; 26 mm) (Table 1). No crustaceans were found in stomachs of individuals larger than
15 cm. The low value of Levins standardized index (< 15 cm: 0.22; > 15 cm: 0.30; Pooled Sizes: 0.17) indicated a restricted niche breadth for all size classes, highlighting the strong piscivorous habit of this species. Overall, lager individuals presented a higher niche breadth.
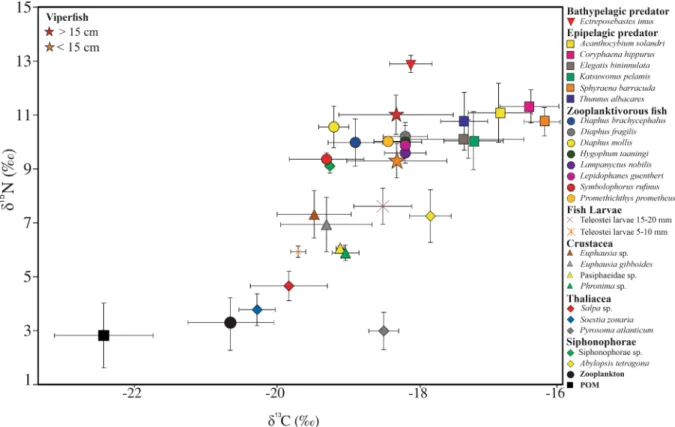
Considering stable isotope analyses, 26 taxa were utilized to assess viperfish trophic ecology (Table 2). Overall, the mixing models and biplot analyses were consistent with GCA, suggesting a tight trophic interaction with fishes, especially myctophids (e.g. Diaphus brachycephalus and Symbolophorus rufinus) (Figs. 5 and 6). Moreover, the mixing model for all size classes revealed a higher isotopic contribution of euphausiids that could not be
TP = δ15
observed in GCA (Fig. 5). Mean δ15N values (< 15 cm = 9.3 ± 0.6‰; > 15 cm = 11.1 ± 0.7‰) and trophic levels (TP
sia: < 15 cm = 3.9 ± 0.1; > 15 cm = 4.3 ± 0.1; grouped = 4.1 ± 0.11) were significantly different among ontogenetic phases. Considering δ13C values (< 15 cm = − 18.3 ± 0.2‰; > 15 cm = − 18.3 ± 0.1‰), no significant differences
were observed among ontogenetic phases (Suppl. Material 2; Table 2; p < 0.05). The consistency in carbon and nitrogen values between the viperfish and the bathypelagic predator Ectreposebastes imus indicate a likely tight trophic linkage between them. The difference in δ13C isotopic values between the viperfish and epipelagic
preda-tors, however, does not indicate that viperfish could significantly contribute to their feeding regime.
Figure 2. Mean and standard deviation of vertical profiles of temperature (red), dissolved oxygen (blue),
salinity (green), and fluorescence (orange) in the study area during the survey.
Figure 3. Average relative abundance in individuals.hour−1 (A) and kilogram.hour−1 (B) per depth strata and
day period of the viperfish Chauliodus sloani. Coloured lines represent the average vertical profile of dissolved oxygen (blue) and temperature (red) for both day and night times. Red numbers represent the number of trawls per depth strata and period of the day.
Figure 4. Boxplot of standard length and total weight per size classes and period of the day for the viperfish
Chauliodus sloani. The depth layer 700–800 m was not sampled at night. Black horizontal lines and boxes
represent median values and interquartile ranges, respectively. Dashed lines represent the data range limits. Numbers above the boxes represent the quantity of specimens per depth strata.
Table 1. Diet composition of viperfish Chauliodus sloani utilized in gut content analyses and dietary indexes
calculated for each prey item: abundance percentage (%N), weight percentage (%W), frequency of occurrence (%F), number of specimens analysed (N), number of stomachs with content (NSC), vacuity index (%VI), vacuity index day (%VD), vacuity index night (%VN) and niche breadth (Bj).
Prey item
Grouped Sizes Size class: 7–15 cm Size class: 15–25 cm N:197; NSC:76; Bj:0.17 N:55; NSC:16; Bj:0.22% N:142; NSC:60; Bj:0.30
%VI:61; %VD: 72; %VN:50 VI:71; %VD78; %VN:58 %VI:58; %VD:68; %VN:49
Group Taxa %FO %N %W %FO %N %W %FO %N %W
Crustaceans Euphausidae 1.3 3.1 0.2 7.1 11.1 2.51 - - -Decapoda 1.3 0 0.1 7.1 11.1 1.7 - - -Fish Chauliodus sloani 1.3 3.1 2.4 7.1 11.1 29.3 - - -Cyclotone spp. 1.3 3.1 1.5 - - - 2.7 4.3 2.1 Gempylidae 1.3 3.1 0.7 - - - 2.7 4.3 1.0 Diaphus sp. 2.6 6.2 23.4 - - - 5.4 8.7 33.2 Hygophum sp. 1.3 3.1 3.4 - - - 2.7 4.3 4.8 Myctophidae 15.7 28.1 36.2 7.1 11.1 1.5 24.0 39.1 33.2 Unidentified Teleostei 39.4 50.0 31.8 71.4 55.5 64.7 49.0 39.1 25.5
Discussion
Here we analysed the habitat, vertical migration, and trophic ecology of the viperfish Chauliodus sloani to further understand the ecology and thus functional role of mesopelagic micronektivores. Among others, we combine our results with previous studies and examine through a conceptual model how latitudinal change in physico-chemical conditions can modulate the viperfish’s behaviour. For instance, we show that physical drivers are regulating both patterns of movements and trophic interactions of this species, with possible consequences for ecological processes as energy transfer among vertical oceanic layers. Moreover, we address some of the potential contribution of this species to the oceanic carbon storage. Finally, for the first time we describe the ecology of a mesopelagic micronektivore along the western Tropical Atlantic (WTA), providing further information on an important and poorly known deep-sea species.
Methodological constrains.
Some considerations should be made before the interpretation of our results. First, although we took precautions to avoid the collection of specimens during the lowering or hoisting of the net (see methodology), our gear did not have an opening or closing mechanism, allowing the collection of some species during these processes. Moreover, our samples were focused on mesopelagic waters and distribution patterns at layers deeper than 1000 m could not be assessed. Therefore, here we focused on major patterns of vertical behaviour on epipelagic and mesopelagic waters (0–1000 m depth), avoiding precise delimitations of vertical distribution and standing stock calculations. Second, diet determination from isotopic mixing models is closely related to the trophic discrimination factor (TDF) and sources utilized to run the analysis47. Hence,despite we carefully selected TDF values and prey groups (see methodology), the inclusion of different prey may provide further insights on the viperfish’s trophodynamics47,48. Overall, the results presented here are not
intended to exhaustively describe the ecological aspects of the viperfish. Instead, they increase the understand-ing of an important and understudied species, as well as provide novel insights on several aspects of its ecology.
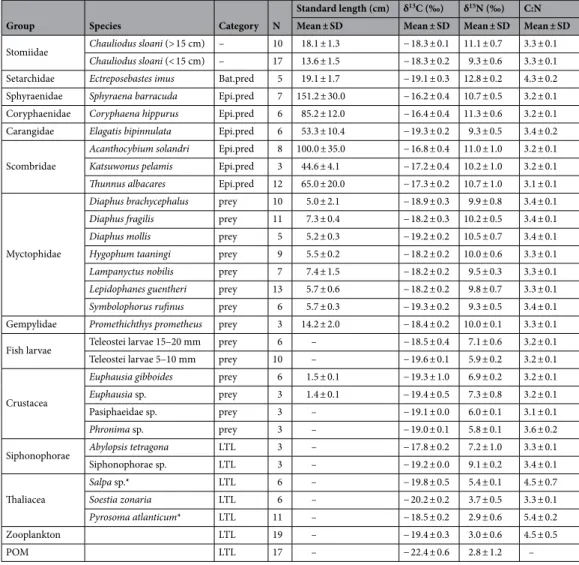
Table 2. Number of samples, standard length, and isotopes values of the viperfish Chauliodus sloani and its
potential predators (Bat.pred–bathypelagic predator; Epi.pred–epipelagic predator), potential prey, and lower trophic levels (LTL). *Species corrected for lipid.
Group Species Category N
Standard length (cm) δ13C (‰) δ15N (‰) C:N
Mean ± SD Mean ± SD Mean ± SD Mean ± SD
Stomiidae Chauliodus sloani (> 15 cm) – 10 18.1 ± 1.3 − 18.3 ± 0.1 11.1 ± 0.7 3.3 ± 0.1
Chauliodus sloani (< 15 cm) – 17 13.6 ± 1.5 − 18.3 ± 0.2 9.3 ± 0.6 3.3 ± 0.1
Setarchidae Ectreposebastes imus Bat.pred 5 19.1 ± 1.7 − 19.1 ± 0.3 12.8 ± 0.2 4.3 ± 0.2
Sphyraenidae Sphyraena barracuda Epi.pred 7 151.2 ± 30.0 − 16.2 ± 0.4 10.7 ± 0.5 3.2 ± 0.1
Coryphaenidae Coryphaena hippurus Epi.pred 6 85.2 ± 12.0 − 16.4 ± 0.4 11.3 ± 0.6 3.2 ± 0.1
Carangidae Elagatis bipinnulata Epi.pred 6 53.3 ± 10.4 − 19.3 ± 0.2 9.3 ± 0.5 3.4 ± 0.2
Scombridae
Acanthocybium solandri Epi.pred 8 100.0 ± 35.0 − 16.8 ± 0.4 11.0 ± 1.0 3.2 ± 0.1
Katsuwonus pelamis Epi.pred 3 44.6 ± 4.1 − 17.2 ± 0.4 10.2 ± 1.0 3.2 ± 0.1
Thunnus albacares Epi.pred 12 65.0 ± 20.0 − 17.3 ± 0.2 10.7 ± 1.0 3.1 ± 0.1
Myctophidae
Diaphus brachycephalus prey 10 5.0 ± 2.1 − 18.9 ± 0.3 9.9 ± 0.8 3.4 ± 0.1
Diaphus fragilis prey 11 7.3 ± 0.4 − 18.2 ± 0.3 10.2 ± 0.5 3.4 ± 0.1
Diaphus mollis prey 5 5.2 ± 0.3 − 19.2 ± 0.2 10.5 ± 0.7 3.4 ± 0.1
Hygophum taaningi prey 9 5.5 ± 0.2 − 18.2 ± 0.2 10.0 ± 0.6 3.3 ± 0.1
Lampanyctus nobilis prey 7 7.4 ± 1.5 − 18.2 ± 0.2 9.5 ± 0.3 3.3 ± 0.1
Lepidophanes guentheri prey 13 5.7 ± 0.6 − 18.2 ± 0.2 9.8 ± 0.7 3.3 ± 0.1
Symbolophorus rufinus prey 6 5.7 ± 0.3 − 19.3 ± 0.2 9.3 ± 0.5 3.4 ± 0.1
Gempylidae Promethichthys prometheus prey 3 14.2 ± 2.0 − 18.4 ± 0.2 10.0 ± 0.1 3.3 ± 0.1
Fish larvae Teleostei larvae 15–20 mm prey 6 – − 18.5 ± 0.4 7.1 ± 0.6 3.2 ± 0.1
Teleostei larvae 5–10 mm prey 10 – − 19.6 ± 0.1 5.9 ± 0.2 3.2 ± 0.1
Crustacea
Euphausia gibboides prey 6 1.5 ± 0.1 − 19.3 ± 1.0 6.9 ± 0.2 3.2 ± 0.1
Euphausia sp. prey 3 1.4 ± 0.1 − 19.4 ± 0.5 7.3 ± 0.8 3.2 ± 0.1
Pasiphaeidae sp. prey 3 – − 19.1 ± 0.0 6.0 ± 0.1 3.1 ± 0.1
Phronima sp. prey 3 – − 19.0 ± 0.1 5.8 ± 0.1 3.6 ± 0.2
Siphonophorae Abylopsis tetragona LTL 3 – − 17.8 ± 0.2 7.2 ± 1.0 3.3 ± 0.1
Siphonophorae sp. LTL 3 – − 19.2 ± 0.0 9.1 ± 0.2 3.4 ± 0.1 Thaliacea Salpa sp.* LTL 6 – − 19.8 ± 0.5 5.4 ± 0.1 4.5 ± 0.7 Soestia zonaria LTL 6 – − 20.2 ± 0.2 3.7 ± 0.5 3.3 ± 0.1 Pyrosoma atlanticum* LTL 11 – − 18.5 ± 0.2 2.9 ± 0.6 5.4 ± 0.2 Zooplankton LTL 19 – − 19.4 ± 0.3 3.0 ± 0.6 4.5 ± 0.5 POM LTL 17 – − 22.4 ± 0.6 2.8 ± 1.2 –
Vertical distribution, habitat, and migration.
Based on our data, in the WTA, the viperfish is the most important mesopelagic species in terms of biomass and fifth more abundant (4% of the total; L. N. Eduardo, unpublished data). Indeed, Chauliodus sloani represented 13% of the total biomass collected, followed byBoros-Figure 5. Stable carbon and nitrogen isotope values of particulate organic matter (POM), the viperfish
Chauliodus sloani and its potential predators, potential preys, and lower trophic levels.
Figure 6. Estimated contribution in % (numbers; mean ± SD) based on stable isotope mixing model of potential
tomias sp. (10%), Sternoptyx diaphana (5%), Melamphaes polylepis (5%), and Argyropelecus affinis (4%)(L. N.
Eduardo, unpublished data). The viperfish inhabits depth layers below 400 m, i.e. at temperatures lower than 12 °C and oxygen levels between 2.3 and 3.7 ml l−1. In mesopelagic waters, the abundance of this species peaked
at 700–900 m at daytime and 600–700 m at night, indicating a pattern of restricted vertical migration where part of the population seems to migrate upwards at night. Moreover, we evidenced ontogenetic spatial variations (e.g. larger and heavier individuals distributed deeper, below 500 m) and asynchronous patterns of migration, where the entire population does not respond synchronously to diel variation in light intensity (segregating by depth and/or size).
This vertical ascension and size segregation have been previously reported in sub-tropical and temperate zones (Table 3). Interestingly, at all these locations, viperfish has been recorded in epipelagic waters, which was not the case in our data. Oxygen levels and temperature are two oceanic features known to constrict the vertical distribution of mesopelagic fish species5,49,50. The viperfish is known to occupy suboxic waters (e.g. 1.0 ml l−1)27,
seemingly to support much lower oxygen levels than those reported here. Therefore, vertical distribution dif-ferences among oceanic regions may be caused by the warmer epipelagic waters of tropical regions that may be preventing the ascension of this species up to shallow layers. Indeed, by coupling our data with previously information we observe that, independently of the depth, the upper thermal limit of the viperfish ranges from 12° to 15 °C (Table 3). Hence, it is likely that temperature may be shaping the migration patterns of this species. While viperfish ascend to epipelagic waters in sub-tropical and temperate regions, in tropical areas it seems to remain at greater depths. One exception is the record of this species in the superficial tropical waters of Somalia27.
However, this region is affected by seasonal monsoon conditions and has a strong upwelling, which leads to the cooling of epipelagic waters51. This exception reinforces our hypothesis that temperature may be ruling the
epipelagic rise of the viperfish.
Trophic ecology.
Differences on the vertical distribution along tropical and temperate regions seems also to reflect in the trophic links of the viperfish. While C. sloani represents one of the most important prey items of epipelagic predators in several locations10,35,36,52, previous studies addressing the trophic ecology of epipelagicpredators along the WTA do not mention a trophic relationship with the viperfish9,53. Moreover, SIA results
do not evidence a well-defined trophic relationship between the viperfish and potential epipelagic predators. It might reflect the low probabilities of predator–prey encounters, as viperfish and epipelagic predators may not be sharing the same vertical space. On the contrary, the isotopic compositions of the viperfish and the bathypelagic predator Ectreposebastes imus are well-matched. The trophic link between bathypelagic predator and the viper-fish has been also noted worldwide54–56.
Based on its prey, the viperfish is a predator with a restricted niche breadth that heavily feeds on zooplank-tivorous fishes, especially myctophids (at least 50% of prey items). This is supported by the mixing models, which show a potentially high contribution of Myctophidae, especially Diaphus brachycephalus and Symbolophorus
rufinus (Fig. 6). This high contribution of myctophids has been also reported in the Central Mediterranean Sea28,
Pacific Ocean57, Arabian Sea27, North Atlantic Ocean58, and Indian Ocean59. Euphausiids were also found as a
prey item, both here and in previous studies57, but in a lesser extension. Larger individuals (> 15 cm; TP
sia: 4.3)
fed on larger prey and were more enriched in 15N than small specimens (< 15 cm; TP
sia: 3.9), reflecting possible
ontogenetic trophic shifts and differences on the prey-size consumption.
Overall, considering previous studies and our data, we conclude that myctophids are the most important prey item of the viperfish, followed by few other Teleostei species (e.g. Gempylidae sp., Cyclotone spp.), and euphausiids. Following the diel vertical behaviour of zooplankton, most myctophids (including main viperfish prey, e.g. D. brachycephalus and Hygophum spp.) forage in epipelagic zones at night and vertically migrate and form high-density biological layers in deeper waters in search of predator refuge during daytime12,60–62. Indeed,
species of Myctophidae are amongst the most important epipelagic zooplankton consumers, feeding up to 30% of their daily stocks61,62. Likewise, most of the euphausiids species undergo diel vertical migrations, where they
move upwards at night, usually in the layer of maximum chlorophyll concentration, seeking a high density of prey63,64. We thus deduce that most viperfish prey are epipelagic migrants that forage on surface waters.
Potential contribution for the Biological Carbon Pump.
The Biological Carbon Pump (BCP) is the active and passive transport of particulate organic carbon produced in the ocean surface by photosynthesis toTable 3. List of previous records of the viperfish Chauliodus sloani, including the location of occurrence,
climatic zone, epipelagic record, depth, and temperature range.
Location Climatic zone Epipelagic record Depth range (m) Temperature range (°C) References
Western Tropical Atlantic Tropical No 400–1000 5–12 This study
South Pacific (Tasmania) Temperate Yes 100–900 5–13 74–76
Northeastern Atlantic Temperate Yes 100–600 10–12 77,78
Eastern Gulf of Mexico Subtropical Yes 150–800 4–15 23
Southwestern Indian Ocean Subtropical Yes 100–700 4–15 79,80
Arabian Sea (Somalia) Tropical Yes 100–1500 5–15 27
the deep ocean7,8. Given their behaviour, high biomass and feeding ecology, mesopelagic micronektivores
poten-tially contribute to the active part of this process8,65–67. Indeed, they may be isolated from epipelagic predators
and they are directly and/or indirectly (through their prey) connected to epipelagic waters where photosynthetic processes occur5,23,25,68. Carbon storage depends on the depth difference between the ingestion of carbon and its
release by respiration, excretion, defecation, and mortality8,62,65,67,69. For instance, carbon may be sequestered for
longer than a year when released at mesopelagic waters, and for up to centuries when egested on deeper-water masses (generally greater than 1,000 m)6,7. Conversely, carbon may not be stored when vertical migrants are
consumed by epipelagic predators and/or released at surface waters6,7,70. Hence, the contribution of
mesope-lagic micronektivores to the BCP depends on their diel vertical migration as well as the one of their prey and predators70,71.
Based on our data, the viperfish is the most abundant mesopelagic micronektivore in the WTA. This spe-cies remains at deep waters full-time, is away from epipelagic predators, and heavily preys on migrant myct-ophids, which otherwise would return and release carbon in epipelagic waters. Additionally, at epipelagic waters myctophids are extensively preyed by epipelagic predators. Therefore, this species likely contributes to carbon storage, once it supports the storage of organic matter actively vertically transported through their prey. Moreo-ver, viperfish are preyed by higher trophic levels (e.g. Ectreposebastes imus) that perform diel migrations from bathypelagic depth to feed at the lower mesopelagic zone (500–1000 m). This relationship may also accelerates carbon sequestration into the deep-sea. However, the BCP is a complex process67,69,72 and here we focused only
on ecological drivers (vertical behaviour and trophodynamics) that could enhance this activity. Further studies are required to thoroughly investigate the contribution of mesopelagic micronektivores on the BCP. For instance, future investigation should measure and/or estimate the carbon flux of these species through respiration, gut flux, excretion, and mortality8,65,67,69. Additionally, to properly understand the extension of this process, estimated
carbon fluxes must be contrasted with the gravitational flux of particulate organic matter.
Conceptual model.
By combining our results with previous works, we constructed a conceptual model explaining how temperature might influence both trophic ecology and vertical movements of the viperfish (Fig. 7). We observed that temperature (12–15 °C) is likely restricting its upper limit of distribution and thus affecting its vertical habitat and trophodynamics. For instance, in the WTA, and probably most of tropical waters,Figure 7. Conceptual model exhibiting global suitable vertical habitat of the viperfish Chauliodus sloani based
on temperature profiles (Source: Word Ocean Atlas73) and differences in the vertical migration and trophic
interactions of this species in the tropical and temperate waters. Temperature information from the upper panel refers to the meridional Sect. 30°.
the viperfish likely stay full-time breathing, excreting, and serving as prey (e.g. for bathypelagic predators) at deep layers (below 400 m). In most temperate regions, however, they ascend to superficial waters where they are consumed by epipelagic predators and release carbon where its remineralization is the greatest (0–200 m). More broadly, based on the viperfish case, we show that the ecology and thus potential contribution of micronektivores to the carbon storage is expected to vary geographically, modulated by the latitudinal change in sea temperature.
Conclusion
Here we combined novel information on the viperfish trophodynamics and migratory behaviour in relation to physicochemical conditions (oxygen and temperature) to further understand the ecology and thus functional role of mesopelagic micronektivores. We demonstrate that, in the western Tropical Atlantic, the viperfish is amongst the most important mesopelagic micronektivore in terms of abundance and biomass. This species remains full-time at deep waters, heavily preys on myctophids, and presents spatial and trophic ontogenetic shifts. Temperature restricts its vertical distribution. Therefore, its ecology and functional roles are expected to be modulated by the latitudinal change in temperature. Moreover, we address some of its potential contribution to carbon storage and suggest further research.
Our findings indicate that the ecology and thus functional role of mesopelagic micronektivores may be more complex than previously thought, providing new perspectives on their trophic ecology, habitat, and migratory behaviour. With the predicted and observed effects of climatic change16,17, pollution18, and exploitation of
deep-sea resources, we reaffirm that the structure and function of deep-deep-sea ecosystems could undergo changes that, given the current state of knowledge, may go mostly unnoticed by scientists, marine resource managers, and conservation biologists. Studying the variability of biological behaviors of mesopelagic fishes is critical to further understand their ecology, conservation, and thus several ecosystem processes.
Received: 18 May 2020; Accepted: 4 November 2020
References
1. Irigoien, X. et al. Large mesopelagic fishes biomass and trophic efficiency in the open ocean. Nat. Commun. 5, 3271 (2014). 2. Gjøsaeter, J. & Kawaguchi, K. A review of the world resources of mesopelagic fish. FAO Fish. Tech. Pap. 193, 123–134 (1980). 3. Sutton, T. T. et al. A global biogeographic classification of the mesopelagic zone. Deep. Res. Part I 126, 85–102 (2017). 4. Priede, I. G. Deep-sea fishes: Biology, diversity, ecology and fisheries. (Cambridge University Press, 2017). doi:https ://doi.
org/10.1017/97813 16018 330.
5. Sutton, T. T. Vertical ecology of the pelagic ocean: classical patterns and new perspectives. J. Fish Biol. 83, 1508–1527 (2013). 6. Boyd, P. W., Claustre, H., Levy, M., Siegel, D. A. & Weber, T. Multi-faceted particle pumps drive carbon sequestration in the ocean.
Nature 568, 327–335 (2019).
7. Cavan, E. L., Laurenceau-Cornec, E. C., Bressac, M. & Boyd, P. W. Exploring the ecology of the mesopelagic biological pump. Prog.
Oceanogr. 176, 102–125 (2019).
8. Davison, P. C., Checkley, D. M., Koslow, J. A. & Barlow, J. Carbon export mediated by mesopelagic fishes in the northeast Pacific Ocean. Prog. Oceanogr. 116, 14–30 (2013).
9. Albuquerque, F. V., Navia, A. F., Vaske-Jr, T., Crespo, O. & Hazin, F. H. V. Trophic ecology of large pelagic fish in the Saint Peter and Saint Paul Archipelago Brazil. Mar. Freshw. Res. 70, 1402–1418 (2019).
10. Battaglia, P. et al. Feeding habits of the Atlantic bluefin tuna, Thunnus thynnus (L. 1758), in the central Mediterranean Sea (Strait of Messina). Helgol. Mar. Res. 67, 97–107 (2013).
11. Cherel, Y., Fontaine, C., Richard, P. & Labat, J. P. Isotopic niches and trophic levels of myctophid fishes and their predators in the Southern Ocean. Limnol. Oceanogr. 55, 324–332 (2010).
12. Drazen, J. C. & Sutton, T. T. Dining in the deep: the feeding ecology of deep-sea fishes. Ann. Rev. Mar. Sci. 9, 1–26 (2017). 13. John, M. A. S. et al. A dark hole in our understanding of marine ecosystems and their services: perspectives from the mesopelagic
community. Front. Mar. Sci. 3, 1–6 (2016).
14. Hidalgo, M. & Browman, H. I. Developing the knowledge base needed to sustainably manage mesopelagic resources. ICES J. Mar.
Sci. 76, 609–615 (2019).
15. Martin, A. et al. The oceans’ twilight zone must be studied now, before it is too late. Nature 580, 26–28 (2020). 16. Levin, L., Baker, M. & Thomson, A. Deep-ocean climate change impacts on habitat, fish and fisheries. (FAO, 2019).
17. Brito-Morales, I. et al. Climate velocity reveals increasing exposure of deep-ocean biodiversity to future warming. Nat. Clim. Chang.
10, 576–581 (2020).
18. Davison, P. & Asch, R. G. Plastic ingestion by mesopelagic fishes in the North Pacific Subtropical Gyre. Mar. Ecol. Prog. Ser. 432, 173–180 (2011).
19. Drazen, J. C. et al. Midwater ecosystems must be considered when evaluating environmental risks of deep-sea mining. Proc. Natl.
Acad. Sci. 117, 17455–17460 (2020).
20. Eduardo, L. N. et al. Hatchetfishes (Stomiiformes: Sternoptychidae) biodiversity, trophic ecology, vertical niche partitioning and functional roles in the western Tropical Atlantic. Prog. Oceanogr. 186, 102389 (2020).
21. Olivar, M. P. et al. Mesopelagic fishes across the tropical and equatorial Atlantic: biogeographical and vertical patterns. Prog.
Oceanogr. 151, 116–137 (2017).
22. Cherel, Y., Romanov, E. V., Annasawmy, P., Thibault, D. & Ménard, F. Micronektonic fish species over three seamounts in the southwestern Indian Ocean. Deep. Res. Part II, 176 (2020).
23. Sutton, T. T. & Hopkins, T. L. Trophic ecology of the stomiid (Pisces: Stomiidae) fish assemblage of the eastern Gulf of Mexico: strategies, selectivity and impact of a top mesopelagic predator group. Mar. Biol. 127, 179–192 (1996).
24. Carmo, V., Sutton, T., Menezes, G., Falkenhaug, T. & Bergstad, O. A. Feeding ecology of the Stomiiformes (Pisces) of the northern Mid-Atlantic Ridge. 1. The Sternoptychidae and Phosichthyidae. Prog. Oceanogr. 130, 172–187 (2015).
25. Richards, T. M. et al. Trophic ecology of meso- and bathypelagic predatory fishes in the Gulf of Mexico. ICES J. Mar. Sci. 76, 662–672 (2018).
26. Sutton, T. T. & Hopkins, T. L. Species composition, abundance, and vertical distribution of the stomiid (Pisces: Stomiiformes) fish assemblage of the Gulf of Mexico. Bull. Mar. Sci. 59, 530–542 (1996).
27. Butler, M., Bollens, S. M., Burkhalter, B., Madin, L. P. & Horgan, E. Mesopelagic fishes of the Arabian Sea: Distribution, abundance and diet of Chauliodus pammelas, Chauliodus sloani, Stomias affinis, and Sòtomias nebulosus. Deep. Res. Part II 48, 1369–1383 (2001).
28. Battaglia, P., Ammendolia, G., Esposito, V., Romeo, T. & Andaloro, F. Few but relatively large prey: trophic ecology of Chauliodus
sloani (Pisces: Stomiidae) in deep waters of the Central Mediterranean Sea. J. Ichthyol. 58, 8–16 (2018).
29. Gibbs, R. H. Chauliodontidae. in Fishes of the north-eastern Atlantic and the Mediterranean (eds. Whitehead, P. J. ., Bauchot, M. L., Hureau, J. C., Nielsen, J. & Tortonese, E.) 336–337 (Unesco, 1989).
30. Harrison, I. J. The living marine resources of the Western Central Atlantic. Volume 2: Bony fishes part 1 (Acipenseridae to Gram-matidae). FAO Species Identif. Guid. Fish. Purp. Am. Soc. Ichthyol. Herpetol. Spec. Publ. No. 5 601–1374 (2003).
31. Eduardo, L. N. et al. Length-weight relationship of twelve mesopelagic fishes from the western Tropical Atlantic. J. Appl. Ichthyol. (2020) https ://doi.org/10.1111/jai.14084 .
32. Figueiredo, G. A., Schwamborn, R., Bertrand, A., Munaron, J.-M. & Le Loc’h, F. Body size and stable isotope composition of zooplankton in the western Tropical Atlantic. J. Mar. Syst. 211, 103449 (2020).
33. Willis, A. J., Sokal, R. R. & Rohlf, F. J. Introduction to Biostatistics. vol. 72 (Dover Publications, 1988).
34. Marks, A. D., Kerstetter, D. W., Wyanski, D. M. & Sutton, T. T. Reproductive ecology of dragonfishes (Stomiiformes: Stomiidae) in the Gulf of Mexico. Front. Mar. Sci. 7, 101–105 (2020).
35. Sorell, J. M. et al. Diet and consumption rate of Atlantic bluefin tuna (Thunnus thynnus) in the Strait of Gibraltar. Fish. Res. 188, 112–120 (2017).
36. Varghese, S. P. & Somvanshi, V. S. Feeding ecology and consumption rates of yellowfin tuna Thunnus albacares (Bonnaterre, 1788) in the eastern Arabian Sea. Indian J. Fish. 63, 16–26 (2016).
37. Levins, R. Evolution in changing environments: Some theoretical explorations. (Princeton University Press, Princeton, 1969). 38. Cresson, P., Ruitton, S., Fontaine, M. F. & Harmelin-Vivien, M. Spatio-temporal variation of suspended and sedimentary organic
matter quality in the Bay of Marseilles (NW Mediterranean) assessed by biochemical and isotopic analyses. Mar. Pollut. Bull. 64, 1112–1121 (2012).
39. Post, D. M. Using Stable Isotopes to estimate trophic postition: Models, methods and assumptions. Ecology 83, 703–718 (2002). 40. Montoya, J. P., Carpenter, E. J. & Capone, D. G. Nitrogen fixation and nitrogen isotope abundances in zooplankton of the
oligo-trophic North Atlantic. Limnol. Oceanogr. 47, 1617–1628 (2002).
41. McCutchan, J. H., Lewis, W. M., Kendall, C. & McGrath, C. C. Variation in trophic shift for stable isotope ratios of carbon, nitrogen, and sulfur. Oikos 102, 378–390 (2003).
42. Quezada-Romegialli, C., Jackson, A. L. & Harrod, C. Package ‘tRophicPosition’. https ://githu b.com/clque zada/tRoph icPos ition (2017).
43. Stock, B. C. & Semmens, B. X. MixSIAR GUI User Manual. Version 3.1. https ://githu b.com/brian stock /MixSI AR (2013) https :// doi.org/10.5281/zenod o.56159 .
44. Caut, S., Angulo, E. & Courchamp, F. Caution on isotopic model use for analyses of consumer diet. Can. J. Zool. 86, 438–445 (2008). 45. Jackson, A. & Parnell, A. Stable Isotope Bayesian Ellipses in R. R package version 2.1.4. 31 https://doi.org/https ://doi.org/10.111
1/j.1365-2656.2011.01806 .x (2019).
46. Valls, M. et al. Trophic structure of mesopelagic fishes in the western Mediterranean based on stable isotopes of carbon and nitrogen. J. Mar. Syst. 138, 160–170 (2014).
47. Fry, B. Stable Isotope Ecology. (Springer, 2006). doi:https ://doi.org/10.1007/0-387-33745 -8.
48. Olivar, M. P., Bode, A., López-Pérez, C., Hulley, P. A. & Hernández-León, S. Trophic position of lanternfishes (Pisces: Myctophidae) of the tropical and equatorial Atlantic estimated using stable isotopes. ICES J. Mar. Sci. 76, 649–661 (2018).
49. Netburn, A. N. & Anthony, K. Dissolved oxygen as a constraint on daytime deep scattering layer depth in the southern California current ecosystem. Deep. Res. Part I 104, 149–158 (2015).
50. Boswell, K. M. et al. Oceanographic structure and light levels drive patterns of sound scattering layers in a low-latitude oceanic system. Front. Mar. Sci. 7, (2020).
51. Schott, F. Monsoon response of the Somali Current and associated upwelling. Prog. Oceanogr. 12, 357–381 (1983).
52. Rosas-Luis, R., Villanueva, R. & Sánchez, P. Trophic habits of the ommastrephid squid Illex coindetii and Todarodes sagittatus in the northwestern Mediterranean Sea. Fish. Res. 152, 21–28 (2014).
53. Silva, G. B., Hazin, H. G., Hazin, F. H. V. & Vaske-Jr, T. Diet composition of bigeye tuna (Thunnus obesus) and yellowfin tuna (Thunnus albacares) caught on aggregated schools in the western equatorial Atlantic Ocean. J. Appl. Ichthyol. 2, 1111–1118 (2019). 54. Gaskett, A. C., Bulman, C., He, X. & Goldsworthy, S. D. Diet composition and guild structure of mesopelagic and bathypelagic
fishes near Macquarie Island, Australia New Zeal. J. Mar. Freshw. Res. 35, 469–476 (2001).
55. Laptikhovsky, V. V. A trophic ecology of two grenadier species (Macrouridae, Pisces) in deep waters of the Southwest Atlantic.
Deep. Res. Part I 52, 1502–1514 (2005).
56. González, C., Bruno, I. & Paz, X. Food and feeding of deep-sea redfish (Sebastes mentella Travin) in the North Atlantic. NAFO Sci.
Counc. Stud. 10, 89–101 (2000).
57. Clarke, T. A. Feeding habits of stomiatoid fishes from Hawaiian waters. Fish. Bull. 80, 287–304 (1982).
58. Roe, H. S. J. The diel migrations and distributions within a mesopelagic community in the North East Atlantic. 2. Vertical migra-tions and feeding of mysids and decapod crustacea. Prog. Oceanogr. 13, 269–318 (1984).
59. Legand, M. & Rivaton, J. Cycles biologiques des poissons mésopélagiques dans l’est de l’océan Indien. Cah. O.R.S.T.O.M., Sér.
Océanogr 5, 47–71 (1967).
60. Suntsov, A. V. & Brodeur, R. D. Trophic ecology of three dominant myctophid species in the northern California Current region.
Mar. Ecol. Prog. Ser. 373, 81–96 (2008).
61. Sutton, T. T., Lancraft, T. M. & Hopkins, T. L. The trophic structure and predation impact of a low latitude midwater fish assemblage.
Prog. Oceanogr. 38, 205–239 (1997).
62. Hudson, J. M., Steinberg, D. K., Sutton, T. T., Graves, J. E. & Latour, R. J. Myctophid feeding ecology and carbon transport along the northern Mid-Atlantic Ridge. Deep. Res. Part I 93, 104–116 (2014).
63. Hu, V. J. H. Relationships between vertical migration and diet in four species of euphausiids. Limnol. Oceanogr. 23, 296–306 (1978). 64. Stefanoudis, P. V. et al. Changes in zooplankton communities from epipelagic to lower mesopelagic waters. Mar. Environ. Res. 146,
1–11 (2019).
65. Aumont, O., Maury, O., Lefort, S. & Bopp, L. Evaluating the potential impacts of the diurnal vertical migration by marine organ-isms on marine biogeochemistry. Global Biogeochem. Cycles 32, 1622–1643 (2018).
66. Kwong, L. & Pakhomov, E. Assessment of active vertical carbon transport: New methodology. Uchenye Zap. Kazan. Univ. Seriya
Estestv. Nauk. 159, 492–509 (2017).
67. Ariza, A., Garijo, J. C., Landeira, J. M., Bordes, F. & Hernández-León, S. Migrant biomass and respiratory carbon flux by zooplank-ton and micronekzooplank-ton in the subtropical northeast Atlantic Ocean (Canary Islands). Prog. Oceanogr. 134, 330–342 (2015). 68. Choy, C. A., Portner, E., Iwane, M. & Drazen, J. C. Diets of five important predatory mesopelagic fishes of the central North Pacific.
Mar. Ecol. Prog. Ser. 492, 169–184 (2013).
69. Burd, A. B. et al. Assessing the apparent imbalance between geochemical and biochemical indicators of meso- and bathypelagic biological activity: What the @$#! is wrong with present calculations of carbon budgets?. Deep. Res. Part II 57, 1557–1571 (2010).
70. Wang, F. et al. Trophic interactions of mesopelagic fishes in the south China Sea illustrated by stable isotopes and fatty acids. Front.
Mar. Sci. 5, 1–12 (2019).
71. Choy, C. A., Popp, B. N., Hannides, C. C. S. & Drazen, J. C. Trophic structure and food resources of epipelagic and mesope-lagic fishes in the north Pacific Subtropical Gyre ecosystem inferred from nitrogen isotopic compositions. Limnol. Oceanogr. 60, 1156–1171 (2015).
72. Henson, S., Le Moigne, F. & Giering, S. Drivers of carbon export efficiency in the global ocean. Global Biogeochem. Cycles 33, 891–903 (2019).
73. Boyer, T. P. et al. World Ocean Atlas 2018. NOAA National Centers for Environmental Information. https ://acces sion.nodc.noaa. gov/NCEI-WOA18 (2018).
74. Williams, A., Koslow, J., Terauds, A. & Haskard, K. Feeding ecology of five fishes from the mid-slope micronekton community off southern Tasmania Australia. Mar. Biol. 139, 1177–1192 (2001).
75. Williams, A. & Koslow, J. A. Species composition, biomass and vertical distribution of micronekton over the mid-slope region off southern Tasmania Australia. Mar. Biol. 130, 259–276 (1997).
76. Sokolov, S. & Rintoul, S. Circulation and water masses of the southwest Pacific: WOCE section P11, Papua New Guinea to Tasmania.
J. Mar. Res. 58, 223–268 (2000).
77. Bopp, L. et al. Multiple stressors of ocean ecosystems in the 21st century: Projections with CMIP5 models. Biogeosciences 10, 6225–6245 (2013).
78. Martínez-García, A. et al. Iron fertilization of the subantarctic ocean during the last ice age. Science 343, 1347–1350 (2014). 79. Annasawmy, P. et al. Micronekton distributions and assemblages at two shallow seamounts of the south-western Indian Ocean:
Insights from acoustics and mesopelagic trawl data. Prog. Oceanogr. 178, 102161 (2019).
80. Jena, B., Sahu, S., Avinash, K. & Swain, D. Observation of oligotrophic gyre variability in the south Indian Ocean: environmental forcing and biological response. Deep. Res. Part I 80, 1–10 (2013).
81. Søiland, H., Budgell, W. P. & Knutsen, O. The physical oceanographic conditions along the Mid-Atlantic Ridge north of the Azores in June–July 2004. Deep. Res. Part II(55), 29–44 (2008).
82. Cook, A. B., Sutton, T. T., Galbraith, J. K. & Vecchione, M. Deep-pelagic (0–3000m) fish assemblage structure over the Mid-Atlantic Ridge in the area of the Charlie-Gibbs Fracture Zone. Deep. Res. Part II 98, 279–291 (2013).
83. Van Utrecht, W. L., Van Utrecht-Cock, C. N. & De Graaf, A. M. J. Growth and seasonal variations in distribution of Chauliodus
sloani and C. danae (Pisces) from the mid North Atlantic. Bijdr. Dierkd. 57, 164–182 (1987).
Acknowledgements
We acknowledge the French oceanographic fleet for funding the at-sea survey ABRACOS 2 (https ://dx.doi.
org/10.17600 /17004 100) and the officers and crew of the RV Antea for their contribution to the success of the operations. Thanks also to the BIOIMPACT (UFRPE) and LIZ (UFRJ) students for their support. We thank the CNPq (Brazilian National Council for Scientific and Technological Development), which provided research grant to Flávia Lucena Frédou. Thanks to Alejandro Ariza for reviewing the first draft of the manuscript. This study is a contribution to the LMI TAPIOCA, program CAPES/COFECUB (88881.142689/2017-01), EU H2020 TRIATLAS project (grant agreement 817578). Leandro Nolé Eduardo is supported by CAPES (Brazilian Coordination for the Improvement of Higher Education Personnel), CAPES-Print, and FUNBIO/HUMANIZE under the grant “Pro-grama Bolsas Funbio—Conservando o Futuro 2018” (011/2019). The NPM Fish Collection has been supported by the Project MULTIPESCA (FUNBIO) under the grant ‘Pesquisa Marinha e Pesqueira’, contract 104/2016.
Author contributions
L.N.E. performed analyses and wrote the manuscript with contributions of F.L.F., M.M.M., A.C.S., F.L.L, T.F., F.M. and A.B. A.B. and F.L.F. conceptualized and coordinated the research project. All authors participated to the at-sea survey and/or contributed substantially on biological analyses.
Competing interests
The authors declare no competing interests.
Additional information
Supplementary information is available for this paper at https ://doi.org/10.1038/s4159 8-020-77222 -8.
Correspondence and requests for materials should be addressed to L.N.E. Reprints and permissions information is available at www.nature.com/reprints.
Publisher’s note Springer Nature remains neutral with regard to jurisdictional claims in published maps and
institutional affiliations.
Open Access This article is licensed under a Creative Commons Attribution 4.0 International
License, which permits use, sharing, adaptation, distribution and reproduction in any medium or format, as long as you give appropriate credit to the original author(s) and the source, provide a link to the Creative Commons licence, and indicate if changes were made. The images or other third party material in this article are included in the article’s Creative Commons licence, unless indicated otherwise in a credit line to the material. If material is not included in the article’s Creative Commons licence and your intended use is not permitted by statutory regulation or exceeds the permitted use, you will need to obtain permission directly from the copyright holder. To view a copy of this licence, visit http://creat iveco mmons .org/licen ses/by/4.0/.