HAL Id: hal-00815466
https://hal.archives-ouvertes.fr/hal-00815466
Submitted on 18 Feb 2019
HAL is a multi-disciplinary open access
archive for the deposit and dissemination of sci-entific research documents, whether they are pub-lished or not. The documents may come from teaching and research institutions in France or abroad, or from public or private research centers.
L’archive ouverte pluridisciplinaire HAL, est destinée au dépôt et à la diffusion de documents scientifiques de niveau recherche, publiés ou non, émanant des établissements d’enseignement et de recherche français ou étrangers, des laboratoires publics ou privés.
Emmanuelle Quillérou, Olivier Guyader
To cite this version:
Emmanuelle Quillérou, Olivier Guyader. What is behind fleet evolution: a framework for flow analysis and application to the French Atlantic fleet. ICES Journal of Marine Science, Oxford University Press (OUP), 2012, 69 (6), pp.1069-1077. �10.1093/icesjms/fss060�. �hal-00815466�
by Oxford University Press.
This is a pre-copy-editing, author-produced PDF of an article accepted for publication in ICES Journal of Marine Science following peer review. The definitive publisher-authenticated version is available online at: http://dx.doi.org/10.1093/icesjms/fss060
What is behind fleet evolution: a framework for flow analysis and application to the French Atlantic fleet
Emmanuelle Quillérou1, 2, * and Olivier Guyader2
1 United Nations University, Institute for Water, Environment and Health, 175 Longwood Rd. South, Suite 204,
Hamilton, Ontario L8P 0A1, Canada
2 UMR M_101 AMURE, Unité d'Économie Maritime, Ifremer Brest, Technopole de Brest-Iroise, BP 70, 29280
Plouzane, France
*: Corresponding author : Emmanuelle Quillérou, tel: +1 905 667 5511 ; fax: +1 905 667 5510 ; e-mail: [email protected]
Abstract :
The study of fishery dynamics considers national-level fleet evolution. It has, however, failed to consider the flows behind fleet evolution as well as the impact of the dynamics of owners of invested capital on fleet evolution. This paper establishes a general conceptual framework which identifies different vessel and owner flows behind fleet evolution and some relationships between these flows. This descriptive conceptual framework aims to change the current focus on drivers of fleet evolution to drivers of the flows behind fleet evolution. We identify a direct impact of vessel flows on the fleet size and nature, and an indirect impact of the movements of capital owners on the fleet evolution (size and nature). This conceptual framework is illustrated using French Atlantic fleet data over a 15-year period (1994–2008). It is shown that the identified flows vary in size and nature and therefore impact differently on the fleet evolution. This description also shows some dependence of vessel flows on owner dynamics. This relationship should be better taken into account for more effective capacity management.
Keywords : capacity dynamics ; capacity reduction ; fishery management ; owner flows ; policy
1. INTRODUCTION
Current shortfalls in fisheries management suggest there is a need to better understand fleet dynamics (Fulton et al., 2011). If the study of fisheries dynamics increasingly seeks to take into account the evolution of fishing fleets and their pressure on ecosystems, the main mechanisms behind fleet evolution at the local, national or international levels are often not studied or only partially studied (Salas and Gaertner, 2004, Garcia and Grainger 2005, FAO, 2010). This largely stems from a lack of data availability on fleet evolution for most fisheries as well as the lack of a complete and explicitly defined framework for analysis. This paper focuses on the latter.
Most developed country fleets are monitored following overcapacity concerns. In particular, open access fisheries are typically characterised by only partly used vessels and this unused potential effort constitutes overcapacity. Even when fleets are managed with the objective of preserving fish stocks, using a Total Allowable Catch and quota system, fleet dynamics remain a concern for resource rent maximisation and more economically optimal fishery management. Overcapacity reduces the economic rent extracted by each vessel operating in the fleet and has been identified as a major factor leading to overfishing (FAO, 2010). An International Plan of Action for the Management of Fishing Capacity has been implemented since 1999 (FAO, 1999).
Fishing capacity should, in theory, be measured as the maximum output potentially produced from given inputs in the fishery (as recommended by Gréboval, 1999). In practice however, the number of inputs (e.g. number of vessels, their tonnage and engine power) is largely used by policy-makers as a measure for capacity (Pascoe,
2007). This capacity input-approach has so far inspired the design of many fleet monitoring tools, e.g. the Fleet Register of the European Common Fisheries Policy (Cueff, 2007). These fleet monitoring tools record simple measures of fleet evolution through the number of vessels and their characteristics (length, power, tonnage). This descriptive data is viewed as less politically sensitive and is more easily made publicly available.
Parallel to fleet monitoring, policies targeting fishing capacity reduction typically restrict vessel entry in the fishery whilst targeting an increase in vessel exits. Barriers to entry have been implemented through mandatory access right or permits to fish (licences) complemented by input-control measures such gear restrictions, area limitations, seasonal closures (Wilen, 1988, Townsend, 1990). In parallel, decommissioning schemes (or buyback programmes) have provided financial incentives for voluntary vessel exit (Curtis and Squires, 2004). These capacity management policies have however been shown to be cost-ineffective for fleet capacity reduction (Guyader, 2002, Reid et al., 2003, Kirkley et al., 2004, Lindebo, 2005a, Tingley and Pascoe, 2005, Van Hoof and De Wilde, 2005, Hoff and Frost, 2007, Villasante, 2010). This limited effectiveness of capacity management programmes has been partly caused by the provision of conflicting subsidy programmes, along with poorly defined policy objectives and institutional weaknesses (Caddy and Cochrane, 2001). For example, vessel buyback programmes have been undermined by the parallel provision of subsidies for the construction or modernisation of vessels (Lindebo, 2005b, Sumaila et
Also, and more importantly, entry and exit policies are based on incentives to change the size of established flows of capital (increase exit flows and decrease entry flow). The underlying incentive structure for investment decision is thus left relatively unchanged by current entry and exit policies, and has been identified as the major cause for overcapitalisation (Wilen, 1988, Townsend, 1990, Espino et al., 2005, Grafton, 2006, Anderson, 2007, Asche, 2007, Cox, 2007, Wilen, 2007). The incentive instruments advocated in the literature as successfully changing capital investment incentives by better aligning them with harvesting decisions so far have been either Individual Transferable Quotas (ITQ) or taxes (Jensen, 1998, Asche et al., 2008, Squires et al., 2010). These incentive instruments might, however, not always be sufficient in fully reducing overcapacity depending on the broader context, transaction costs of implementation, and the time horizon considered (Whitmarsh, 1998, Asche et
al., 2008, Townsend, 2010). These economic instruments have so far, not been formally
implemented under a nationally uniform and transparent system in France.
Conceptual studies of capital dynamics in fisheries have aimed to determine either optimal investment paths towards desirable levels of capital or changes in investment behaviour because of incentives created by economic and regulatory circumstances (Nostbakken et al., 2011). Fishers are decision-makers in relation to investments into fishing capital and are therefore sensitive to incentives. These incentives encompass incentives for keeping or removing their vessels from the fleet, but also their own entry or exit into the fishing sector. Fishers' behaviour is a key source of uncertainty in fisheries management (Fulton et al., 2011). It is however rarely analysed in operational decision-making tools for fisheries management support. The academic literature on
investment in fisheries or entry-exit models has so far focused on vessels only. Several decision-making models of vessel entries and exits have been established in the literature. These models show that vessel entry and exit decisions depend on potential profitability, alternative fishery, crowding externality, resource abundance, some vessel characteristics such as age and size, and less often on the availability of decommissioning scheme (Bjorndal and Conrad, 1987, Pradhan and Leung, 2004, Mardle et al., 2006, Tidd et al, 2011). Vessel entry-exit models are however limited. They have allowed to characterise the direction of change (qualitative) rather than its magnitude (quantitative) (TECTAC, 2005, p110, 114-116). They have considered some owner’s characteristics such as age but failed to explicitly consider the owners' own entries and exits from the fishing sector as a determinant of the decision to enter or exit vessels, which in turn impacts on the fleet size and structure. The implication is that considering owner movements might help improve predictions of models of entry and exit of vessels from the fleet.
Within the fleet, fishers can also trade their vessels on the second-hand market. These transactions are very often associated with investment in upgrading existing vessel capacity. These capacity changes are most obvious when leading to vessels changing in fleet segments. In France, second-hand markets are geographically limited, although they have allowed some redistribution of the fleet towards Aquitaine and Northern France between 1992 and 2009 (Quillérou et al., 2011). Buyers and sellers find one another mostly through local channels of information such as direct contact, through other fishers, newspapers, fishers associations, producer organisations, accounting centres. Internet websites have recently become popular for advertising sales. Contrary
to smaller vessels, bigger (more expensive) vessels tend to be traded through intermediaries (brokers). It is not possible to quantify this more specifically in France because of the lack of specific data.
In relation to the shortfalls of the current capacity management policies and incentive structure provided, there is a need for a better description of what is happening below the fleet level considered by national policies. This more complete approach to capacity analysis considers both vessels and owners flows. This approach sets the scene for improved assessment of what drives investment into fishing capacity taking an owner's point of view. It also provides a simple framework for operational decision-making tools for fisheries management support and assessing the fleet’s economic efficiency. It could also help better evaluate different capacity management measures and better inform the design of public policies.
The aim of this paper is consequently to establish an integrated framework to decompose the evolution of fleet capacity. This framework adopts a very generic approach by considering a group of vessels as the evolving fleet (here within a common geographical area) and a generic unit of capacity (vessel numbers, power, or tonnage). This framework can be used to describe different fleet evolutions in different management contexts as data on vessels and their owners is publicly available in most fleet registers.
The integrated framework identifies the vessel and owner flows underlying the evolution of fleet capacity (in size and nature) and is designed for a given group of
vessels (here within the same geographical unit for illustration purposes). For illustration purposes, fleet capacity is measured by vessel numbers in this paper. This framework is based on the consideration of both direct and indirect impacts on fleet capacity from vessel flows and owners' flows. This framework outlines the need to consider the owner's decision-making for vessels entry and exits, but also behind their own entry into and exit from the fishing sector. These flows are further decomposed along different types of entries and exits. This framework is detailed using French Atlantic fleet data, with each flow type characterised by its size and nature. This framework is general enough to characterise any fleet capacity evolution, and not only in a context of overcapacity.
Supply of second-hand vessels depends on the size of entry flows relative to exit flows, as well as on the number of owners leaving the fleet. Demand in vessels depends on fishery productivity and owners' entries into the fishing sector. The different vessel and owners' flows will impact vessel supply and demand, with asymmetric impacts on entry, exit and the second-hand market. The analysis of both direct and indirect impacts could thus help derive a better understanding of what determines vessel entry, exit and market exchange. This framework aims to allow a simple approach for preliminary economic analysis of fleets that are not yet subject to systematic capacity monitoring. This framework should help to better understand fleet capacity dynamics, improve policy evaluations and inform policy design for more effective capacity management. It is applied on the French fishing vessel fleet as data on vessel and owners flows was available.
In the introduction we described the general policy context, identified the shortfalls of the current literature, and detailed the approach taken in this paper. The next section details the proposed conceptual framework for fleet evolution analysis for a given group of vessels (Method). The section that follows details the French policy context, the data used in the empirical analysis and the evolutions of vessels and owners numbers observed between 1994 and 2008 (Material). The fourth and fifth sections detail the empirical application of the conceptual framework (Results). They illustrate respectively the vessel and owner flows identified in the conceptual framework. These flows are characterised both by their magnitude (number of vessels or owners) and nature (types of vessel or owners). The section on indirect impacts also describes the vessel flows associated to each owner's flow. The last section discusses implications from our results and concludes.
2. CONCEPTUAL FRAMEWORK TO ESTABLISH A TYPOLOGY OF
VESSEL AND OWNER FLOWS IN RELATION TO FLEET
EVOLUTION
This descriptive analysis is based on a novel conceptualisation of a measure of vessel capacity and number of owners (population), graphically represented in Figure 1. The conceptual framework of this paper provides the basis for deriving a typology for both vessel and owner flows. These flows will in particular impact on the size and nature of the fleet for a given unit of reference.
This conceptual framework is established for a given perfectly defined group of vessels as the reference unit of interest. For description purposes, we take this group of vessels to belong to the same geographical unit of analysis. This geographical unit is defined according to the analysis scale of interest, e.g. a fishing harbour, district, administrative region or country. It should be noted that the empirical section of this paper uses a land-based geographical unit i.e. it is not related to the actual fishing area but to the place of vessel registration. This conceptual framework could similarly be used to describe capacity movements for given fishing grounds or fishing stocks and is therefore not restricted to land-based units. This analysis attempts to identify the flows behind the fleet changes within this given geographical unit. This framework does, however, not attempt to describe the flows between two specific geographical units, nor identify the drivers behind the identified flows.
Also, the empirical part of this paper considers vessel numbers as measure of fishing capacity. This framework could be applied to other measures of fishing capacity (power, tonnage or investment flows) depending on data availability and research question of interest.
In a fleet context, two types of evolutions can be considered: the evolution of of fishing vessels (fleet) and that of the owners of the fishing vessels (clear ellipses in Figure 1). The fleet considered is contained in the geographical unit of analysis (rectangle on Figure 1). This fishing fleet can be further decomposed into fleet segments. A given fishing segment is relatively homogenous and characterised by a specific vessel length and gear combination (e.g. trawler, seine purse). The dotted-frontier darker ellipsis on
Figure 1 represents the vessels traded on the second-hand vessel market within the geographical unit.
Figure 1: Conceptualisation, for a given unit of analysis (rectangle), of the impact of vessel (owner) flows (single arrows) on vessel (owners) numbers (ellipses), and of the impact of possible associations between owners and vessel flows (double arrows) on the fleet. Vessel entries (arrow 1)
are made of new builts, imports from outside the vessel group of interest (e.g., from other geographical zones) and vessels resuming their activity. Vessel exits (arrow 2) include destructions, exports and suspensions of vessel activity. Owners can enter the vessel group considered for the first time or more (arrow 4), and leave the group permanently (e.g. when they leave the fishing sector and do not come back) or temporarily (arrow 5). Owners trade vessels on the second hand market (arrow 8) which can lead to changes in fleet segments (arrow 3). Vessel and owners entries are not independent as represented by arrows 6, 7, 9 10.
Flows also arise within the geographical unit (e.g. second-hand trade within the unit), as well as to (entry) and from (exit) the geographical unit. Vessel flows are typically associated with vessel entry (arrow 1 in Figure 1) and vessel exit (arrow 2 in Figure 1). Vessels entering the geographical unit can be decomposed into new builds, vessels imported from other geographical units, and the vessels changing from a
non-commercial fishing to a fishing activity or vessels resuming their fishing activity after a period of inactivity (Figure 1). Vessels exits from the geographical unit can be decomposed into vessel destructions (subsidised or not), vessels exports to other geographical units or vessels suspending their activity for some time (Figure 1).
In addition, vessel flows within the geographical unit arise with their exchange on the second-hand market (arrow 3 in Figure 1). This exchange will be subject to the supply and demand for second-hand vessels (and their associated fishing entry licences). Following an exchange on the second-hand market, vessels can change segments, thus affecting the nature of the fleet, or exit the geographical unit (e.g. exported to other geographical units). In some fisheries, fishery licences can also be traded or leased separately from fishing vessels. This separate trade or leasing could also induce changes in fishing capacity and could be associated to different owners’ dynamics. This however is not allowed in France and is therefore not further detailed in this paper.
For conceptual simplicity and following the definition of the geographical unit in this paper, all vessels traded on the second-hand market are considered as part of the same geographical unit. This implies that all vessels traded in the second-hand market of a given geographical unit have entered the geographical unit (i.e. as part of the entry flow) before being sold on the second-hand market (where they become part of the exchange flow). The second-hand market trade in a given geographical unit thus does not impact on the overall size of the fleet but can impact on the nature of the fleet by impacting on the vessel allocation between fishing segments.
To sum up, vessels flows can be categorised as follows within the geographical unit of analysis of interest: entry flows (arrow 1 in Figure 1), exit flows (arrow 2 in Figure 1), and exchange flows (through the second-hand vessel market, arrow 3 in Figure 1). All these flows will affect the size and nature of the fleet across time (total numbers and proportions of each fishing segment), within the considered geographical unit.
Parallel to these vessel flows, the population of owners is also subject to changes because of owner flows. Owners can enter the geographical unit (arrow 4 in Figure 1). It can be a First entry or, if they leave the geographical unit and come back, a Second entry or more (depending on the number of times they appear in the fleet register). Owners can leave the geographical unit (arrow 5 in Figure 1), Permanently (e.g. when retiring or moving to another geographical unit) or Temporarily (i.e. when they come back to the area at a later date). They can also remain in the same geographical unit and trade on the second-hand market (arrow 8 in Figure 1).
These owner and vessel flows are often associated, but do not overlap completely. An owner can enter the geographical unit with the entry of a vessel (new builds, imports or resumed vessel activity). In this case, vessel entries are linked to entry of owners into the geographical unit (arrow 6 in Figure 1). Alternatively, an owner can enter the geographical unit after buying a vessel on the second-hand market of the geographical unit (arrow 7 in Figure 1). In this case, the entry of an owner is not linked to the entry of a vessel, and the fleet does not change within the considered geographical unit. Owners can also change fishing segments by exchanging vessels on the second-hand market (arrow 8 in Figure 1). In this case, there is no entry of owner or vessel in the
geographical unit, but rather internal changes to the vessel and owner population allocation between segments within the geographical unit. Similarly, an owner can leave the geographical unit through selling a vessel on the second-hand market (arrow 9 in Figure 1). In this case, the exit of an owner is not linked to the exit of a vessel, and the fleet does not change. An owner can exit the geographical unit with the exit of a vessel (destructions, exports or suspended vessel activity). In this context, vessel exits are thus linked to the exit of owners from the geographical unit (arrow 10 in Figure 1). Because of these associations between vessel and owner flows, owners' flows can thus indirectly impact on the fleet. The degree to which vessel flows are linked to owners' flows and the types of vessel and owner flows associated would help refine and extend current models of investment and associated vessel entries/exits.
An obvious consequence of the above is that the second-hand market vessel trade is influenced by the number and types of vessels within the geographical unit (arrow 3 in Figure 1), the entry or exit of owners associated with second-hand market transactions (arrows 7 and 9 in Figure 1), or the second-hand trade between owners within the same geographical unit and for the same overall fleet (arrow 8 in Figure 1). The weight of entries and exits relative to the second-hand market trade depends on the geographical scale of analysis: entries and exit flows are likely to dominate smaller geographical units of analysis with a reduced second-hand market. Neighbouring effects between geographical units might also arise for smaller units of analysis, thereby impacting entry and exit (as defined in this paper).
The above conceptual framework identifies, for a given land-based geographical area, impacts of vessel flows and owner flows on the fleet evolution (size and nature). Direct impact refers to changes in the fleet induced by (direct) vessel flows, and indirect impact refers to changes in the fleet associated with owners flows (indirect impact of owner flows on the fleet). This framework also suggests that vessels flows are not independent from owner flows whilst not being necessarily fully correlated.
The following Sections illustrate the above conceptual framework by taking the French Atlantic fleet as a case study.
3. POLICY CONTEXT, VESSELS AND OWNER POPULATION IN THE
FRENCH ATLANTIC FLEET
To illustrate our conceptual framework, the group of vessels of interest considered here is registered in the French Atlantic. This area is relatively well monitored and has therefore good available data. Vessel numbers are taken as a measure of capacity available across the whole time-period considered.
Fishery policy has been set from the 1970s into the Common Fishery Policy (CFP), a common European framework. Each European Member State is responsible for implementing this common framework. In France, the fishing capacity reduction policies implemented within the Common Fishery Policy have relied on the combination of limited entry and decommissioning schemes. A permit to fish ("Permis de Mise en Exploitation", P.M.E.) has been required from 1988 for fishing vessels to operate (Decision of the "Comité Central des Pêches Maritimes", 22 September 1988).
This permit to fish is attached to the vessel and cannot be traded separately (as determined by a 1852 decree on maritime fishing practice, "Décret du 9 janvier 1852 sur l'exercice de la pêche maritime"). It is very likely that most vessel scrapping is subsidised by decommissioning schemes, but this was not quantifiable in this study because of the available data.
The geographical unit of analysis is the French Atlantic which covers all land-based maritime districts of the Western French coast i.e. on the North Sea, the English Channel and the Atlantic Ocean.
The data used in this analysis have been collected by Ifremer's Fisheries Observatory from the French Fleet Register. In particular, the data include vessel characteristics (size, fishing segment, age) and owner characteristics (age) from 1994 to 2008, which are used for this analysis. Data on fleet segments are available from 2000 only. The fleet segments used in this paper correspond to the ones defined in the Data Collection Framework (Commission Regulation (EC) No. 665/2008 of the 14 July 2008). The data have been collected on the overall fleet every calendar year on December 31st. Flow indicators (entry, exit and change of owner or fleet segment) are derived by comparing the national fleet composition between two consecutive years. Indicators of change based on comparison of fleet composition at lower time scales (e.g. month) will show greater temporary movements of vessels (resumed/suspended activity) and owners (temporary entry/exit) compared to the yearly time csale chosen here. The time scale does not affect the import/export flows and new builts/scrapped vessel flows, nor the first entry/permanent exit of owners. All fleet segments are considered together here,
but the same analysis could be conducted for a given fleet segment.
Economic indicators on the French fishing fleet have been collected every year since 2001. The sampling plan is detailed in Van Iseghem et al. (2011) and allows valid and reliable extrapolations to the whole fishing fleet. Economic indicators for 2007 are detailed in Van Iseghem et al. (2011). Deducting the fuel costs and variable costs from the gross revenue and dividing them by the number of crew members leads to rough estimates of crew remuneration (Euro/full-time equivalent crew member). These estimates are around 20,000 Euro for small vessel segments (<10m), and much higher for larger vessels. Smaller vessels hardly remunerate the fishers compared to unemployment benefits. Economic behaviour for entry and exit of these vessels might differ from larger vessels. This paper considers overall entry and exits regardless of fleet segments.
The summary statistics used in the following Sections to illustrate the conceptual framework have been produced from this specific dataset.
4. EMPIRICAL APPLICATION: DIRECT IMPACT OF VESSEL FLOWS
ON THE FRENCH ATLANTIC FLEET
In this paper, the fleet considered is measured in terms of vessel numbers to illustrate the conceptual framework, from 1994 to 2008.
Figure 2: Vessel fleet and owner population
The total fleet steadily decreased for the Atlantic fleet from 5,100 vessels in 1993 to 3,663 vessels in 2008 (by 28%), corresponding to an average decrease of 93 vessels/year (R2=0.97) as shown in Figure 2. In 1993, the average vessel in the fleet is 12.1 m long and 15.1 years old, with a gross tonnage of 35 GT and an engine of 174 kW (fleet segments are not available before 2000). In 2008, the average vessel in the fleet is the same length as in 1993 (12.1 m long) and 22.3 years old (7.2 years older than in 1993), with a gross tonnage of 47 GT (12 GT more than in 1993), an engine of 184 kW (10 kW more than in 1993), and most frequently belongs to the fleet segment of Demersal trawlers and/or demersal seiners (833 / 3,663 vessels).
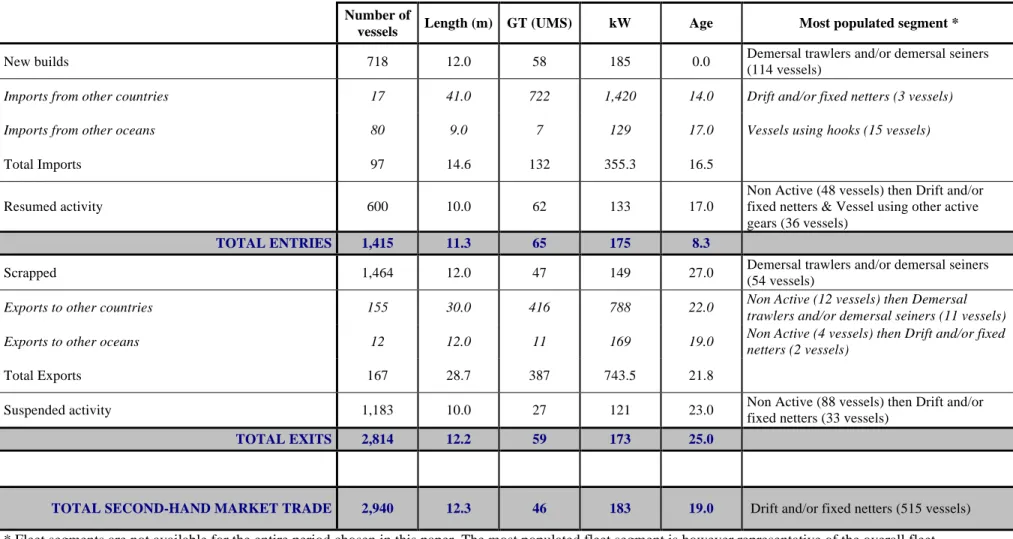
From 1994 to 2008, a total number of 1,415 vessels entered the French Atlantic fleet of which 718 (51%) were constructed, 600 (42%) resumed their activity and 97 (7%) were imported (from other oceans or countries). In the same period, a total number of 2,814 vessels left the French Atlantic fleet of which 1,464 (52%) were scrapped, 1,183 (42%) suspended their activity and 167 (6%) were exported (to other oceans or countries). These numbers are represented in Figure 3. A total of 2,940 vessels have been exchanged over 1994-2008 on the Atlantic fleet second-hand market. All these figures are subject to annual variations. Average characteristics of the vessels are summed up for each type of flow in Table 1.
Table 1: Size and nature of the different vessel flows (1994-2008) Number of
vessels Length (m) GT (UMS) kW Age Most populated segment *
New builds 718 12.0 58 185 0.0 Demersal trawlers and/or demersal seiners
(114 vessels)
Imports from other countries 17 41.0 722 1,420 14.0 Drift and/or fixed netters (3 vessels)
Imports from other oceans 80 9.0 7 129 17.0 Vessels using hooks (15 vessels)
Total Imports 97 14.6 132 355.3 16.5
Resumed activity 600 10.0 62 133 17.0
Non Active (48 vessels) then Drift and/or fixed netters & Vessel using other active gears (36 vessels)
TOTAL ENTRIES 1,415 11.3 65 175 8.3
Scrapped 1,464 12.0 47 149 27.0 Demersal trawlers and/or demersal seiners
(54 vessels)
Exports to other countries 155 30.0 416 788 22.0 Non Active (12 vessels) then Demersal
trawlers and/or demersal seiners (11 vessels)
Exports to other oceans 12 12.0 11 169 19.0 Non Active (4 vessels) then Drift and/or fixed
netters (2 vessels)
Total Exports 167 28.7 387 743.5 21.8
Suspended activity 1,183 10.0 27 121 23.0 Non Active (88 vessels) then Drift and/or fixed netters (33 vessels)
TOTAL EXITS 2,814 12.2 59 173 25.0
TOTAL SECOND-HAND MARKET TRADE 2,940 12.3 46 183 19.0 Drift and/or fixed netters (515 vessels) * Fleet segments are not available for the entire period chosen in this paper. The most populated fleet segment is however representative of the overall fleet.
A net total of 1,399 vessels left the French Atlantic from 1994 to 2008 from this analysis, which corresponds to 97% of the overall decrease in fleet size described in the previous section. The other 3% correspond to missing data on the types of vessel entry or exit. There are some marked differences in the vessel flow size and vessel characteristics across the different vessel flows. The fleet evolution (size and nature) would thus depend on the relative size of the different vessel entries and exits from the geographical area. The structural changes within the fleet could be reinforced by the operation of the second-hand market leading to changes in fleet segments.
These trends are consistent with previous analyses of fleet structure and evolution, showing an overall decrease in fleet sizes (see for instance the Danish and Dutch fleet analyses by Frost et al., 1995, and the different case studies in Curtis and Squires, 2004). This analysis however identifies different characteristics varying across the flow types. The analysis also shows varying characteristics of fleet activity flows (i.e. resumed or suspended vessel activity) and of fleet renewal flows (i.e. constructions and destructions). Fleet activity changes do not involve any permanent decision but a temporary suspension of activity and can constitute fleet size adaptations on a relatively short time horizon. Fleet renewal flows however involve new investments and would relate to decisions on the longer run. Fleet segments differ across flows, suggesting technological differences are important determinants for the types of entry and exit (Sampson, 1992).
5. EMPIRICAL APPLICATION: INDIRECT IMPACT OF OWNER
FLOWS ON THE FRENCH ATLANTIC FLEET
As shown in Figure 2, and parrallel to the decrease in vessel numbers, the number of owners in the fleet register has decreased less substantially from 3,510 in 1993 to 3,216 in 2008 (by 10%), with the highest number of owners (3,823) in 1999. There was an average increase of 53 owners per year (R2=0.96) before 1999, and an average decrease of 68 owners per year (R2=0.98) after 1999. Despite the 1993 "fishing crisis" (Mesnil, 2008), fishers were attracted to the Atlantic fishery then seen as one of the most productive French fisheries. Fishing capital was concentrated after 1999, with more vessels per owner in the fleet on average. This decrease in owners’ numbers is mostly due to natural aging of the French population.
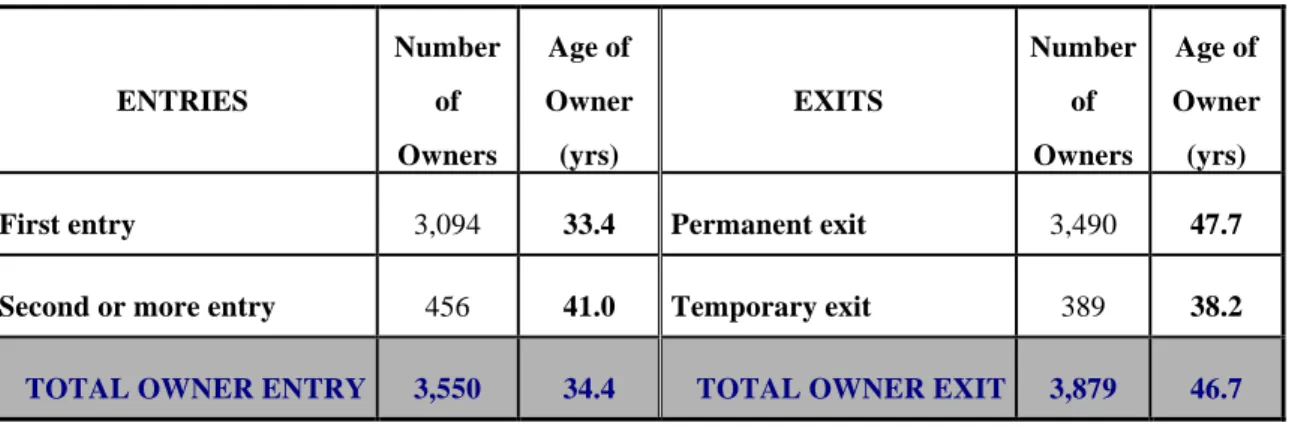
From 1994 to 2008, a total number of 3,550 owners have entered the French Atlantic. A huge majority (87%) of these owners have never operated there beforehand (First entry). Over the same period of time, a total number of 3,879 owners have left the French Atlantic, 90% of whom were never to return (Permanent exit). These numbers are represented in Figure 3. All these figures and the owner's average age have been summed up in Table 2.
Table 2: Size and average owner age for each owners flow (1994-2008) ENTRIES Number of Owners Age of Owner (yrs) EXITS Number of Owners Age of Owner (yrs) First entry 3,094 33.4 Permanent exit 3,490 47.7 Second or more entry 456 41.0 Temporary exit 389 38.2
TOTAL OWNER ENTRY 3,550 34.4 TOTAL OWNER EXIT 3,879 46.7
The analysis of entries and exits of owners leads to a net total of 329 owners leaving the French Atlantic between 1994 and 2008, which corresponds to 112% of the decrease observed in Figure 2. This discrepancy arises because of multiple entries and temporary exits. As expected entrants are on average 12.3 years younger than the owners leaving the French Atlantic (Table 2). This suggests a renewal of the owner population thanks to these younger entrants. However, this average hides some marked variations across the owner entry and exit flows combined to specific vessel flows. Models of vessel entries and exits often use owner’s age as a dependent variable, with younger vessel owners entering vessels and less young vessel owners more likely to scrap their vessels. Table 3 however shows that vessel destructions (exit) can arise for owners (38.3 year old for those leaving the fishing sector temporarily) younger than owners entering with a newly built vessel (39.6 year old for those entering the fishing sector for the second time or more). The owner's age, unless related to a specific type of vessel movement and its owner behaviour, does therefore not constitute a perfect proxy for vessel entry and exit as used in previous models of vessel entries and exits.
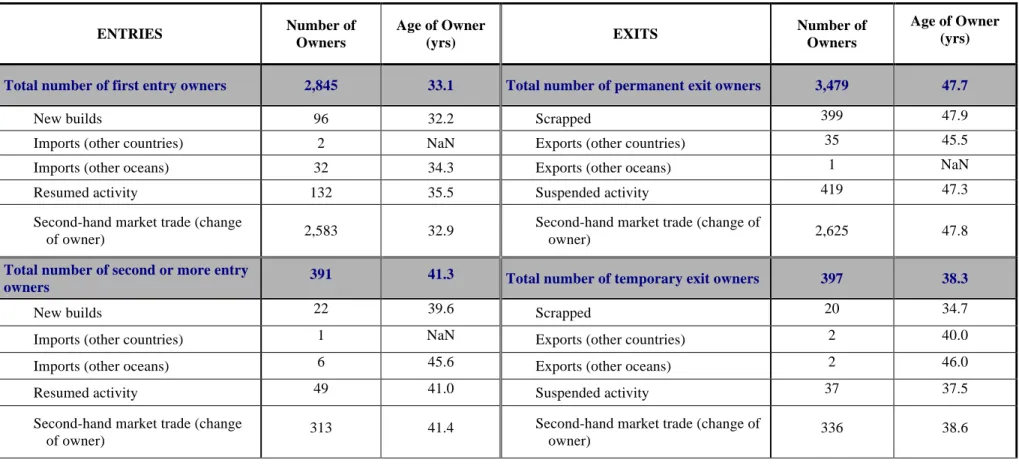
The decomposition of the flows of owners and the owner's average age have been summed up in Table 3. All these figures show that the majority (91%) of first entry owners have entered with second-hand vessels. 75% of Permanent exit owners sold their vessels on the second hand market. This is the same for owners for whom this is not the first entry or who temporary exit the fishery.
Table 3 decomposition of owner entry flows per vessel flow types in covers 92% of First entry owners in Table 2 (i.e. a sum of 2,845 across all vessel entry types divided by 3,094 First entry owners) and 86% of Second or more entry owners. The decomposition of owner exit flows per vessel flow types covers 99.7% of Permanent exit owners and 102% of Second or more entry owners. The percentage is greater than 100% for Temporary exit owners because they can leave the fleet several times with different associated vessel exits. They are counted only once in Table 2 but as many times as different vessel exits in Table 3.
In summary, there are some marked differences in the owner characteristics for each owner flow and across vessel flow types for a given owner flow. Sellers' (buyers') age will typically impact on supply (demand) of second-hand vessels, with older owners more likely to leave the fishing sector and increase supply of second-hand vessels. The vessel owner's age, as an underlying determinant for their own behaviours (entry and exit) and choices of vessel entry and exit, would consequently influence the vessel trade.
Table 3: Size of the different owners flows and the average owner age, decomposed along their associated vessel flows (1994-2008) ENTRIES Number of Owners Age of Owner (yrs) EXITS Number of Owners Age of Owner (yrs)
Total number of first entry owners 2,845 33.1 Total number of permanent exit owners 3,479 47.7
New builds 96 32.2 Scrapped 399 47.9
Imports (other countries) 2 NaN Exports (other countries) 35 45.5
Imports (other oceans) 32 34.3 Exports (other oceans) 1 NaN
Resumed activity 132 35.5 Suspended activity 419 47.3
Second-hand market trade (change
of owner) 2,583 32.9
Second-hand market trade (change of
owner) 2,625 47.8
Total number of second or more entry
owners 391 41.3 Total number of temporary exit owners 397 38.3
New builds 22 39.6 Scrapped 20 34.7
Imports (other countries) 1 NaN Exports (other countries) 2 40.0
Imports (other oceans) 6 45.6 Exports (other oceans) 2 46.0
Resumed activity 49 41.0 Suspended activity 37 37.5
Second-hand market trade (change
of owner) 313 41.4
Second-hand market trade (change of
6. CONCLUSIONS AND POLICY IMPLICATIONS FOR FISHERY
MANAGEMENT
Following the shortfalls of recent capacity management policies, a more complete framework needed to be derived to better understand fleet dynamics and increase the fisheries economic efficiency. The framework described is based on an analysis of flows impacting on the fleet for a given geographical area. This framework allows to exhaustively identify and quantify the impact on the fleet of different types of flows. This framework has allowed to identify a combination of direct impacts of vessel flows on the fleet and indirect impacts of owners' flows. This analysis showed marked differences in the size and nature of entry and exit flows of vessels and owners.
Data for the French Atlantic over 1994-2008 have been used to illustrate both types of impacts. This analysis outlined that the evolution of the French fleet is described very well by the analysis of the vessel entry and exit flows. Scrapped vessels are the main flow of vessel exit whilst, despite the limited entry system in place, New builts constitute the main flow of vessel entry. Both vessel destructions and constructions are investment-related decisions, with introduction or removal of capital from the fishing sector. This suggests that fleet renewal is an important factor of fleet evolution and structural changes. This is consistent with the targeting of these flows by public capacity management policies over the time-period considered. However, resuming and suspending the vessel activity is comparable in size to these fleet renewal flows. This flexibility in the use of the current fleet does not involve any investment into new capital but rather decision on the use of existing capital. This suggests that the
capital investments, an important factor of fleet evolution. The number of vessel entries through resuming or suspending the vessel activity however decreased in time (not captured by aggregation for the whole time period). This suggests fleet renewal as the main flow behind fleet evolution. This analysis also outlined the second-hand market as the main vessel source for owner entry into the Atlantic. The data suggests some renewal of owners, with entrants younger than leavers in the Atlantic.
French fleet dynamics have been shown to be influenced by both owners and vessel flows, with both these flows not fully independent. Vessel entry/exit models could be easily refined by considering the type of owner flow associated to a vessel flow. Our results also showed that the second-hand market is the most prominent flow in relation to owner entries and exits, despite the subsidies for early retirement and vessel destructions provided during the studies time period. Our study shows that these notoriously inefficient types of subsidies would also have had a limited effectiveness in reducing fleet and owner numbers.
Management policies to this date typically target vessel characteristics without considering the associated owners' behaviours (i.e. owner's entry and exit). Also, these policies do not consider the types of entries and exits (e.g. fleet usage). This framework has outlined the need to take owners' behaviours (i.e. owner's entry and exit) into consideration as well as vessel flows (policy-induced or not) for effective capacity management and improvement of current vessel entry and exit models. These are crucial for better assessing, targeting and designing more effective overcapacity reduction policies.
The same type of analysis could be undertaken over various time-periods and geographical scales. The data used is part of the EU Fleet Register data, and the same type of analysis could easily be conducted at the European level or for other European Member States. A decrease in vessel numbers seems in some cases compensated by an increase in the average engine power per vessel, or associated to owners leaving the fleet on a permanent basis. Capacity measures other than vessel numbers could be used to further study fleet capacity evolution and corresponding flows. Further research could look into economic issues arising with asymmetric information between vessel owners and policy makers.
This suggests that improved capacity management policies would need to be designed as a combination of incentive for owner's entry and exit as well as better consideration of all types of vessel flows. In particular, the flows linked to changes in the fleet activity would need to be considered in addition to the flows behind fleet capital renewal. The reform of the Common Fisheries Policy (European Commission, 2009) currently considers the provision of incentives to owners through tradable quotas for adjustment of fleet capacity, which should encompass fleet activity flows as well as the constructions and destructions flows. The impact of this new management system on changes in both vessel and owner flows would however need to be assessed more specifically. This type of analysis could also be included to refine fisheries bio-economic models for improved assessment. This data is relatively accessible and not too costly to obtain so this approach could also be implemented for preliminary assessment of fishing capacity dynamics in fisheries where capacity management is limited. The
capacity management policies and owner's behaviours could also lead to distortions in the second-hand market, which would also need to be studied more specifically.
Our framework provides a good basis for improved analysis of capacity dynamics in relation to capital investment flows, capital usage flows and owners’ dynamics. It is however descriptive and does not provide any identified economic drivers of fleet evolution nor causal relation between the changes and flows. An analytical model could however be built based on our conceptual framework for further analysis. Another limitation is due to the temporary movements of owners in and out of the French fishing sector, leading to double counting of owners in the fleet when combined to vessel flows over the time period considered. A smaller timeframe could reduce this problem.
ACKNOWLEDGEMENTS
We are extremely grateful to the Editor of the ICES Journal of Marine Science, Sarah Kraak, and two anonymous reviewers for their helpful suggestions on previous versions of this paper. This paper is based on work initiated at Ifremer by Patrick Berthou. The authors are particularly grateful to Michèle Jézéquel, Fabienne Daurès, Emilie Leblond, Samuel Le Blond, and Damaris Phélippé for their expertise on the data and exchanges on the paper, and to Christelle Le Grand, Manuel Bellanger and Mathieu Merzéréaud for their valuable help with programming in R. This research was conducted whilst Emmanuelle Quillérou was a post-doctoral researcher at Ifremer.
REFERENCES
Décret du 9 janvier 1852 sur l'exercice de la pêche maritime [Online]. Journal Officiel
de la République Française. Available from:
http://www.legifrance.gouv.fr/affichTexte.do?cidTexte=LEGITEXT000006071 755&dateTexte=20101005# [Accessed05/10/2010].
Anderson, L. G. 2007. Does Capacity Analysis Help us Meet Fishery Policy and Management Objectives? Comments. Marine Resource Economics, 22: 89-93. Asche, F. 2007. Capacity Measurement in Fisheries: What Can We Learn? Marine
Resource Economics, 22: 105-108.
Asche, F., Eggert, H., Gudmundsson, E., Hoff, A. & Pascoe, S. 2008. Fisher's behaviour with individual vessel quotas - Over-capacity and potential rent: Five case studies. Marine Policy, 32: 920-927.
Bjorndal, T. & Conrad, J. M. 1987. Capital Dynamics in the North Sea Herring Fishery.
Marine Resource Economics, 4: 63-74.
Caddy, J. F. & Cochrane, K. L. 2001. A review of fisheries management past and present and some future perspectives for the third millennium. Ocean & Coastal
Management, 44: 653-682.
Cox, A. 2007. Capacity Analysis and Fisheries Management: Is the Tail Wagging the Dog? Marine Resource Economics, 22: 95-98.
Cueff, J.-C. 2007. A Case Study of Fishing Vessel Capacity Management Public Buyout
Schemes: Community Experience Through the Multi-Annual Guidance Programmes and Ways Forward, Blackwell Publishing.
Curtis, R. & Squires, D. 2004. Fisheries Buybacks, La Jolla, California, Blackwell Publishing.
Espino, D. C., Del Hoyo, J. J. G. & Sharp, B. M. H. 2005. Capacity and Capacity Utilization of the "Voracera" Fleet in the Strait of Gibraltar. Marine Resource
Economics, 20: 367-384.
European Commission. 2009. Green Paper Reform of the Common Fisheries Policy. Available:
http://eur-lex.europa.eu/LexUriServ/LexUriServ.do?uri=COM:2009:0163:FIN:EN:PDF [Accessed 18/05/2011].
FAO. 1999. International Plan of Action for reducing incidental catch of seabirds in longline fisheries. International Plan of Action for the conservation and management of sharks. International Plan of Action for the management of fishing capacity. Rome: Food and Agriculture Organization of the United Nations,. Available: http://www.fao.org/DOCREP/006/X3170E/x3170e00.htm [Accessed 18/05/2011].
FAO. 2010. The State of World Fisheries and Aquaculture 2010. In: Department, F. F. a. A. (ed.) State of World Fisheries and Aquaculture. Rome: Food and Agriculture Organization of the United Nations,. Available: http://www.fao.org/docrep/013/i1820e/i1820e00.htm [Accessed 18/05/2011]. Frost, H., Lanters, R., Smit, J. & Sparre, P. 1995. An appraisal of the effects of the
decommissioning scheme in the case of Denmark and the Netherlands. Esbjerg: Danish Institute of Fisheries Economics Research. [Accessed].
Fulton, E. A., Smith, A. D. M., Smith, D. C. & Van Putten, I. E. 2011. Human behaviour: the key source of uncertainty in fisheries management. Fish and
Garcia, S. M., and Grainger, R. J. 2005. Gloom and Doom? The Future of Marine Capture Fisheries. Philosophical Transactions of the Royal Society B: Biological
Sciences, 360:21-46.
Grafton, R. Q. 2006. Incentive-based approaches to sustainable fisheries. Can. J. Fish.
Aquat. Sci. Canada.
Gréboval, D. 1999. Managing Fishing Capacity: Selected Papers on Underlying Concepts and Issues. FAO Fisheries Technical Paper. Available: http://www.fao.org/docrep/003/X2250E/x2250e00.htm [Accessed 28/07/2010]. Guyader, O. 2002. Simulating the effect of regulatory systems in a fishery - An
application to the French driftnet albacore fleet. Environmental & Resource
Economics, 23: 1-28.
Hoff, A. & Frost, H. 2007. Optimal Vessel Quotas and Capacity of a Danish Trawler Fleet Segment: A Dual Approach. Marine Resource Economics, 22: 1-14.
Jensen, C. L. 1998. Investment behavior and tax policy. Marine Resource Economics. Kirkley, J., Morrison Paul, C. J. & Squires, D. 2004. Deterministic and Stochastic
Capacity Estimation for Fishery Capacity Reduction. Marine Resource
Economics, 19: 271-294.
Lindebo, E. 2005a. Multi-national Industry Capacity in the North Sea Flatfish Fishery.
Marine Resource Economics, 20: 385-406.
Lindebo, E. 2005b. Role of Subsidies in EU Fleet Capacity Management. Marine
Resource Economics, 20: 445-466.
Mardle, S., Thébaud, O., Guyader, O., Hutton, T., Prellezo, R. & Travers, M. 2006. Empirical analysis of fishing fleet dynamics: entry, stay and exit choices in selected fisheries Bioecon conference. Cambridge. August 2006.
Mesnil, B. 2008. Public-aided crises in the French fishing sector. Ocean & Coastal
Management, 51: 689-700.
Nostbakken, L., Thebaud, O., Sorensen, L.C. 2011. Investment Behaviour and Capacity Adjustment in Fisheries: A Survey of the Literature. Marine Resource
Economics, 26(2), 95-117.
Pascoe, S. 2007. Capacity Analysis and Fisheries Policy: Theory versus Practice.
Marine Resource Economics, 22: 83-87.
Pradhan, N. C. & Leung, P. 2004. Modeling entry, stay, and exit decisions of the longline fishers in Hawaii. Marine Policy, 28: 311-324.
Quillérou, E., N. Roudaut, and O. Guyader 2011. Managing fleet capacity: national policies and regional market redistribution. Submitted to Fisheries Research, under review.
Reid, C., Squires, D., Jeon, Y., Rodwell, L. & Clarke, R. 2003. An analysis of fishing capacity in the western and central Pacific Ocean tuna fishery and management implications. Marine Policy, 27: 449-469.
Salas, S. & Gaertner, D. 2004. The behavioural dynamics of fishers: management implications. Fish and Fisheries, 5: 153-167.
Sampson, D. B. 1992. Fishing Technology and Fleet Dynamics: Predictions from a Bioeconomic Model. Marine Resource Economics, 7: 37-58.
Squires, D., Jeon, Y., Grafton, R. Q. & Kirkley, J. 2010. Controlling excess capacity in common-pool resource industries: the transition from input to output controls.
Sumaila, U. R., Khan, A., Watson, R., Munro, G., Zeller, D., Baron, N. & Pauly, D. 2007. The world trade organization and global fisheries sustainability. Fisheries
Research, 88: 1-4.
TECTAC. 2005. Technological developments and tactical adaptations of important E.U. fleets (TECTAC). Final Report. In: Marchal, P. (ed.) EU project no.
Q5RS-2002-01291. Ifremer (coord.). Available:
http://cafe.jrc.ec.europa.eu/c/document_library/get_file?p_l_id=1774&folderId= 2480&name=DLFE-94.doc [Accessed 18/05/2011].
Tidd, A. N., Hutton, T., Kell, L. T., and Padda, G. 2011. Exit and entry of fishing vessels: an evaluation of factors affecting investment decisions in the North Sea English beam trawl fleet. ICES Journal of Marine Science: Journal du Conseil, 68: 961–971.
Tingley, D. & Pascoe, S. 2005. Eliminating Excess Capacity: Implications for the Scottish Fishing Industry. Marine Resource Economics, 20: 407-424.
Townsend, R. E. 1990. Entry Restrictions in the Fishery: A Survey of the Evidence.
Land Economics, 66: 359-378.
Townsend, R. E. 2010. Transactions costs as an obstacle to fisheries self-governance in New Zealand. Australian Journal of Agricultural and Resource Economics, 54: 301-320.
Van Hoof, L. & De Wilde, J. W. 2005. Capacity Assessment of the Dutch Beam-trawler Fleet using Data Envelopment Analysis (DEA). Marine Resource Economics, 20: 327-345.
Van Iseghem, S., Quillérou, E., Brigaudeau, C., Macher, C., Guyader, O., Daurès, F., 2011. Ensuring representative economic data: survey data-collection methods in France for implementing the Common Fisheries Policy. ICES Journal of Marine Science: Journal du Conseil, 68(8): 1792–1799.
Villasante, S. 2010. Global assessment of the European Union fishing fleet: An update.
Marine Policy, 34: 663-670.
Whitmarsh, D. J. 1998. The Fisheries Treadmill. Land Economics, 74: 422-427.
Wilen, J. E. 1988. Limited Entry Licensing: A Retrospective Assessment. Marine
Resource Economics, 5: 313-324.
Wilen, J. E. 2007. Thoughts on Capacity Analysis: Is Capacity Analysis Giving Policy Makers Information they Need? Marine Resource Economics, 22: 79-82.