Technical
Paper
Abstract
In the context of global climate change, variations in sea surface temperature, sea level change and latitudinal shifts of oceanographic currents are expected to affect marine biodiversity of the sub-Antarctic islands located near the polar front, such as the Kerguelen Islands, particularly in coastal waters. Sampling sites of previous oceanographic programmes focused on the Kerguelen Islands were revis-ited during three scientific summer cruises aboard the trawler La Curieuse (2011–2014). Among 18 coastal sites explored using scuba diving, 8 were selected for monitoring, as representative of the Kerguelen sub-Antarctic marine habitats, to be progressively equipped with sensors and settlement plots. Remotely operated vehicle (ROV) observa-tions and beam trawling (at 50 m and 100 m) have also been used to contextualise them. Eight sites – in the Morbihan Bay (4), and in the north (2) and south (2) of the Kerguelen Islands – are now monitored by photo and video surveys, with temperature loggers installed at 5 m and 15 m depth, and settlement plots at about 10 m depth. Temperature data have been recovered yearly since 2011 at some sites (those equipped first). Biodiversity found on settlement plots will be characterised yearly by metagenomics. The often harsh conditions at sea involve using robust underwater equipment and simple investigation techniques and protocols to ensure the permanence and the reliability of the equipment installed.
Keywords: sub-Antarctic, climate change, frontal shifts,
coastal habitats, benthos monitoring, thermo-recorders, set-tlement plots
1. Climate change and the sub-Antarctic
islands
The sub-Antarctic islands are those islands of the Southern Ocean north of and adjacent to the Ant-arctic convergence, or the polar front, a geographic situation which gives them particular climatic, oceanographic and biogeographic features (Table 1). Studies undertaken at the Prince Edward Islands in the Indian sector of the Southern Ocean have all reported a rise of over 1 °C in sea surface tempera-ture since 1949 (Mélice et al., 2003; Ansorge et al., 2009; Ansorge et al., 2014). Over the same time period, a decrease in rainfall, an increase in extreme events and in wind speed, and an annual rise of the sunshine hours have been observed since the 1950s (Smith, 2002; Mélice et al., 2003; Le Roux and McGeoch, 2008).
It has been proposed that such climate changes correspond in time to a southward shift of the Ant-arctic circumpolar current (ACC) and in particular its frontal systems, the sub-Antarctic front and the polar front, in between which the islands are located (Allan et al., 2013). Recent observations indicate that this highly dynamic region is undergoing
PROTEKER: implementation of a submarine
observatory at the Kerguelen Islands
(Southern Ocean)
Jean-Pierre Féral*1, Thomas Saucède2, Elie Poulin3, Christian Marschal1, Gilles Marty4, Jean-Claude
Roca5, Sébastien Motreuil2 and Jean-Pierre Beurier6
1 AMU/CNRS/IRD/UAPV, IMBE-Institut Méditerranéen de Biologie et d’Ecologie marine et continentale, UMR
7263, Station Marine d’Endoume, Marseille, France
2 UMR 6282 Biogéosciences, Univ. Bourgogne Franche-Comté, CNRS, Dijon, France
3 Laboratorio de Ecología Molecular, Instituto de Ecología y Biodiversidad, Universidad de Chile, Santiago, Chile 4 Réserve Nationale Naturelle des Terres Australes Françaises, Rue Gabriel Dejean, Saint Pierre, Ile de la Réunion,
France
5 UPMC/CNRS, Service plongée, Observatoire Océanologique de Banyuls-sur-Mer, France 6 Université de Nantes, Centre de droit maritime et océanique, Nantes, France
Received 17 July 2016; Accepted 20 September 2016
change in response to a warming climate. Climate change impacts on those islands are varied, and are both direct and indirect: glacier retreat, temperature increase as well as decrease in precipitation, generating favourable conditions for introduced species and marine biodiversity modification (Smith, 2002; Pendlebury and Barnes-Keoghan, 2007; Allan et al., 2013; Kargel et al., 2014; Molinos et al., 2015; Byrne et al., 2016).
2. Kerguelen geography and climate
The Kerguelen Archipelago is located south of the southern Indian Ocean (48°30'–50°S, 68°27'–70°35'E). Also known as the Desolation Islands, the archipelago comprises 300 islands or so, islets, and reefs. The Kerguelen Islands are ~2000 km away from the coasts of Antarctica, ~3400 km from Reunion Island and ~4800 km from the Australian coast. The archipelago covers 7200 km² and has nearly 2800 km of shoreline.
Climate in the Kerguelen is cold oceanic and not polar. Seasons are slightly differentiated but rain is constant. However, precipitation is quite low (850 mm) considering the high frequency (246 days). The mean annual aerial temperature is 5 °C with an annual range of 6 °C. The coldest temperature ever recorded was –9.8 °C during winter 2014. The archipelago is extremely windy. The western coast faces almost continuous winds of an average speed of 35 km.h–1, owing to the island’s location in between
the Roaring Forties and the Furious Fifties. Wind
speeds of 150 km.h–1 are common and can even
reach 200 km.h–1. Waves up to 12 m–15 m high are
also common.
3. Kerguelen hydrology
Isolated in the southern Indian Ocean, the Kerguelen Islands emerge from the Kerguelen-Heard Plateau
and stand on the Antarctic circumpolar current. This current provides predictably productive foraging for many species; it is considered a key feature of the Southern Ocean and a primary factor shaping Southern Ocean ecosystems (Tynan, 1998). The archipelago is located in a dynamic oceanographic area positioned at the confluence between several water masses, such as the Antarctic surface water, sub-Antarctic surface water and sub-tropical surface water, near the polar front that is currently shifting south-wards (Weimerkirsch et al., 2003). This will likely lead to the coasts being bathed by waters of different tem-perature, salinity and nutrient contents and will thus impact near-shore ecosystem properties and functioning. In this framework, the knowledge of the actual position of the polar front is important to accurately estimate the time frame of the phenomena that will affect coastal biodiversity and ecosystem functioning. A 12-year-long satellite observation shows that the mean path of the polar front is asymmetric; its latitudinal position spans from 44 °S to 64 °S along its circumpolar path, reflecting the large spread in latitudinal position (Freeman and Lovenduski, 2016). An up-to-date location of the polar front around the Kerguelen Islands has been defined by Park et al. (2014), corresponding to the 2 °C isotherm (Fig 1). The polar front is a key indicator of circulation, surface concentration of nutrients and biogeography in the Southern Ocean, all of which is necessary for the contextualisation of observations, environments and stands. Its proximity to the Kerguelen islands allows the prediction of significant changes in marine life conditions (Scheffer et al., 2016).
4. The need for a long-term monitoring
programme
To be interpreted and for the potential trends to be identified, environmental changes must be
Table 1: Sub-Antarctic islands located north of and adjacent to the polar front.
Islands Geography Administration
Antipodes Islands 49°67'S 178°77'E New Zealand
Auckland Islands 50°42'S 166°05'E New Zealand
Bounty Islands 47°42'S 179°04'E New Zealand
Bouvet Island 54°26'S 03°24'E Norway
Campbell Island group 52°32'S 169°08'E New Zealand
Crozet Islands 46°25'S 51°59'E France
Diego Ramírez Islands 56°30'S 68°43'W Chile
Falkland Islands 51°42'S 57°51'W United Kingdom; claimed by Argentina
Heard Island and McDonald Islands 53°00'S 73°00'E Australia
Kerguelen Islands 49°15'S 69°35'E France
Macquarie Island 54°37'S 158°51'E Australia
Prince Edward Islands 46°46'S 37°51'E South Africa
Snares Islands 48°01'S 166°32'E New Zealand
South Georgia and South Sandwich Islands 54°17'S 36°30'W United Kingdom; claimed by Argentina Tierra del Fuego (islands associated with) 54°00'S 70°00'W Chile and Argentina Boundary, treaty of 1881
recorded, which requires the establishment of an integrated long-term observing system. This is the aim of the Institut Polaire Français Paul-Émile Victor (IPEV) programme no. 1044 – PROTEKER, which uses a multidisciplinary approach: oceano-graphic measurements; benthic mapping; and genetic, eco-physiological, isotopic and environ-mental analyses. In addition to the collection and monitoring of biodiversity, it also aims at providing scientific data to managers of the National Nature Reserve of the French Southern Lands (RNN TAAF) in charge of protection and conservation issues.
Therefore, the mid-term and long-term objectives are to:
• identify, track, attribute and predict ecosystem changes as the basis for vulnerability assessments and adaptive management; and
• provide sentinels of more widespread change in the sub-Antarctic area.
Key rese arch questions include:
• What are the changes occurring in sub-Antarctic near-shore ecosystems that are due to global change?
• What are the drivers of climate change impacts on sub-Antarctic near-shore ecosystems?
• Which species and/or processes are suitable for tracking the effects of environmental change? • What are the sensitivities of sub-Antarctic
ben-thic biodiversity to environmental stressors? What are the critical thresholds that would give rise to irreversible impacts?
The aim of this article is to present the Kerguelen underwater observatory, the selected monitored sites, their equipment and the very first results.
5. Strategy for the selection of the monitored
sites
The most efficient way to explore rocky shores is to dive in order to observe, collect and/or experi-ment. This technique was used at the Kerguelen Islands for the first time at the beginning of the 1960s. Scuba dives were done in the Morbihan Bay during the austral summer 1962–1963 down to 15 m depth. However, considering the Kerguelen’s harsh conditions and even if the sites to study are in the near-shore, a support vessel is needed even if dives are made in sheltered places. From 1970 to 1989 La Japonaise, an old converted 14 m long whaleboat moored at Port-aux-Français, was used for short coastal research programmes. However, she was not able to sail outside the Morbihan Bay. It was not until 1990 that it has been possible to work all around the main island and to implement more comprehensive programmes using the 24 m long trawler La Curieuse. One of the programmes was dedicated to the sub-Antarctic benthos and studied various issues in depth, including: autecology; synecology; life cycles; developmental biology; pop-ulation dynamics and genetics; phylogeography; phylogeny; and trophic web. The resulting knowl-edge served as the main basis for the design of the underwater observatory.
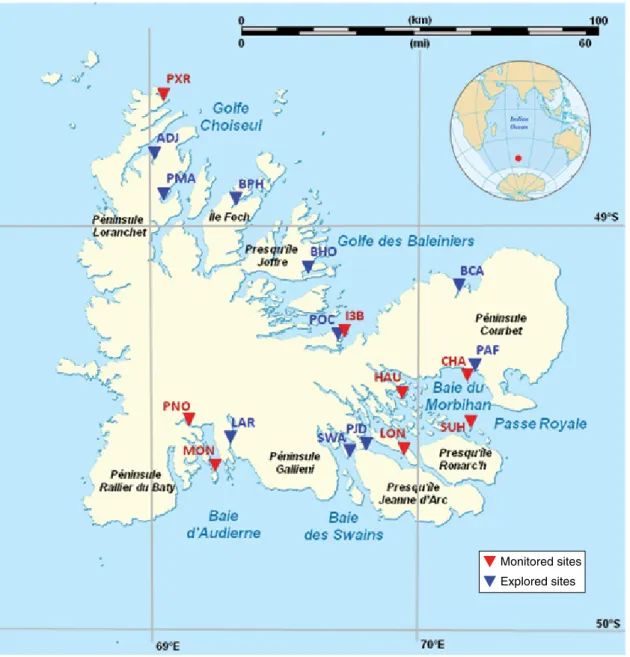
PROTEKER was launched during the austral summer 2011–2012. Several marine laboratories from France, Belgium and Chile have been involved. Eighteen near-shore sites of the main island (Fig 2) have been revisited by divers making observations, photo and video surveys, looking for the best places and ways to install loggers and settlement plots. The vicinity of the sites was explored down to 50 m and 100 m depth using a beam trawl and remotely operated vehicle (ROV) images.
6. Installed equipment
The equipped sites are to be visited yearly, but inclement weather conditions, lack of vessel or crew staff availability, and ineffective scheduling may prevent equipment being recovered. All these conditions suggest that the equipment should have long-term autonomy in addition to high resistance to harsh conditions.
6.1. Temperature loggers
Chosen for this programme was the HOBO® Water Temp Pro v2 Logger with an autonomy of 42 000
Fig 1: Location of the polar front (PF) and of the sub-Antarctic
front (SAF) in the vicinity of the Kerguelen Islands. The Kerguelen Plateau is a major bathymetric barrier to the eastward flowing Antarctic circumpolar current (black arrows). PF marks the boundary between Antarctica cold waters and warmer waters of the polar front area. It is defined as the northernmost extension of the Antarctic winter waters (lower than 2 °C). Expected latitudinal variations of frontal systems (PF and SAF) will create areas of water masses mixtures and/or will get waters of different characteristics (temperature, salinity, nutrients) in contact with the coastal benthos. Redrawn and simplified after Park et al. (2014).
measurements that makes a six-year autonomy for one measurement per hour. It is installed in a pro-tective PVC box attached to a threaded rod sealed in the substratum (Fig 3). Precision of sensors as specified by the manufacturer is ±0.2 °C, which is adequate in waters where temperature varies by several degrees a year. The logger is equipped with an optic USB interface for rapid data readout. Drift is estimated to be at 0.1 °C.yr-1.
6.2. Settlement clay plots
Using artificial substrata for comparing the colonisa-tion and growth dynamics of sessile assemblages under changing environmental conditions has proved
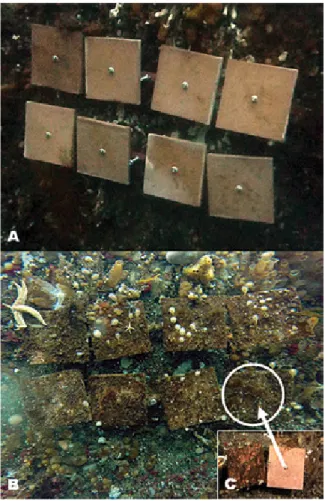
to be a valuable and handy technique (Sutherland, 1974), including in the Southern Ocean (Stanwell-Smith and Barnes, 1997; Bowden, 2005; Bowden et al., 2006). In the present work, the original association of settlement plots to temperature loggers allows precise monitoring of colonisation processes with regard to temperature variation. Eight 20 cm by 20 cm clay plots are deployed in two rows of four units on a stainless support, which is fixed to the substratum at each monitored site. Each plot is independent and can be collected separately in due course (Fig 4) fol-lowing an established protocol. Yearly exchange has been, and will continue to be, conducted in order to generate multiple temporal series of the settlement
Monitored sites Explored sites
Fig 2: Map of the monitored sites and of the other explored sites in order to validate the representativeness of the selected
ones.
Sector Morbihan. PAF: Port aux Français, HAU: Ile Haute, LON: Ile Longue, PJD: Port Jeanne d’Arc, Passe Royale, CHA: Ilot Channer, SUH: Ile Suhm, Swains SWA: Baie des Swains, Audierne LAR: Baie Larose, PNO: Fjord des Portes Noires, MON: Ile du Prince de Monaco, Choiseul PXR: Port Christmas, ADJ: Anse du Jardin, PMA: Port Matha, BPH: Baie Philippe, Baleiniers Baie du Hopehul, I3B: Ilot des Trois Bergers, POC: Port Couvreux, BCA: Baie des Cascades.
dynamics using clay plots (one to eight years). One plot is exchanged after the first year, giving data for a one-year-long settlement period. The exchanged plot and a second ‘old’ plot are then exchanged after the second year, giving data for a replicate of a
one-year-long experiment and for a two-year-long settlement experiment. This process is renewed each year (Fig 5). The datasets obtained will permit evaluation of
1. the different steps of the colonisation process (succession of fouling communities) over an eight-year period, with additional replicates for the first four years (nine replicates of one-year plots, six of two-year plots, three of three-year and two of four-year plots); and
2. spatial and temporal variation of the recruitment process.
When recovered from the sea after one year, the plot is constantly maintained in sea water until it is preserved in 95% ethanol after being photo-graphed overall and close-up, and then is cleaned of the largest fixed organisms, which are preserved separately. Each plot is labelled and safely pack-aged separately; then it is put in a container and repatriated to the laboratory in mainland France. Biodiversity on each settlement clay plot will be assessed macroscopically and through metabarcod-ing usmetabarcod-ing DNA based identification and high-throughput DNA sequencing.
7. Results of PROTEKER phase 1
7.1. Monitored sites
The first field campaign was conducted around the Kerguelen Islands on board La Curieuse from 12 December 2011 to 9 January 2012. It was dedicated to exploring and selecting the observation sites. Six sites were chosen and one or two temperature loggers were installed at 5 m and 15 m depth.
The second field campaign (30 November to 17 December 2013) made it possible to complete the system with seven monitored sites, north and south of the Kerguelen coast and in the Morbihan Bay. Temperature recorders were deployed as well as settlement clay plots.
The third and last scientific cruise took place during the austral summer 2014, from 18 November to 18 December, and achieved the first phase of the programme: the setting up of the Kerguelen under-water observatory consisting of temperature log-gers positioned at 5 m and 15 m depth and clay plots at 10 m depth, at eight sites.
The eight monitoring sites (four in the Morbi-han Bay, two along the northern coast and two along the south – see Fig 2 and Table 2) were cho-sen because they match the requirements of being representative of sub-Antarctic habitats and being in accessibility compliance with the safety standards of scuba diving.
Fig 3: Temperature logger installed at Ile Longue (15 m depth).
In order to facilitate the relocation of the logger, a white golf ball is fixed on the bolt to which the thermo-recorder in its protective boot is attached.
Fig 4: Settlement clay plots, T = 0 (December 2013) and
T = 1 year (December 2014) at Ile Suhm. They are immersed and set on rocky walls (A) to study organism settlement over time (B). Each year a tile is recovered. The removed tile is replaced by a new one (C).
Fig 5: Design of the eight-year-long experiment using clay settlement plots. The initial plots (see Table 2) are in blue. Red dots
indicate the exchanged/collected plots that turn to a different colour in subsequent years. The numbers in the plots indicate their age for the different years of the experiment (Yr_1, Yr_2, etc.).
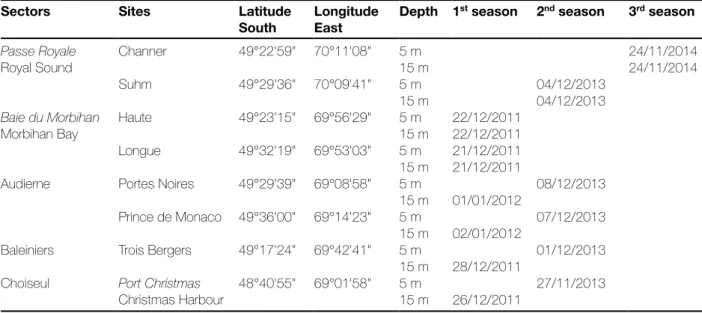
Table 2: Location of monitored sites and dates of installation of temperature loggers and settlement plates.
Sectors Sites Latitude
South Longitude East Depth 1
st season 2nd season 3rd season Passe Royale Royal Sound Channer 49°22'59" 70°11'08" 5 m 24/11/2014 15 m 24/11/2014 Suhm 49°29'36" 70°09'41" 5 m 04/12/2013 15 m 04/12/2013 Baie du Morbihan Morbihan Bay Haute 49°23'15" 69°56'29" 5 m 22/12/2011 15 m 22/12/2011 Longue 49°32'19" 69°53'03" 5 m 21/12/2011 15 m 21/12/2011
Audierne Portes Noires 49°29'39" 69°08'58" 5 m 08/12/2013
15 m 01/01/2012
Prince de Monaco 49°36'00" 69°14'23" 5 m 07/12/2013 15 m 02/01/2012
Baleiniers Trois Bergers 49°17'24" 69°42'41" 5 m 01/12/2013
15 m 28/12/2011 Choiseul Port Christmas
Christmas Harbour
48°40'55" 69°01'58" 5 m 27/11/2013 15 m 26/12/2011
7.2. Sea water temperature monitoring
Only temperature is currently and continuously measured. Results are posted on <www.proteker.net> and updated after each campaign. Due to time lags between logger installations over three summer campaigns and adverse meteorological conditions, gaps occurred in the temperature monitoring at certain sites. Despite this, from very preliminary
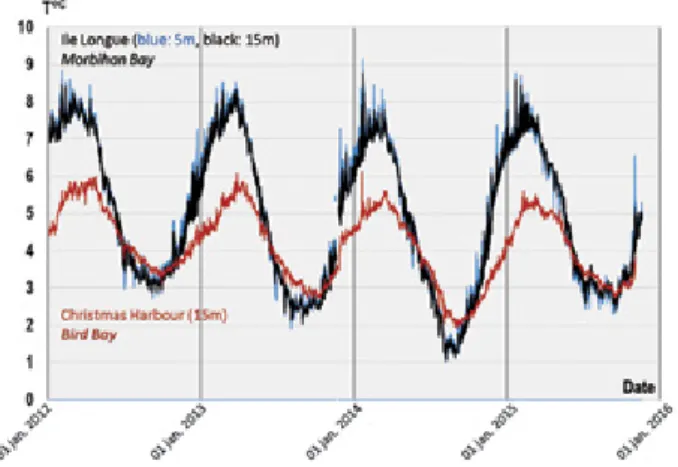
and somewhat incomplete results, seasonal variabil-ity and site differences were observed. A difference up to 8 °C may occur between summer and winter in the Morbihan Bay at 5 m depth and up to 7 °C at 15 m depth. These differences are smaller outside the bay, being from 3 °C to 6 °C at both depths. The maximum values recorded in the Morbihan Bay are 8.9 °C at 5 m and 8.2 °C at 15 m (Ile Longue).
They were 7.2 °C at 5 m and 7.0 °C at 15 m for the Ilot Channer. Concerning the minimum values, they were 1.1 °C (5 m) and 1.2 °C (15 m) for Ile Longue and 1.4 °C (5 m) and 1.5 °C (15 m) for Ile Suhm.
Along with a seasonal cycle, it was also observed that the sites outside the Morbihan Bay were the coldest overall, with respect to the maximum values. The lowest ones are all similar either in or out of the bay. During three successive winter seasons (2012–2014) minimum temperature decreased by 1 °C each year (3 °C to 1 °C) and increased to 2.5 °C in winter 2015. Fig 6 gives a comparative example (of depths and sites) of the most complete records.
In Fig 6, sea water temperature shows a regular seasonal cycle. The maximum temperatures are quite constant over the observed years, while the minimum ones show variations of more than 1 °C between successive years. The maximums are higher at Ile Longue (8.6 ± 0.2 °C) than at Christmas Harbour (5.7 ± 0.2 °C). The minimum average is 2.1 ± 0.7 °C at Ile Longue and 2.7 ± 0.5 °C at Christmas Harbour.
7.3. Colonisation dynamics monitoring
The colonisation dynamics will be estimated from the colonised clay plots recovered each year (metagenomics analysis).
8. Next step
The programme has just been renewed for four more years (2015–2018) to achieve, complement and widen the monitoring programme, and be able to analyse ecological responses of coastal marine biodiversity to climate change. The second step of the programme will consist of (1) complementing the monitoring of the equipped sites (equipment changing, observations and samplings associated to
settlement plots) and recording supplementary water parameters (pH, salinity, oxygen, turbidity); (2) benthic habitat mapping (using diving, towed gears, and ROV) to analyse mature assemblages where settlement plots were set up and according to depth, and (3) reinforcing the phylogeographic, trophic and ecological analyses performed on target taxa. Practically, the next step of the programme aims to:
• achieve metagenomics analyses;
• complete the network of equipped stations at relevant sites;
• update species inventories (using diving, towed gears, and ROV) in the vicinity of these sites; • publish illustrated field guides (photos, video)
and a database (indexing and cataloguing data, making them interoperable, traceable and com-patible with international systems, as well as con-textualising and illustrating them);
• set up new sensors (pH, salinity, oxygen, turbidity) based on the installation of a durable energy source (land-based photovoltaic/wind hybrid system); • estimate speed and quality of colonisation/
recruitment (settlement plots);
• choose model species with large distribution area or endemic (population genetics, phyloge-ography studies) to estimate connectivity or the existence of self-recruitment;
• contribute to the necessary scientific bases for a management plan of the coastal marine domain in the RNN TAAF; and
• train members of the RNN TAAF staff so they are capable of ensuring the long-term monitoring at the selected sites.
Meeting all the aforementioned objectives requires having dedicated and relevant means available for work at sea. In particular, it would require an appro-priate vessel to access the sites located outside the Morbihan Bay from which specific gear and activi-ties (ROV, beam trawls and diving) can be operated. Results are expected to allow the production of dis-tribution and sensitivity models for the coastal marine biodiversity of the Kerguelen Islands with regard to the expected environmental changes. The whole system will bring conservation managers the scientific grounds for determining how coastal zones should be protected and managed. PROTEKER makes up part of a larger observatory network in the Southern Ocean: it has joined the French Institut Écologie et Environement (INEE) Antarctic and sub-Antarctic workshop area (ZATA) and the Sci-entific Committee on Antarctic Research (SCAR) International Action Groups – the Antarctic Near-shore and Terrestrial Observing System (ANTOS) and the Integrated Science for the Sub-Antarctic (ISSA).
Fig 6: Temperature monitoring of sea water at sites in the
Morbihan Bay (Ile Longue) and outside (Bird Bay/Christmas Harbour) from 6 January 2012 to 9 December 2015.
Acknowledgments
This research was supported by IPEV (programme no. 1044) and by the IMBE team for management of biodiversity and natural habitats. We are indebted to the RNN TAAF for completing our team in the field with a scientific diver and making the semi-rigid ship Le Commerson (R Vergé, skipper) available in the Mor-bihan Bay. We thank the operational teams of the IPEV and of the TAAF for the logistics on the base of Port-aux-Français and on board the RV Marion-Dufresne II. We are particularly grateful to the cap-tains and the crews of the three scientific cruises of La Curieuse (B Aspa (chief engineer) [1], V Benard (mechanic trainee) [3], M Cadet (mechanic trainee) [2], B Caffier (cook/deckhand) [1, 2, 3], L Conillen (first mate) [1], A Daujat (captain) [1], C Hemmer (2nd engineer) [3], S Laffont (deckhand) [3], PY Le
Bren (chief engineer) [2], A Michelot (chief engi-neer) [3], Y Mucherie (captain) [2, 3], J Payet (deck-hand) [1], X Payet (deck(deck-hand) [2], Y Rivière (mechanic trainee) [1], A Sautron (2nd engineer) [1, 2], P Samuel
(first mate) [3], L Seguinneau (first mate) [2]. Post-ing of the temperature monitorPost-ing in the form of interactive graphics was possible thanks to R David, who installed the open source JavaScript charting library “dygraphs” on the PROTEKER website.
References
Allan EL, Froneman PW, Durgadoo JV, McQuaid CD, Ansorge IJ and Richoux NB. (2013). Critical indirect effects of climate change on sub-Antarctic ecosystem functioning. Ecology and Evolution 3: 2994–3004.
Ansorge IJ, Durgadoo JV and Pakhomov EA. (2009). Dynamics of physical and biological systems of the Prince Edward Islands in a changing climate. Papers and Proceedings of the
Tasmanian Royal Society. 143: 15–18.
Ansorge IJ, Durgadoo JV and Treasure AM. (2014). Senti-nels to climate change. The need for monitoring at South Africa’s Subantarctic laboratory. South African
Jour-nal of Science 110.
Bowden DA. (2005). Seasonality of recruitment in Antarctic sessile marine benthos. Marine Ecology Progress Series 297: 101–118.
Bowden DA, Clarke A, Peck LA and Barnes DKA. (2006). Antarctic sessile marine benthos: colonisation and growth on artificial substrata over three years. Marine
Ecology Progress Series 316: 1–16.
Byrne M, Gall M, Wolfe K and Agüera A (2016). From pole to pole: the potential for the Arctic seastar Asterias
amu-rensis to invade a warming Southern Ocean. Global Change Biology: doi:10.1111/gcb.13304.
Freeman NM and Lovenduski NS. (2016). Mapping the Antarctic Polar Front: weekly realizations from 2002 to 2014. Earth System Science Data 8:191–198.
Kargel JS, Bush ABG, Cogley JG, Leonard GJ, Raup BH, Smiraglia C, Pecci M and Ranzi R. (2014). A world of changing glaciers: Summary and climatic context. In:
Global Land Ice Measurements from Space, Kargel JS,
Leonard GJ, Bishop MP, Kääb A and Raup BH. (eds.). Berlin Heidelberg, Springer, 781–840.
Le Roux PC and McGeoch MA. (2008). Changes in climate extremes, variability and signature on sub-Antarctic Marion Island. Climatic Change 86: 309–329.
Mélice JL, Lutjeharms JRE, Rouault M and Ansorge IJ. (2003). Sea-surface temperatures at the sub-Antarctic islands Marion and Gough during the past 50 years. South
African Journal of Science 99: 363–366.
Molinos JG, Halpern BS, Schoeman DS, Brown CJ, Kiessling W, Moore PJ, Pandolfi JM, Poloczanska ES, Richardson AJ and Burrows MT. (2015). Climate velocity and the future global redistribution of marine biodiversity. Nature
Climate Change 6: 83–88.
Park YH, Durand I, Kestenare E, Rougier G, Zhou M, d’Ovidio F, Cotte C and Lee JH. (2014). Polar Front around the Kerguelen Islands: An up to-date determination and associated circulation of surface/subsurface waters. Journal
of Geophysical Research: Oceans 119: 6575–6592.
Pendlebury SF and Barnes-Keoghan LP. (2007). Climate and climate change in the sub-Antarctic. Papers and
Pro-ceedings of the Royal Society of Tasmania 141: 67–82.
Scheffer A, Trathan PN, Edmonston JG and Bost C-A. (2016). Combined influence of meso-scale circulation and bathymetry on the foraging behaviour of a diving predator, the king penguin (Aptenodytes patagonicus). Progress in Oceanography 141: 1–16.
Smith VR. (2002). Climate change in the sub-Antarctic: An illustration from Marion Island. Climatic Change 52: 345–357.
Stanwell-Smith D and Barnes DKA. (1997) Benthic community development in Antarctica: recruitment and growth on settlement panels at Signy Island. Journal of Experimental
Marine Biology and Ecology 212: 61–79.
Sutherland JP. (1974). Multiple stable points in natural communities. The American Naturalist 108: 859–873. Tynan CT. (1998). Ecological importance of the southern
boundary of the Antarctic Circumpolar Current. Nature
392: 708–710.
Weimerskirch H, Inchausti P, Guinet C and Barbraud C. (2003). Trends in birds and seals populations as indica-tors of a system shift in the Southern Ocean. Antarctic