To be cited as:
Borsa P., Daguin C., Bierne N. 2007. – Genomic reticulation indicates mixed ancestry in Southern-Hemisphere Mytilus spp. mussels. Biological Journal of the Linnean Society 92, 747-754.
Genomic reticulation indicates mixed ancestry in Southern-Hemisphere Mytilus spp. mussels
PHILIPPE BORSA1, CLAIRE DAGUIN2 and NICOLAS BIERNE3
1 Institut de Recherche pour le Développement, Département des Ressources Vivantes, Nouméa,
Nouvelle-Calédonie; 2 Evolution et Génétique des Populations Marines, Station Biologique de Roscoff, CNRS -
Université Pierre et Marie Curie UMR 7144, Roscoff cedex, France ; 3 Laboratoire Génome Populations
Interactions, CNRS - UMR 5171, Station Méditerranéenne de l'Environnement Littoral, Sète, France
Correspondence: Philippe Borsa, Institut de Recherche pour le Développement, BP A5, 98848 Nouméa Cedex, New Caledonia. Tel: +687 260741; Fax: +687 264326; E-mail: borsa@noumea.ird.nc
Previous surveys of allozyme variation in smooth-shell Mytilus spp. mussels have reported the presence in the Southern Hemisphere of both M. edulis and M. galloprovincialis mussels. Here, nuclear-DNA markers mac-1 and Glu-5'/Glu-3', both diagnostic for Northern-Hemisphere M. edulis and M. galloprovincialis, were used to further characterize the nuclear genomes of M. edulis from Kerguelen and M. galloprovincialis from Tasmania. Genomic reticulation was observed, with typical M. edulis allelomorphs fixed in both populations at locus mac-1 while at locus Glu-5'/Glu-3', allelomorphs characteristic of M. galloprovincialis were present in Kerguelen and nearly fixed in Tasmania. Kerguelen mussels had a genome of mixed M. edulis and M. galloprovincialis ancestry without evidence of barriers to merging as shown by Hardy-Weinberg and linkage equilibrium. Tasmanian mussels possessed a
predominantly M. galloprovincialis genomic background introgressed by M. edulis allelomorphs at locus mac-1. Genetic drift superimposed on ancient hybridization and introgression may explain the genomic reticulation observed in both Kerguelen and Tasmanian mussels. There was no evidence of a recent introduction of Northern-Hemisphere M. galloprovincialis or M. edulis to Kerguelen or Tasmania.
ADDITIONAL KEYWORDS: intron-length polymorphism; nuclear DNA; hybridization; introgression; geographic structure; antitropical distribution.
INTRODUCTION
Gene trees do not necessarily parallel the phylogeny of populations and species (Hey, 2001; Nichols, 2001) and patterns of allopatric differentiation among populations may vary according to the genetic marker under scrutiny. This has several causes such as stochastic variance in coalescence time, within-genome differences in effective population sizes (e.g. mitochondrial vs. nuclear), horizontal transfer of genes across incompletely isolated evolutionary units (i.e. introgression) and selection (Hudson & Turelli, 2003). When secondary contact occurs with partial genetic isolation, additional genomic heterogeneity may emerge due to differential introgression (Barton & Hewitt, 1985; Harrison, 1990). The flow of genes directly involved in reproductive isolation is closed by selection, while the homogenization of neutral markers is slowed down in proportion to their linkage disequilibrium with the former (Barton 1979, 1986).
Variable rates of admixture and introgression characterize Mytilus spp. assemblages in the Northern Hemisphere, where various pre- and post-zygotic isolation mechanisms have been described: habitat specialization (Skibinski, Beardmore & Cross, 1983; Bierne et al., 2002; 2003c), spawning asynchrony (Gardner & Skibinski, 1990; Secor, Day & Hilbish, 2001; Bierne et al., 2003c), assortative fertilization (Bierne et al., 2002) and hybrid depression (Beaumont, Abdul-Matin & Seed, 1993). Introgression seems to be variable across the genome as some loci are almost completely diagnostic whereas others do not allow discrimination between species (Skibinski, Beardmore & Cross, 1983; Rawson et al., 1996; Bierne et al., 2003a,b).
Allozymes separate Southern-Hemisphere Mytilus spp. populations into a group encompassing populations of mainland Australia, Tasmania and New Zealand (Australasia), that shows affinities with M. galloprovincialis from the western Mediterranean (the type locality for this species), and a South American group also including the Falkland and Kerguelen populations, which resembles typical M. edulis (McDonald, Seed & Koehn, 1991). The geographical distribution of the two female mitochondrial types that have been reported from the Southern Hemisphere (Hilbish et al., 2000) leads to a partly different view: only the Kerguelen population harbours haplotypes of the A clade characteristic of M. edulis; all the
other Mytilus spp. populations in the Southern Hemisphere mostly or exclusively harbour a distinct, endemic subclade D2 sister to subclade D1 (the latter consisting of haplotypes unique to Mediterranean M. galloprovincialis). Through analysis of size-polymorphism of intron 1 of the actin gene mac-1, we (Daguin & Borsa, 2000) found that Australasian M. galloprovincialis had allelomorphs characteristic of northeastern Atlantic M. edulis at a total frequency of 80-100%, highlighting the genetic distinctness of Australasian mussels relative to Northern-Hemisphere M. galloprovincialis and meanwhile suggesting introgression.
Here we further characterized Southern-Hemisphere Mytilus spp. populations from Tasmania and the Kerguelen Islands using nuclear DNA markers together with previously published allozyme data, to address their genetic relationships to Northern-Hemisphere M. edulis and M. galloprovincialis.
MATERIALS AND METHODS
Southern-Hemisphere Mytilus spp. were collected in the Kerguelen Islands and in
southeastern Tasmania (Table 1). The Tasmanian sample (TAS) consisted of six sub-samples that were chosen from a range of habitats varying from sheltered (CBL) to exposed (PAR), including a port city (HOB) where ballast water invasions are likely. This sampling strategy was designed to increase the likelihood that different forms (pure species, hybrids) be sampled in the case native mussels coexist, and eventually hybridize, with putative invaders. The mussels were either preserved frozen (Kerguelen sample) or in alcohol (all samples from Tasmania) prior to genotyping.
The DNA of each individual was extracted from muscle tissue using the Chelex 100 protocol (Walsh, Metzger & Higushi, 1991). DNA extracts were subjected to polymerase chain reaction (PCR)-amplification of a portion of intron 1 of the actin gene mac-1 (Daguin & Borsa, 1999), using forward and reverse primers
5’-CGTCTAGCGTAGTACTTAAATTG-3’ (there was a typing error in the original report) and 5’-CGAAAATTGTAGTCTAGTTTTGTG-3’, respectively; the Glu-5' fragment at the 5'-end of the polyphenolic adhesive protein gene (Rawson et al., 1996); and Glu-3' at the 3'-end of the same gene [Rawson et al. (1996), modified by labelling their PR-8 primer with 33P
and setting the annealing temperature at 51°C for 35 PCR cycles, instead of 45°C for 30 PCR cycles]. The two Glu markers are separated by approximately 2 kb (Rawson et al., 1996).
Size polymorphism of PCR-amplified fragments at locus mac-1 was scored according to methods detailed in Daguin & Borsa (1999). The same protocol was used for
distinguishing among the three size products at the Glu-3' locus [i.e. size-alleles (or allelomorphs) 214, 220 (Rawson et al., 1996) and 211, a number which refers to this novel allelomorph's approximate length in base pairs as extrapolated from a comparison with allelomorphs 214 and 220 on a side-by-side run]. Characterization of Glu-5' allelomorphs was as in Borsa et al. (1999).
f and θ, Weir & Cockerham's (1984) equivalents of Wright's Fis and Fst, were estimated from genotype frequencies at each locus using the procedureFSTATS of GENETIX (Belkhir et al., 1996). The significance of ^f-estimates was assessed by a two-tailed
permutation test (procedure PERMUTONS of GENETIX), with p=(n+1)/(N+1), where n is the number of pseudo-values whose absolute value =|observed ^f-value| and N is the number of permutations (Sokal & Rohlf, 1995). The significance of ^θ-estimates was assessed similarly by a one-tailed permutation test. Linkage disequilibrium between loci was estimated using the LINKDIS algorithm (Black & Krafsur, 1985) implemented in GENETIX. The
estimated value of R, the average allelomorph-pairwise correlation coefficient, was compared to zero using the χ² approximation of Weir (1979).
Data at seven allozyme loci (Ap, Est-D, Gpi, Lap, Mpi, Odh and Pgm) were gathered from several studies reporting geographic variation in Mytilus spp. populations (Table 1). The Northern-Hemisphere M. edulis reference sample was 'Skagerrak' of Väinölä & Hvilsom (1991) for all loci except Pgm, for which it was 'SWE' of Varvio, Koehn & Väinölä (1988), to complete the data set. Correspondences between electromorphs from different studies (Table2) were established on the basis of the similarities in the frequencies of the most common electromorphs and in the relative mobilities of the other electromorphs in the pairwise comparisons of samples 'Shinnecock' of McDonald, Seed & Koehn (1991) with 'Skagerrak' of Väinölä & Hvilsom (1991); 'Venice' of McDonald, Seed & Koehn (1991) with 'Palavas' of Quesada, Zapata & Alvarez (1995) and 'Galicia' of Väinölä & Hvilsom (1991) with each 'Los Angeles' of McDonald & Koehn (1988) and 'Laxe' of Quesada, Zapata & Alvarez (1995). To complete the 'Laxe' data set we used the Gpi ('Pgi') data for sample 'Portosin' of Quesada, Zapata & Alvarez (1995). Where uncertainties remained, electromorphs were grouped as indicated in Table 2.
To compare nuclear DNA and allozyme data on a range of samples, we assumed that the samples of the present study and those designated as their homologues in Table 1 were drawn from the same populations. This assumption is based on the respective geographical proximities of these locations, and on the observation that Mytilus spp. populations generally are genetically homogeneous over large distances outside of hybrid zones and areas of recent introduction (McDonald, Seed & Koehn, 1991; Quesada et al., 1995; Daguin & Borsa, 1999). Absolute genetic distances (Do: Gregorius, 1984; Katz & Goux, 1986) between pairs of populations were estimated.
RESULTS
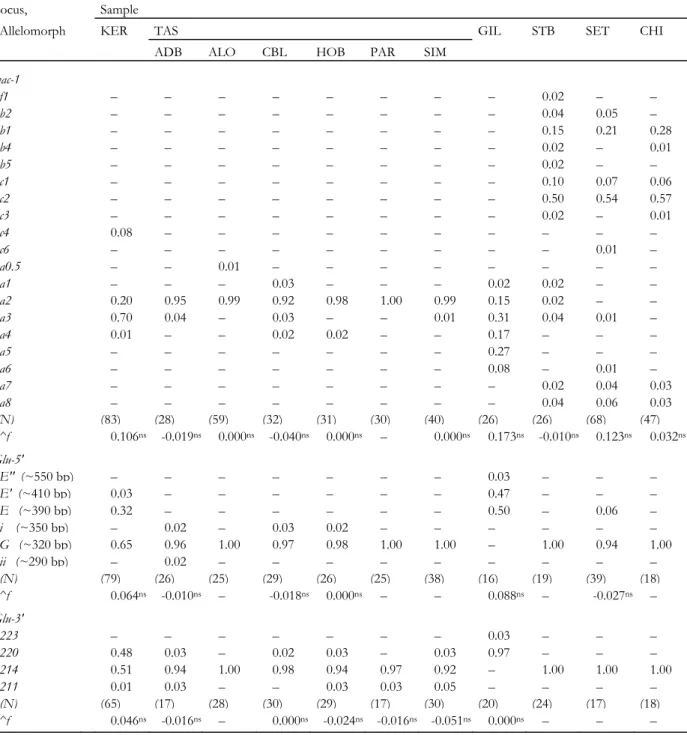
Allelomorph frequencies at loci mac-1, Glu-5' and Glu-3' in seven Mytilus spp. samples from the Southern Hemisphere (one from Kerguelen Islands, six from Tasmania) along with those of reference Northern-Hemisphere M. edulis and M. galloprovincialis are reported in Table 3. mac-1 allelomorph a3, which was common in M. edulis and almost absent in M.
galloprovincialis, was the most common in Kerguelen. The other mac-1 allelomorphs found in the KER sample (a2, a4, and c4) were all characteristic of northeastern Atlantic M. edulis. Kerguelen mussels possessed at Glu-5' both allelomorphs characteristic of M. edulis (E and E') and the allelomorph characteristic of M. galloprovincialis (G), and the same was observed at Glu-3’ with allelomorphs 220 and 214, respectively. mac-1 allelomorph a2 (otherwise known at substantial frequency from Northern-Hemisphere M. edulis only; Table 3) had a frequency >0.9 in all six samples from Tasmania. Three of the four other mac-1 allelomorphs encountered in Tasmania (a1, a3 and a4), all rare, were characteristic of
Northern-Hemisphere M. edulis. Allelomorph a0.5 was found only in sample ALO. Conversely, Tasmanian Mytilus samples possessed allelomorphs Glu-5' G and Glu-3' 214, which are characteristic of M. galloprovincialis, at high frequency. Allelomorphs E and E' at Glu-5'were absent from the Tasmanian samples.
The distribution of genotype frequencies did not depart from Hardy-Weinberg expectations as indicated by f-estimates, none of which was significant (Table 3). Slight genetic heterogeneity was possibly detected at locus mac-1, among samples from various habitats in southeastern Tasmania [Weir & Cockerham's (1984) ^θ=0.014; p<0.05]. No differences were evident at Glu-5' (^θ=0.003; p>0.28) nor Glu-3' (^θ=0.001; p>0.40). No linkage disequilibrium was found between mac-1 and Glu-5' in the Kerguelen population [^R=0.121 (N=65); χ²[6df]=7.23] nor mac-1 and Glu-3' [^R=0.131 (N=56); χ²[3df]=4.64]. As
expected from their tight physical linkage, strong linkage disequilibrium was observed between Glu-5' and Glu-3' [^R=0.532 (N=61); χ²[4df]=48.89: p<<0.001], although it did not
reach its maximal possible value. Recombinant Glu-5'/Glu-3' alleles were observed in both Kerguelen and Tasmanian populations, with frequencies of, respectively, 0.10 and 0.02, estimated from the ratio of recombinant di-locus genotype counts to the totals, after the double heterozygotes were excluded from the dataset.
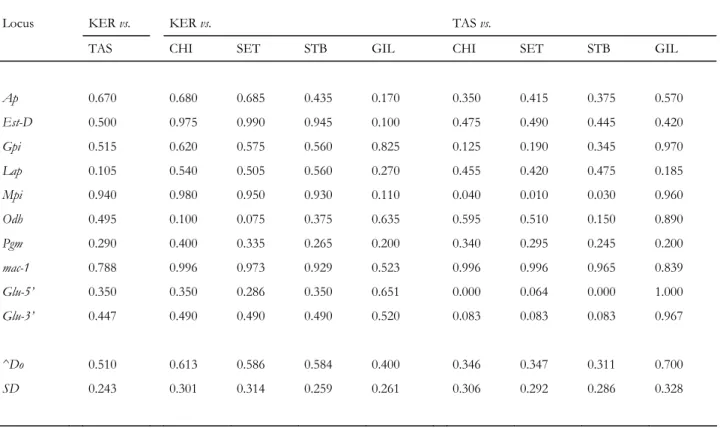
All nuclear loci taken together, the two Southern-Hemisphere Mytilus spp.
populations were clearly distinct from each other with an average ^Do (Table 4) of the same order as that between M. edulis and M. galloprovincialis. Tasmanian mussels were genetically closer to Northern-Hemisphere M. galloprovincialis than M. edulis while Kerguelen mussels were closer to Northern-Hemisphere M. edulis than M. galloprovincialis (Table 4). However, discrepancies among loci were evident in all the pairwise comparisons. Tasmanian mussels were genetically very close to M. galloprovincialis according to loci Glu-5' and Mpi, closer to M. galloprovincialis than to M. edulis at loci Ap, Gpi and Odh, closer to M. edulis at loci Lap, Est-D and Pgm and fixed for typical M. edulis allelomorphs at mac-1. Kerguelen mussels appeared to be close to Mediterranean M. galloprovincialis when considering allozyme locus Odh, while clearly different from this species at loci Est-D, mac-1, and Mpi, although close to M. edulis at loci Est-D and Mpi only (Table 4). In comparison, the genetic distance estimates between reference M. edulis and M. galloprovincialis were ^Do=0.729±0.317 (GIL / SET),
^Do=0.739±0.316 (GIL / CHI) and ^Do=0.692±0.338 (GIL / STB), while those among M. galloprovincialis populations from the north-eastern Atlantic and the Mediterranean were ^Do=0.136±0.124 (STB / SET) and ^Do=0.167±0.147 (STB / CHI) and ^Do=0.101±0.054 within the Mediterranean (SET / CHI).
DISCUSSION
The present results highlighted the distinct composition of Southern-Hemisphere Mytilus spp. populations relative to Northern-Hemisphere M. edulis and M. galloprovincialis. Allozyme-frequency differences between Tasmanian M. galloprovincialis and Kerguelen M. edulis, and their Northern-Hemisphere conspecifics (McDonald, Seed & Koehn, 1991; present results) indicate they are native rather than introduced. Both mitochondrial-DNA (Hilbish et al., 2000) and mac-1 data (present results) confirm that Tasmanian M. galloprovincialis are endemic. The same conclusion holds for Kerguelen M. edulis because of their unique, exclusive allelic composition at three nuclear-DNA loci.
Extreme inter-locus variance in allelic composition was also reported, which we interpret as evidence of past introgression as explained in the following.
In Tasmanian mussels, the quasi-fixation of M. edulis allelomorphs at some nuclear loci is at first view hardly compatible with the presence of typical M. galloprovincialis
allelomorphs at several other loci, as well as with mitochondrial-DNA data. Such a pattern of genomic reticulation in Tasmanian mussels indicates secondary contact with M. edulis either before or after the foundation of the Tasmanian population. When secondary contact occurs, gene flow can be restrained by partial genetic isolation, whose effect is to accentuate heterogeneity among neutral loci because of differential introgression rates (Barton & Hewitt, 1985; Barton, 1986; Harrison, 1990). The action of a semi-permeable barrier to gene flow on the inter-locus variance in introgression rate was described in Baltic Sea M. trossulus (Väinölä & Hvilsom, 1991; Bierne et al., 2003b). A proposed mechanism for the fixation of M. edulis mac-1 allelomorph a2 in Tasmanian M. galloprovincialis is genetic drift, perhaps due to the small size of the founding population or to subsequent reduction in effective population size, enhanced by the geographical isolation of Tasmania. Genetic drift likewise may explain the fixation or quasi-fixation of M. galloprovincialis-like allelomorphs at loci Gpi, Mpi, and Glu-5' in Tasmania. An alternative possibility is that mac-1 allelomorph a2 has been introgressing a M. galloprovincialis background by selection at a nearby locus (pseudo-selection). Under this scenario, a favourable gene previously fixed in a M. edulis-like population that came into
contact with the ancestral Tasmanian population would have easily crossed the inter-specific genetic barrier (Barton, 1979; Pialek & Barton, 1997) and neutral alleles at linked loci may have hitchhiked with it. Explaining that only one M. edulis allele, a2, has hitchhiked through the barrier would however require strong directional selection and / or tight linkage.
Kerguelen mussels were characterized by M. edulis allelomorphs at locus mac-1, and by a mixture of M. edulis- and M. galloprovincialis-like allelomorphs at Glu-5' and Glu-3'. There was no evidence that this mixture was either recent or maintained by reproductive isolation, because of the absence of significant heterozygote deficiencies at mac-1 and Glu-5' or Glu-3' (all polymorphic in the Kerguelen population) and the absence of significant linkage disequilibrium between mac-1 and either Glu-5' or Glu-3'. Taken together, allozyme and nuclear-DNA data thus demonstrated the genetic originality of the Kerguelen population, even though it simultaneously possesses at several loci allelomorphs that are characteristic of either M. edulis or M. galloprovincialis. The co-occurrence of the latter in the Kerguelen
population supports the hypothesis that its evolutionary history has been affected by hybridization between ancestors of these two species. This hybridization event is not likely to be recent because of the occurrence of recombinant Glu-5'/Glu-3' allelomorphs at a substantial frequency. For reasons similar to those raised hereabove to explain the genetic architecture of Tasmanian Mytilus, hybridization followed by genetic drift and pseudo-selection may explain that at some loci Kerguelen mussels exhibit affinities with Northern-Hemisphere M. galloprovincialis while other loci are fixed for M. edulis-like allelomorphs. It is worth noting that locus Glu-5' which up to now was considered to be fully diagnostic between M. edulis and M. galloprovincialis (Rawson et al., 1996; Borsa et al., 1999; Bierne et al., 2003a) has now been found polymorphic for hetero-specific alleles and at Hardy-Weinberg equilibrium in another genetic context than the M. edulis / M. galloprovincialis hybrid zone in the Northern Hemisphere. This result suggests that reproductive isolation between M. edulis- and M. galloprovincialis-like genomes may have been weaker in the Kerguelen Islands as it appears to be nowadays in the Northern Hemisphere. We speculate that the reproductive isolation genes putatively responsible for the strong barrier to gene flow at locus Glu-5' in the Northern Hemisphere (Bierne et al., 2003a) either had not yet evolved at the time when the contact occurred in Kerguelen, or did not produce a sufficient barrier under the
demographic and ecological conditions met in Kerguelen. Alternatively, the Glu-5'/Glu-3' polymorphisms may be old and pre-date the speciation events. However, this hypothesis seems less likely because it would imply that differential fixation had occurred in the Northern Hemisphere where distribution ranges are nonetheless much greater than in the small and isolated Kerguelen Islands.
ACKNOWLEDGEMENTS
We thank Y. Chérel and H. Weimerskirch for providing samples of Kerguelen mussels; R.D. Ward and E. Turner for stimulating discussions and correspondence; and Y. Chérel, C. Guinet, D. Guinet, J. Lallemand, M.J. Riddle, R.D. Ward, H. Weimerskirch and R.
Weimerskirch for help and hospitality in Tasmania. Funded in part by IFREMER URM 16, CNRS UMR 5000, and IRD DRV.
REFERENCES
Barton NH. 1979. Gene flow. Heredity 43: 333-339.
Barton NH. 1986. The effects of linkage and density-dependant regulation on gene flow.
Barton NH, Hewitt GM. 1985. Analysis of hybrid zones. Annual Review of Ecology and
Systematics 16: 113-148.
Beaumont AR, Abdul-Matin AKM, Seed R. 1993. Early development, survival and
growth in pure and hybrid larvae of Mytilus edulis and M. galloprovincialis. Journal of Molluscan Studies 59: 120-123.
Belkhir K, Borsa P, Goudet J, Chikhi L, Bonhomme F. 1996. GENETIX Version 3.0,
Logiciel sous WINDOWS™ pour la Génétique des Populations. Université Montpellier 2:
Montpellier.
Bierne N, Borsa P, Daguin C, Jollivet D, Viard F, Bonhomme F, David P. 2003a.
Introgression patterns in the mosaic hybrid zone between Mytilus edulis and M. galloprovincialis. Molecular Ecology 12: 447-462.
Bierne N, Daguin C, Bonhomme F, David P. Borsa P. 2003b. Direct selection on
allozymes is not required to explain heterogeneity among marker loci across a Mytilus hybrid zone. Molecular Ecology 12: 2505-2510.
Bierne N, David P, Boudry P, Bonhomme F. 2002. Assortative fertilization and selection
at larval stage in the mussels Mytilus edulis and M. galloprovincialis. Evolution 56: 292-298.
Bierne N, David P, Langlade A, Bonhomme F. 2003c. Can habitat specialisation
maintain a mosaic hybrid zone in marine bivalves? Marine Ecology – Progress Series 245: 157-170.
Black WC4, Krafsur ES. 1985. A FORTRAN program for the calculation and analysis of two-locus linkage disequilibrium. Theoretical and Applied Genetics 70: 491-496.
Borsa P, Daguin C, Ramos Caetano S, Bonhomme F. 1999. Nuclear-DNA evidence that
northeastern Atlantic Mytilus trossulus mussels carry M. edulis genes. Journal of Molluscan Studies 65: 524-527.
Daguin C, Bonhomme F, Borsa P. 2001. The zone of sympatry and hybridization of
Mytilus edulis and M. galloprovincialis, as described by intron-length polymorphism at locus mac-1. Heredity 86: 342-354.
Daguin C, Borsa P. 1999. Genetic characterisation of Mytilus galloprovincialis Lmk. in North
West Africa using nuclear DNA markers. Journal of Experimental Marine Biology and Ecology 235: 55-65.
Daguin C, Borsa P. 2000. Genetic relationships of Mytilus galloprovincialis Lmk. populations
worldwide: evidence from nuclear-DNA markers. Geological Society of London Special Publications 177: 389-397.
Gardner JPA, Skibinski DOF. 1990. Genotype-dependant fecundity and temporal
variation of spawning in hybrid mussel populations. Marine Biology 105: 153-162.
Gregorius HR. 1984. An unique genetic distance. Biometrical Journal 26: 13-18.
Harrison RG. 1990. Hybrid zones: windows on evolutionary processes. Oxford Surveys in
Evolutionary Biology 7: 69-128.
Hey J. 2001. Genes, Categories, and Species, The Evolutionary and Cognitive Causes of the Species
Problem. Oxford University Press: New York
Hilbish TJ, Mullinax A, Dolven SI, Meyer A, Koehn RK, Rawson PD. 2000. Origin of
the antitropical distribution pattern in marine mussels (Mytilus spp.): routes and timing of transequatorial migration. Marine Biology 136: 69-77.
Hudson RR, Turelli M. 2003. Stochasticity overrules the ‘three-times rule’: genetic drift,
genetic draft, and coalescence times for nuclear loci versus mitochondrial DNA. Evolution 57: 182-190.
Katz M, Goux J-M. 1986. The statistical properties of genetic absolute distance. Biometrical
McDonald JH, Koehn RK. 1988. The mussels Mytilus galloprovincialis and M. trossulus on the
Pacific coast of North America. Marine Biology 99: 111-118.
McDonald JH, Seed R, Koehn RK. 1991. Allozymes and morphometric characters of
three species of Mytilus in the northern and southern hemispheres. Marine Biology 111: 323-333.
Nichols R. 2001. Gene trees and species trees are not the same. Trends in Ecology and
Evolution 16: 358-364.
Pialek J, Barton NH. 1997. The spread of an advantageous allele across a barrier: the
effects of random drift and selection against heterozygotes. Genetics 145: 493-504.
Quesada H, Zapata C, Alvarez G. 1995. A multilocus allozyme discontinuity in the mussel
Mytilus galloprovincialis: the interaction of ecological and life-history factors. Marine Ecology – Progress Series 116: 99-115.
Rawson PD, Joyner KL, Meetze K, Hilbish TJ. 1996. Evidence for intragenic
recombination within a novel genetic marker that distinguishes mussels in the Mytilus edulis species complex. Heredity 77: 599-607.
Secor CL, Day AJ, Hilbish TJ. 2001. Factors influencing differential mortality within a
marine mussel (Mytilus spp.) hybrid population in southwestern England: reproductive effort and parasitism. Marine Biology 138: 731-739.
Skibinski DOF, Beardmore JA, Cross TF. 1983. Aspects of the population genetics of
Mytilus (Mytilidae; Mollusca) in the British Isles. Biological Journal of the Linnean Society
19: 137-183.
Sokal RR, Rohlf FJ. 1995. Biometry, 3rd Edition. Freeman and Co: New York.
Väinölä R, Hvilsom MM. 1991. Genetic divergence and a hybrid zone between Baltic and
North Sea Mytilus populations. Biological Journal of the Linnean Society 43: 127-148.
Varvio S-L, Koehn RK, Väinölä R. 1988. Evolutionary genetics of the Mytilus edulis
complex in the North Atlantic region. Marine Biology 98: 51-60.
Walsh PS, Metzger DA, Higushi R. 1991. Chelex 100 as a medium for simple extraction
of DNA for PCR-based typing from forensic material. Biotechniques 10: 506-513.
Weir BS. 1979. Inferences about linkage disequilibrium. Biometrics 35: 235-254. Weir BS, Cockerham CC. 1984. Estimating F-statistics for the analysis of population
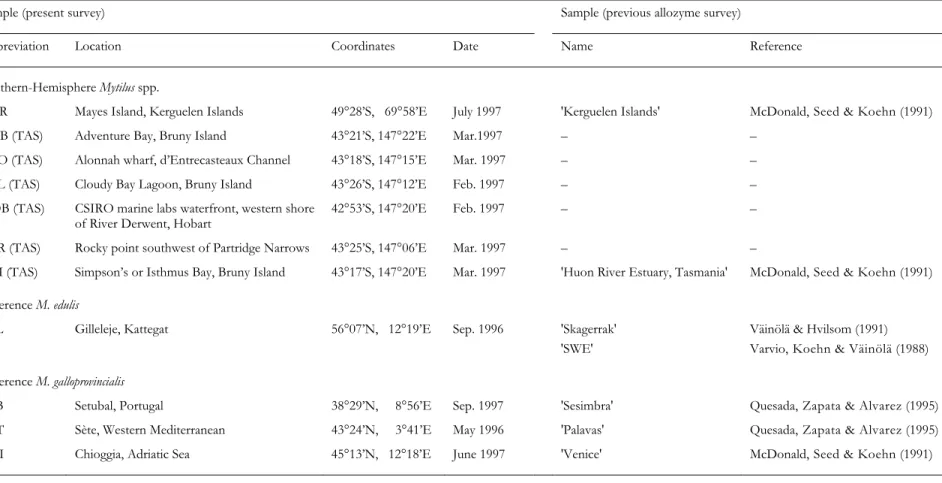
Table 1. Mytilus spp. List of samples analysed for the present survey, and homologous samples (i.e. taken from presumably the
same population, at the same or a nearby location) from previous allozyme surveys
Sample (present survey) Sample (previous allozyme survey)
Abbreviation Location Coordinates Date Name Reference
Southern-Hemisphere Mytilus spp.
KER Mayes Island, Kerguelen Islands 49°28’S, 69°58’E July 1997 'Kerguelen Islands' McDonald, Seed & Koehn (1991) ADB (TAS) Adventure Bay, Bruny Island 43°21’S, 147°22’E Mar.1997 – –
ALO (TAS) Alonnah wharf, d’Entrecasteaux Channel 43°18’S, 147°15’E Mar. 1997 – –
CBL (TAS) Cloudy Bay Lagoon, Bruny Island 43°26’S, 147°12’E Feb. 1997 – –
HOB (TAS) CSIRO marine labs waterfront, western shore
of River Derwent, Hobart 42°53’S, 147°20’E Feb. 1997 – –
PAR (TAS) Rocky point southwest of Partridge Narrows 43°25’S, 147°06’E Mar. 1997 – – SIM (TAS) Simpson’s or Isthmus Bay, Bruny Island 43°17’S, 147°20’E Mar. 1997 'Huon River Estuary, Tasmania' McDonald, Seed & Koehn (1991)
Reference M. edulis
GIL Gilleleje, Kattegat 56°07’N, 12°19’E Sep. 1996 'Skagerrak' 'SWE'
Väinölä & Hvilsom (1991) Varvio, Koehn & Väinölä (1988)
Reference M. galloprovincialis
STB Setubal, Portugal 38°29’N, 8°56’E Sep. 1997 'Sesimbra' Quesada, Zapata & Alvarez (1995) SET Sète, Western Mediterranean 43°24’N, 3°41’E May 1996 'Palavas' Quesada, Zapata & Alvarez (1995) CHI Chioggia, Adriatic Sea 45°13’N, 12°18’E June 1997 'Venice' McDonald, Seed & Koehn (1991)
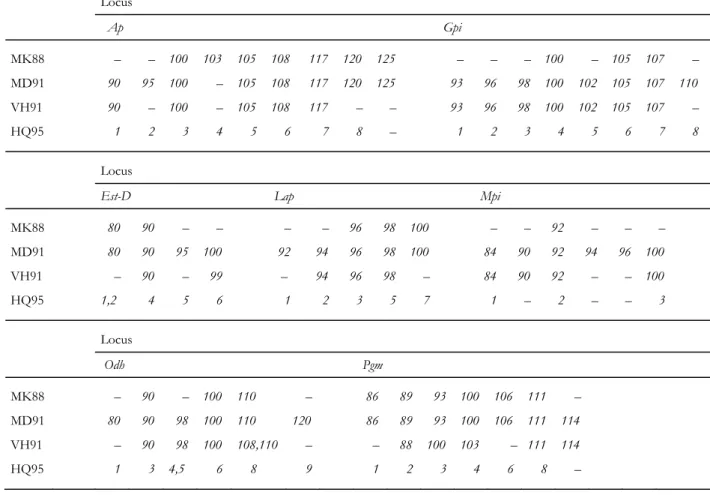
Table 2. Denomination, correspondence across studies, and groupings of electromorphs at 7 allozyme loci
in Mytilus spp. Data obtained by cross comparisons of electromorph frequencies in McDonald & Koehn (1988) (MK88), McDonald, Seed & Koehn (1991) (MD91), Väinölä & Hvilsom (1991) (VH91) and Quesada, Zapata & Alvarez (1995) (HQ95). Locus Lap of MK88, MD91 and VH91 is Lap-2 of HQ95
Locus Ap Gpi MK88 – – 100 103 105 108 117 120 125 – – – 100 – 105 107 – MD91 90 95 100 – 105 108 117 120 125 93 96 98 100 102 105 107 110 VH91 90 – 100 – 105 108 117 – – 93 96 98 100 102 105 107 – HQ95 1 2 3 4 5 6 7 8 – 1 2 3 4 5 6 7 8 Locus
Est-D Lap Mpi
MK88 80 90 – – – – 96 98 100 – – 92 – – – MD91 80 90 95 100 92 94 96 98 100 84 90 92 94 96 100 VH91 – 90 – 99 – 94 96 98 – 84 90 92 – – 100 HQ95 1,2 4 5 6 1 2 3 5 7 1 – 2 – – 3 Locus Odh Pgm MK88 – 90 – 100 110 – 86 89 93 100 106 111 – MD91 80 90 98 100 110 120 86 89 93 100 106 111 114 VH91 – 90 98 100 108,110 – – 88 100 103 – 111 114 HQ95 1 3 4,5 6 8 9 1 2 3 4 6 8 –
Table 3. Allelomorph frequencies at loci mac-1, Glu-5' and Glu-3' in Mytilus spp. from the Southern
Hemisphere. ^f, Weir & Cockerham’s (1984) estimate of Fis; ns, not significant according to permutation test (Belkhir et al., 1996). Size homologies between allelomorphs from different samples were ascertained by side-by-side electrophoretic runs. mac-1 allelomorph nomenclature follows Daguin & Borsa (1999); Glu-5’
allelomorphs G, E and E’ (Borsa et al., 1999) are allelomorphs 300, 350 and 380, respectively, in Rawson et al. (1996); nomenclature for Glu-3' allelomorphs accords with Rawson et al. (1996). Primary data at loci mac-1 and Glu-5' for reference samples (GIL, STB, SET, CHI) from Borsa et al. (1999), Daguin & Borsa (2000), and Daguin et al. (2001)
Locus, Sample
Allelomorph KER TAS GIL STB SET CHI
ADB ALO CBL HOB PAR SIM
mac-1 f1 – – – – – – – – 0.02 – – b2 – – – – – – – – 0.04 0.05 – b1 – – – – – – – – 0.15 0.21 0.28 b4 – – – – – – – – 0.02 – 0.01 b5 – – – – – – – – 0.02 – – c1 – – – – – – – – 0.10 0.07 0.06 c2 – – – – – – – – 0.50 0.54 0.57 c3 – – – – – – – – 0.02 – 0.01 c4 0.08 – – – – – – – – – – c6 – – – – – – – – – 0.01 – a0.5 – – 0.01 – – – – – – – – a1 – – – 0.03 – – – 0.02 0.02 – – a2 0.20 0.95 0.99 0.92 0.98 1.00 0.99 0.15 0.02 – – a3 0.70 0.04 – 0.03 – – 0.01 0.31 0.04 0.01 – a4 0.01 – – 0.02 0.02 – – 0.17 – – – a5 – – – – – – – 0.27 – – – a6 – – – – – – – 0.08 – 0.01 – a7 – – – – – – – – 0.02 0.04 0.03 a8 – – – – – – – – 0.04 0.06 0.03 (N) (83) (28) (59) (32) (31) (30) (40) (26) (26) (68) (47) ^f 0.106ns -0.019ns 0.000ns -0.040ns 0.000ns – 0.000ns 0.173ns -0.010ns 0.123ns 0.032ns Glu-5' E" (~550 bp) – – – – – – – 0.03 – – – E' (~410 bp) 0.03 – – – – – – 0.47 – – – E (~390 bp) 0.32 – – – – – – 0.50 – 0.06 – i (~350 bp) – 0.02 – 0.03 0.02 – – – – – – G (~320 bp) 0.65 0.96 1.00 0.97 0.98 1.00 1.00 – 1.00 0.94 1.00 ii (~290 bp) – 0.02 – – – – – – – – – (N) (79) (26) (25) (29) (26) (25) (38) (16) (19) (39) (18) ^f 0.064ns -0.010ns – -0.018ns 0.000ns – – 0.088ns – -0.027ns – Glu-3' 223 – – – – – – – 0.03 – – – 220 0.48 0.03 – 0.02 0.03 – 0.03 0.97 – – – 214 0.51 0.94 1.00 0.98 0.94 0.97 0.92 – 1.00 1.00 1.00 211 0.01 0.03 – – 0.03 0.03 0.05 – – – – (N) (65) (17) (28) (30) (29) (17) (30) (20) (24) (17) (18) ^f 0.046ns -0.016ns – 0.000ns -0.024ns -0.016ns -0.051ns 0.000ns – – –
Table 4. Single-locus genetic-distance (do: Gregorius, 1984) estimates between Mytilus spp. populations of the
Southern Hemisphere (KER, TAS) and reference Mediterranean M. galloprovincialis (CHI, SET), Atlantic M. galloprovincialis (STB) and northeastern Atlantic M. edulis (GIL). ^Do, across-locus average ^do; SD, estimate of standard deviation
Locus KER vs. KER vs. TAS vs.
TAS CHI SET STB GIL CHI SET STB GIL
Ap 0.670 0.680 0.685 0.435 0.170 0.350 0.415 0.375 0.570 Est-D 0.500 0.975 0.990 0.945 0.100 0.475 0.490 0.445 0.420 Gpi 0.515 0.620 0.575 0.560 0.825 0.125 0.190 0.345 0.970 Lap 0.105 0.540 0.505 0.560 0.270 0.455 0.420 0.475 0.185 Mpi 0.940 0.980 0.950 0.930 0.110 0.040 0.010 0.030 0.960 Odh 0.495 0.100 0.075 0.375 0.635 0.595 0.510 0.150 0.890 Pgm 0.290 0.400 0.335 0.265 0.200 0.340 0.295 0.245 0.200 mac-1 0.788 0.996 0.973 0.929 0.523 0.996 0.996 0.965 0.839 Glu-5’ 0.350 0.350 0.286 0.350 0.651 0.000 0.064 0.000 1.000 Glu-3’ 0.447 0.490 0.490 0.490 0.520 0.083 0.083 0.083 0.967 ^Do 0.510 0.613 0.586 0.584 0.400 0.346 0.347 0.311 0.700 SD 0.243 0.301 0.314 0.259 0.261 0.306 0.292 0.286 0.328