Publisher’s version / Version de l'éditeur:
2002 ASTRO Conference, 2004
READ THESE TERMS AND CONDITIONS CAREFULLY BEFORE USING THIS WEBSITE. https://nrc-publications.canada.ca/eng/copyright
Vous avez des questions? Nous pouvons vous aider. Pour communiquer directement avec un auteur, consultez la
première page de la revue dans laquelle son article a été publié afin de trouver ses coordonnées. Si vous n’arrivez pas à les repérer, communiquez avec nous à [email protected].
Questions? Contact the NRC Publications Archive team at
[email protected]. If you wish to email the authors directly, please see the first page of the publication for their contact information.
NRC Publications Archive
Archives des publications du CNRC
This publication could be one of several versions: author’s original, accepted manuscript or the publisher’s version. / La version de cette publication peut être l’une des suivantes : la version prépublication de l’auteur, la version acceptée du manuscrit ou la version de l’éditeur.
Access and use of this website and the material on it are subject to the Terms and Conditions set forth at
Neptec 3D Laser Camera System: From Space Mission STS-105 to Terrestrial Applications
Samson, C.; English, C.; Deslauriers, A.; Christie, I.; Blais, François; Ferrie, F.
https://publications-cnrc.canada.ca/fra/droits
L’accès à ce site Web et l’utilisation de son contenu sont assujettis aux conditions présentées dans le site
LISEZ CES CONDITIONS ATTENTIVEMENT AVANT D’UTILISER CE SITE WEB.
NRC Publications Record / Notice d'Archives des publications de CNRC:
https://nrc-publications.canada.ca/eng/view/object/?id=c5b4090c-9b9e-4650-a448-1f1c06310489 https://publications-cnrc.canada.ca/fra/voir/objet/?id=c5b4090c-9b9e-4650-a448-1f1c06310489
National Research Council Canada Institute for Information Technology Conseil national de recherches Canada Institut de technologie de l'information
Neptec 3D Laser Camera System: From Space
Mission STS-105 to Terrestrial Applications *
Samson, C., English, C., Deslauriers, A., Christie, I., Blais, F., and Ferrie, F.June 2004
* published in Canadian Aeronautics and Space Journal. June 2004. NRC 46565.
Copyright 2004 by
National Research Council of Canada
Permission is granted to quote short excerpts and to reproduce figures and tables from this report, provided that the source of such material is fully acknowledged.
Neptec 3D Laser Camera System:
From Space Mission STS-105 to Terrestrial Applications
Claire Samson * Chad English ** Adam Deslauriers ** Iain Christie ** François Blais *** Frank Ferrie ****
* (Corresponding author) Department of Earth Sciences Carleton University 1125 Colonel By Drive Ottawa, Ontario K1S 5B6 Tel : (613) 520-2600 x.4396 Fax: (613) 520-2569 Email: [email protected] ** Neptec Design Group
302 Legget Drive
Kanata, Ontario K2K 1Y5 Tel: (613) 599-7602 Fax: (613) 599-7604
Email: [email protected] Email: [email protected] Email: [email protected]
*** Institute for Information Technology National Research Council of Canada 1200 Montreal Road, Building M-50 Ottawa, Ontario K1A 0R6
Tel: (613) 993-3285 Fax: (613) 952-0215
Email: [email protected]
**** Department of Electrical and Computer Engineering McGill University
3480 University Street Montreal, Quebec H3A 2A7 Tel: (514) 398-6042
Fax: (514) 398-4470
Abstract
Neptec Design Group has developed the Laser Camera System (LCS), a 3D auto-synchronized laser scanner based on a principle originating from the National Research Council of Canada. In imaging mode, the LCS raster scans objects and captures reflections from their surface features. In centroid acquisition mode, the LCS determines the position of discrete target points on an object.
Neptec Design Group first developed the LCS for space applications. In August 2001, the LCS flew successfully onboard space shuttle Discovery during mission STS-105 to the International Space Station (ISS). During the mission, the LCS took four high-resolution (1024x1024 voxels) images of elements of the ISS during orbital day and night, demonstrating its immunity to dynamic lighting conditions. The LCS also tracked targets affixed to the Multi-Purpose Logistics Module (MPLM) while in motion, more than 10 m away. Comparison with Space Station Remote Manipulator System (SSRMS) data confirmed that the LCS tracked these targets with millimetre precision.
Following the mission, the LCS has been demonstrated in a variety of terrestrial commercial applications. Two examples from the earth sciences include imaging rock faces in an underground mine to delineate joints to design adequate tunnel support, and acquiring detailed images of sandstone masonry walls. The high-fidelity spatial information and the intensity data captured by the LCS concurrently make it a valuable tool for the classification of geomaterials based on reflectivity and texture.
Résumé
Neptec Design Group a développé le capteur laser d’images tridimensionelles “Laser Camera System (LCS)”, un scanner basé sur le principe d’auto-synchronisation dont le concept de base provient du Conseil national de recherches Canada. En mode capture d’images, le LCS balaie la surface des objets et enregistre l’intensité de l’énergie laser réfléchie par celle-ci. En mode poursuite, le LCS détermine la position de cibles ponctuelles placées sur un objet.
Neptec Design Group a initialement développé le LCS en vue d’applications spatiales. En août 2001, le LCS a été testé avec succès à bord de la navette spatiale Discovery au cours de la mission STS-105 vers la Station Spatiale Internationale. Pendant la mission, le LCS a pris quatre images à haute résolution (1024x1024 voxels) de plusieurs composantes de la station, de jour et de nuit, pour démontrer que la qualité des images est indépendante des conditions d’éclairage, même variables. Le LCS a aussi suivi la trajectoire de plusieurs cibles apposées sur le module logistique multifonctionnel pendant que celui-ci était en mouvement à une distance de plus de 10 mètres. Une comparaison entre les données du LCS et celles du bras robotique de la station a confirmé que le LCS a suivi les trajectoires des cibles avec une précision de l’ordre du millimètre.
Dans les mois qui ont suivi la mission, le LCS a démontré son potentiel pour plusieurs applications commerciales terrestres. Par exemple, dans le domaine des sciences de la terre, le LCS a été utilisé pour prendre des images de joints sur les parois rocheuses d’une mine souterraine dans le but d’aider à évaluer le support structural requis pour les tunnels. Le LCS a aussi été utilisé pour prendre des images de murs de maçonnerie en grès. L’exactitude des coordonnées et des données d’intensité acquises simultanément par le LCS en font un instrument
très utile pour classifier les matières géologiques en fonction de leurs coefficients de réflexion et de leurs textures.
1. INTRODUCTION
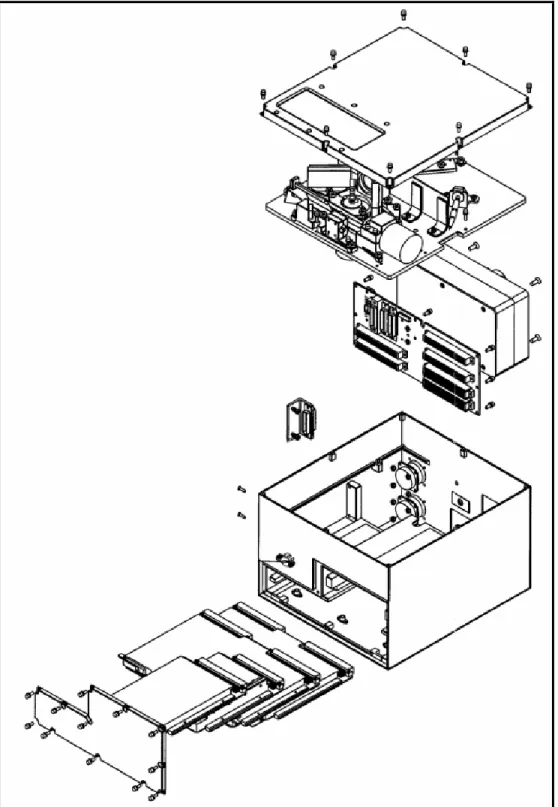
Neptec Design Group’s Laser Camera System (LCS) is a 3D auto-synchronized scanner based on a principle originating from the National Research Council (NRC) of Canada (Rioux, 1984). Two moving mirrors, driven by high-precision galvanometers, steer a continuous laser beam on a target in space. The diffusely reflected light is captured by a collecting lens which focuses the energy on a linear detector array (LDA). The relation between the two galvanometer angles, U and V, and the detected peak, P, and Cartesian spatial coordinates, X, Y and Z, is computed by triangulating the intersection between the projected and reflected raypaths. Diagrams illustrating the theoretical auto-synchronized geometry can be found in Blais et al. (1988, 1991). Its implementation in the LCS is discussed in Blais et al. (2000a,b) and Samson et al. (2002a). Figure 1 is an exploded view of the major elements of the LCS. A more detailed engineering drawing of the LCS optical compartment showing the different components and mounts can be found in Smith et al. (2003).
Neptec Design Group first developed the LCS for space applications with the technical support of the National Research Council of Canada and the financial support of the Canadian Space Agency. Several features of the auto-synchronized design make it a good candidate for space applications. Firstly, the simplicity of the design and the careful choice of materials (Smith et al., 2003) contribute to its robustness to deformation and vibrations. Secondly, its small instantaneous field-of-view (FOV) limits interference from environmental lighting conditions (Blais et al., 1988). In the LCS design, additional immunity against solar illumination comes from the choice of a 1500 nm laser source and the 3D geometry of the system (sun is at infinity) (Beraldin et al., 2000; Blais et al., 2000b). This wavelength is not only “eye safe”, that is, absorbed by the front surface of the eye rather than by the retina, it also corresponds to a
minimum in the solar spectrum.
Figure 1. Exploded view showing the major elements of the LCS (from top to bottom): cover and window, optical compartment, power supply module, main enclosure and electronic control cards.
The LCS specifications are listed in Table 1. The LCS is a versatile instrument that operates in two modes. In imaging mode, the LCS raster scans objects and captures reflections from their surface features. For each point illuminated, the LCS records a (U,V,P,I) voxel, where I is the intensity of the reflected signal. In 3D imaging, the term “voxel” is used to describe a volumetric image element, as opposed to the term “pixel” which corresponds to a 2D image element. LCS user-controlled imaging parameters are target distance, image size, image resolution and integration time. Image resolution is the number of voxels per horizontal and vertical scan lines. For a given image, the spatial sampling can therefore be computed by dividing the size by the resolution. Integration time is the length of time during which the detector is active and depends on the surface reflectivity of the target. Imaging mode is very useful for inspection tasks. Several images of the same scene, even if they are not captured from the same exact viewpoint, can be compared to identify any difference.
In centroid acquisition mode, the LCS determines the position of discrete target points on an object. In this mode, the LCS projects Lissajous patterns on circular targets with strong black and white contrasts. The data are then processed using either a centroid method or best fit of a circle (Blais et al., 2000a,b). In centroid acquisition mode, the LCS can serve as a front-end to the Space Vision System (SVS), a photogrammetric system developed by Neptec Design Group and currently in use for space station assembly tasks (Samson et al., 2001).
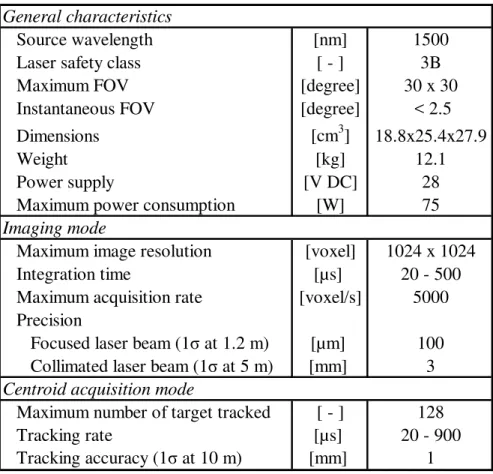
Table 1. LCS specifications General characteristics
Source wavelength [nm] 1500
Laser safety class [ - ] 3B
Maximum FOV [degree] 30 x 30 Instantaneous FOV [degree] < 2.5 Dimensions [cm3] 18.8x25.4x27.9
Weight [kg] 12.1
Power supply [V DC] 28
Maximum power consumption [W] 75
Imaging mode
Maximum image resolution [voxel] 1024 x 1024 Integration time [µs] 20 - 500 Maximum acquisition rate [voxel/s] 5000 Precision
Focused laser beam (1σ at 1.2 m) [µm] 100 Collimated laser beam (1σ at 5 m) [mm] 3
Centroid acquisition mode
Maximum number of target tracked [ - ] 128
Tracking rate [µs] 20 - 900
Tracking accuracy (1σ at 10 m) [mm] 1
The LCS was tested onboard space shuttle Discovery during mission STS-105 to the International Space Station (ISS) in August 2001. Mission results are presented in Section 2. Following the mission, the LCS was modified to extend its range of applications. A new bracket was designed to mount the camera on a tripod (see Figure 4a). Fans and cooling fins were added for heat transfer. In addition to the collimated laser configuration used during the mission, the LCS was fitted with an interchangeable lens capable of focusing the laser at a fixed distance of 1.2 m for very detailed imaging tasks requiring sub-millimetre precision.
In recent months, the LCS has been demonstrated in a variety of terrestrial applications including automatic target recognition of vehicles (Samson et al., 2002b; English et al., 2004), biometric identification and patient positioning. In particular, there has been much interest in the earth science applications, as shown in Section 3.
2.RESULTS FROM MISSION STS-105
The LCS space operations were designed to test both the imaging and centroid acquisition modes with a minimum of human intervention. From its fixed location on the sidewall of Bay 3 Starboard of Discovery, the LCS automatically acquired four images of the ISS at a resolution of 1024x1024 voxels. Imaging took place during a transition between orbital night and day, demonstrating the camera’s immunity to dynamic lighting conditions (Samson et al., 2001).
The LCS also tracked successfully for more than two hours one retro-reflective (target Las_1, diameter = 50.8 mm) and three black Inconel targets on a white background (target Mc_11a, diameter = 139.7mm; target Mc_11b, diameter = 158.7 mm; target Mc_12, diameter = 165.1 mm) affixed on the Multi-Purpose Logistics Module (MPLM). During the last eight minutes of this test, the LCS continued to track the targets as the MPLM was unberthed from the ISS by the Space Station Remote Manipulator System (SSRMS). Comparison with SSRMS data confirmed that the LCS tracked these targets with millimetre precision from a distance of 10-15 m (Deslauriers et al., 2002).
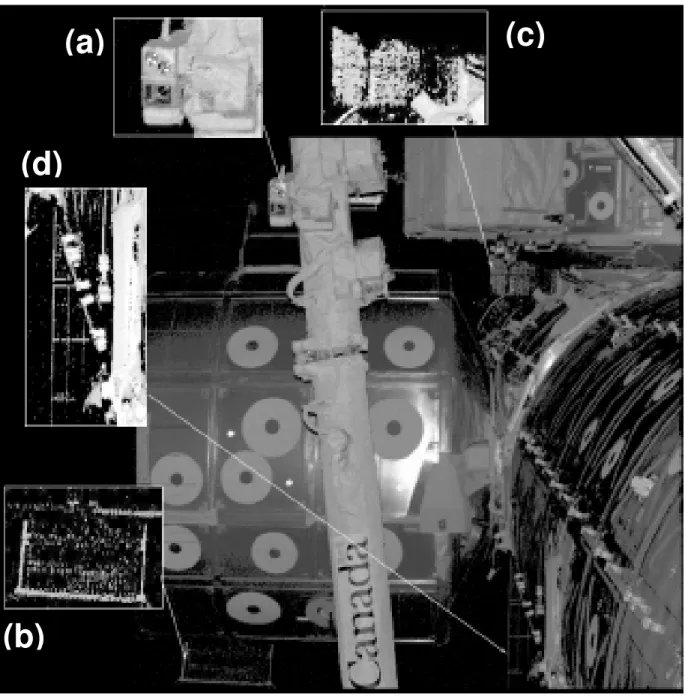
Figure 2 is a 2D projection of the 3D high-resolution intensity data acquired by the LCS on orbit. Most detected reflections were from the SSRMS and the MPLM at distances of 8-9 m and 12-15 m, respectively. Several regions of the image have been enlarged to show remarkable details, for example, the Mobile Servicing System (MSS) camera at a distance of 9 m, the Soyuz solar arrays at 20 m, the Zarya Control Module (FGB) at 30 m, and the FGB solar arrays at 45 m.
Figure 2. LCS high-resolution intensity image of several ISS elements with enlarged details of (a) the MSS camera at a distance of 9 m, (b) the Soyuz solar arrays at 20 m, (c) the FGB at 30 m, and (d) the FGB solar arrays at 45 m.
(a)
(c)
(b)
(d)
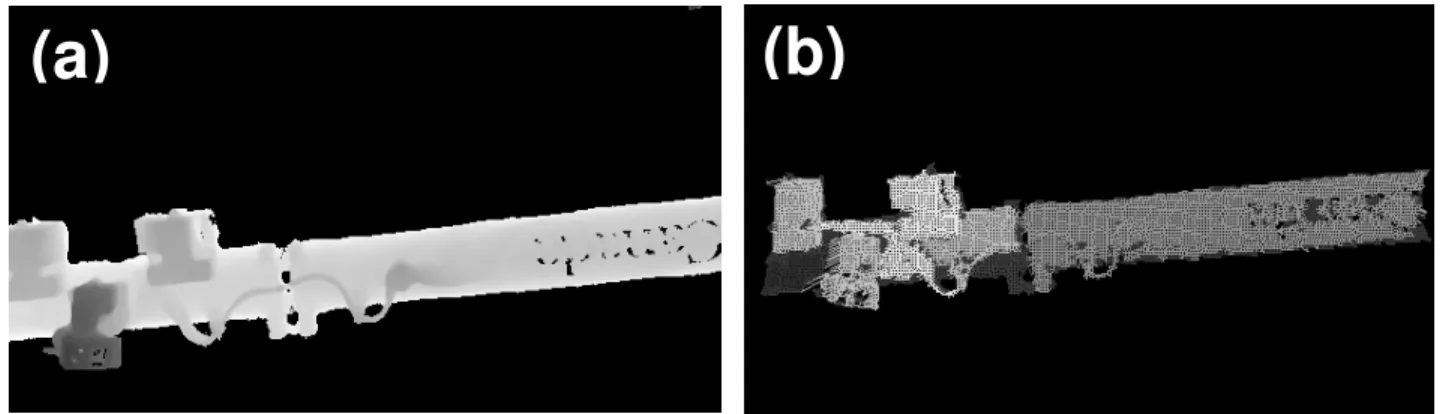
The LCS range data are readily available for quantitative analysis without requiring extensive data pre-processing. Figure 3 presents the example of the range data from the SSRMS, which have been automatically segmented into different parts using the anisotropic diffusion method developed at McGill University (Lejeune and Ferrie, 1996). Figure 3a shows the data after smoothing with a 3x3 median filter. Figure 3b shows the same data after segmentation by anisotropic diffusion. The algorithm gradually erodes convex points on a surface, while preserving concave points. After several iterations, the concave points mark boundaries between the different parts of the SSRMS. Finally, superellipsoids were fitted to each of the segmented parts. These superellipsoids can be used to compute the centroid of each part for pose estimation.
Figure 3. LCS range data from the SSRMS (a) after median filtering, and (b) after segmentation by anisotropic diffusion.
3.EARTH SCIENCE APPLICATIONS
Since mission STS-105, Neptec Design Group has been actively seeking terrestrial applications for the LCS technology. The combination of high fidelity 3D image data acquired in a relatively short time over a wide FOV makes the LCS particularly attractive for a number of applications in the earth sciences. The use of LCS both for large-scale rock face analysis and for small-scale, detailed analysis and geomaterial classification have been studied.
3.1 Rock Face Analysis
Upon invitation from the International Nickel Company Limited (Inco), the LCS was used in the Inco Research Mine in Sudbury, Ontario, to acquire images of a fresh cut-and-fill (Figure 4) and an existing drift (Figure 5) at a resolution of 1024x1024 voxels. The images of the cut-and-fill were acquired at a distance of 12 m and the images of the drift at 5 m, both with a collimated laser beam.
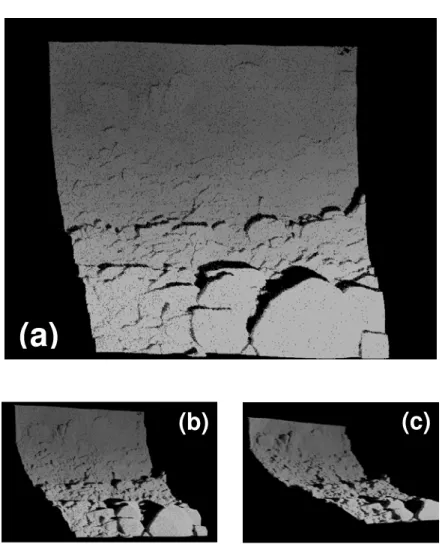
The first step in analysis of the LCS 3D image data is the visual inspection of point cloud data. The point cloud data set consists of the directly measured voxels prior to any interpolation or surface reconstruction. Each voxel is simply plotted at its (X,Y,Z) location in 3D space. Figure 5 shows a series of views from the same point cloud data set. Because of the three-dimensional nature of LCS data, the data can be viewed from the side although it has been acquired from a single viewpoint. Note the prominent laser shadows.
(b)
(c)
Figure 4. (a) Digital photograph of the cut-and-fill where the LCS was deployed in the Inco Research Mine (Photo courtesy of J. Galbraith, Inco). The white polygon outlines approximately the area imaged by the LCS. (b) The resulting composite LCS 2D intensity map.
(a)
(a)
Figure 5. Point cloud data of a drift wall. (a) Front view; (b) and (c) side views.
Data acquired by the LCS can also be used to build full 3D surface maps of large areas. In fact, the LCS data acquired from different view points but with an overlapping region can be aligned, and combined in 3D space, using an Iterative Closest Point (ICP) algorithm. After alignment, the surfaces can be fitted to the individual data points to create models that fully exploit the three-dimensional nature of the LCS image data.
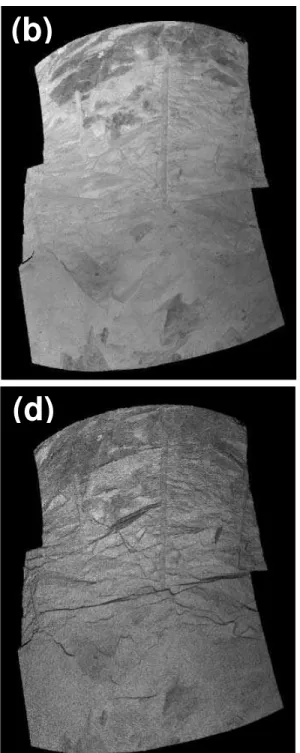
Figure 6 illustrates the alignment and model building processes for two images. In Figure 6a, before alignment, the two images are fitted with a preliminary wireframe grid. In Figure 6b, after alignment, the data have now been merged into a single solid polygon model. The visual
(a)
(a)
perception of the model can be further enhanced by overlaying the LCS measured intensities, as in Figure 6c, or by combining both measured intensities and light rendering effects as in Figure 6d.
At present in the mining industry, rock face analysis is usually based on trends identified on 2D pictures and plotted using stereonets (Twiss and Moores, 1992). The 3D images and models derived from LCS data allow a precise and quantitative evaluation of the orientation and spacing of the different sets of in-situ joints. Images before and after blasting can be compared to measure the impact of blasting on the size and shape of the different rock blocks and to predict fragmentation. This information can be used to plan adequate tunnel support and to tune blast models used to predict the quantity, type and exact location of the explosive charges required for a specific tunneling task. An additional advantage is that the images can be "stitched" together and archived to keep a precise 3D model of the mine for future studies. This is particularly important if the rock faces become inaccessible because they are covered with cement for support.
3.2 Geomaterial Classification
As seen in Section 3.1, using the LCS with a collimated laser beam at a distance of a few metres, it is possible to build accurate surface models of rock face to search for macroscopic structural features such as joints. With a focused laser beam, at shorter distances of 1-2 m, the LCS can be used to perform geomaterial classification based on reflectivity and texture.
Figure 6. (a) Before alignment: data from 2 images. (b) After alignment: solid polygon model combining data from both files. (c) Solid polygon model with overlaid measurements intensities, and (d) combined intensities and artificial light rendering.
.
(a)
(b)
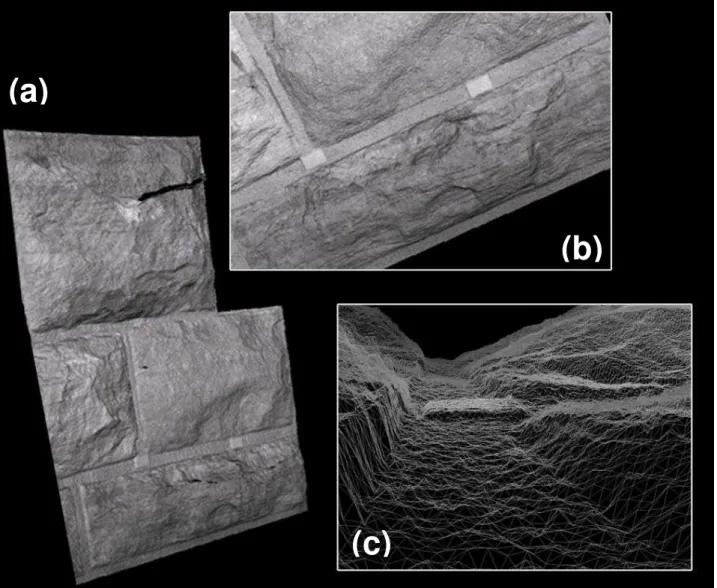
As an example, Figure 7 shows a series of views of a sandstone wall acquired with the LCS at 1.2 m. The resolution of the original scan was 1024x1024 voxels. From the appearance and texture of the stone it is not only possible to identify it as a fine-grained sandstone, but also to identify the orientation and relative thickness of the bedding planes.
Figure 7. Solid model of a sandstone wall acquired with the LCS. (a) Full scale showing a section approximately 1 m x 1 m. (b) Expanded view of a section of the wall. Note that the layered structure of the stone is clearly visible. (c) Close up of the wireframe model showing one of the mortar channels with a ceramic marker. The ceramic marker is 1 mm high.
(a)
(b)
The use of LCS as an automatic geomaterial classification system is part of ongoing research at Neptec Design Group in collaboration with Carleton University and the Geological Survey of Canada.
4.CONCLUSION
In 2001, Neptec Design Group’s LCS enjoyed a highly successful inaugural mission to the ISS returning 3D models of space station elements including the Canadarm2 (SSRMS). The mission data met or exceeded performance expectations and proved that auto-synchronized scanning technology can be used successfully in space.
Since that time new terrestrial applications for the technology have been under investigation at Neptec Design Group. In particular, the system has proved to be well adapted for earth science applications including analysis of large scale rock faces and detailed geomaterial classification.
The LCS has proved to be a space qualified technology with clear applications in geological exploration and classification. With the current scientific interest in the planetary geology of Mars it would seem that an auto-synchronized scanner is a natural choice for use as a site survey and sample classification and selection tool for a Mars mission. Current efforts at Neptec Design Group are directed at developing just such a concept with our partners in the Mars science community.
5.ACKNOWLEDGEMENTS
Neptec Design Group would like to thank its various collaborators involved in the project: the National Research Council of Canada for sharing their expertise in 3D laser imaging, the Canadian Space Agency for its financial support during the development of the LCS for space applications, and Inco for the opportunity to demonstrate the LCS in their research mine and for the permission to publish the material presented in this paper.
6.REFERENCES
Beraldin, J.A., Blais, F., Rioux, M., Cournoyer, L., Laurin, D., and MacLean, S.G. (2000). Eye-Safe Digital 3-D Sensing for Space Applications, Optical Engineering, Vol. 39, No. 1, pp. 196-211.
Blais, F., Rioux, M., and Beraldin, J.A. (1988). Practical Considerations for a Design of a High Precision 3-D Laser Scanner System, Optomechanical and Electro-Optical Design of Industrial
Systems, SPIE Vol. 959, pp. 225-246.
Blais, F., Rioux, M., and MacLean, S.G. (1991). Intelligent, Variable Resolution Laser Scanner for the Space Vision System, Acquisition, Tracking and Pointing V, SPIE Vol. 1482, pp. 473-479.
Blais, F., Beraldin, J.A., Cournoyer, L., Christie, I., Mason, K., McCarthy, S., and Goodall, C. (2000a). Integration of a Tracking Laser Range Camera with the Photogrammetry Based Space Vision System, Acquisition, Tracking and Pointing XIV, SPIE Vol. 4025, pp. 219-228.
Blais, F., Beraldin, J.A., and El-Hakim, S. (2000b). Range Error Analysis of an Integrated Time-of-Flight, Triangulation, and Photogrammetric 3D Laser Scanning System, Laser Radar
Technology and Applications V, SPIE Vol. 4035, pp. 236-247.
Deslauriers, A., Samson, C., Christie, I., and F. Blais. (2002). Tracking Targets on the International Space Station Using a Laser Scanner, Opto-Canada, SPIE Vol. TD01, pp. 54-56.
English, C., Ruel, S., Melo, L., Church, P., and Maheux, J. (2004). Development of a Practical 3D Automatic Target Recognition and Pose Estimation Algorithm, Automatic Target
Recognition XIV, SPIE Defense and Security Symposium, Orlando, FL, 12-16 April.
Lejeune, A., and Ferrie, F. (1996). Partitioning Range Images Using Curvature and Scale,
Computer Vision and Image Understanding, Vol. 64, No. 2, pp. 230-247.
Rioux, M. (1984). Laser Range Finder Based on Synchronized Scanners, Applied Optics, Vol. 23, No. 21, pp. 3837-3844.
Samson, C., Christie, I., Beraldin, A., and Blais, F. (2002a). Neptec 3D Laser Scanner for Space Applications: Impact of Sensitivity Analysis on Mechanical Design, Opto-Canada, SPIE Vol. TD01, pp. 48-50.
Target Recognition, Fifth International Military Sensing Symposium, Gaithersburg, MD, 9-12 December.
Samson, C., English, C., Deslauriers, A., Christie, I., and Blais, F. (2001). Imaging and Tracking Elements of the International Space Station Using a 3D Auto-Synchronized Scanner,
Acquisition, Tracking, and Pointing XVI, SPIE Vol. 4714, pp. 87-96.
Smith, I.C., Hudson, R. and Cournoyer, L. (2003). Design of Laser Optics Used in Neptec 3D Laser Camera System for Low Earth Orbit Environment, Fourth Canadian-International
Composites Conference, Ottawa, ON, 19-22 August.
Twiss, R.J., and Moores, E.M. (1992). Structural Geology. New York: W.H. Freeman and company.