Publisher’s version / Version de l'éditeur:
Energy & Fuels, 16, Mar-Apr 2, pp. 470-476, 2002-04-01
READ THESE TERMS AND CONDITIONS CAREFULLY BEFORE USING THIS WEBSITE. https://nrc-publications.canada.ca/eng/copyright
Vous avez des questions? Nous pouvons vous aider. Pour communiquer directement avec un auteur, consultez la première page de la revue dans laquelle son article a été publié afin de trouver ses coordonnées. Si vous n’arrivez pas à les repérer, communiquez avec nous à PublicationsArchive-ArchivesPublications@nrc-cnrc.gc.ca.
Questions? Contact the NRC Publications Archive team at
PublicationsArchive-ArchivesPublications@nrc-cnrc.gc.ca. If you wish to email the authors directly, please see the first page of the publication for their contact information.
NRC Publications Archive
Archives des publications du CNRC
This publication could be one of several versions: author’s original, accepted manuscript or the publisher’s version. / La version de cette publication peut être l’une des suivantes : la version prépublication de l’auteur, la version acceptée du manuscrit ou la version de l’éditeur.
For the publisher’s version, please access the DOI link below./ Pour consulter la version de l’éditeur, utilisez le lien DOI ci-dessous.
https://doi.org/10.1021/ef010233r
Access and use of this website and the material on it are subject to the Terms and Conditions set forth at
Time dependent microstructure of bitumen and its fractions by
modulated differential scanning calorimetry
Masson, J-F.; Polomark, G. M.; Collins, P.
https://publications-cnrc.canada.ca/fra/droits
L’accès à ce site Web et l’utilisation de son contenu sont assujettis aux conditions présentées dans le site LISEZ CES CONDITIONS ATTENTIVEMENT AVANT D’UTILISER CE SITE WEB.
NRC Publications Record / Notice d'Archives des publications de CNRC:
https://nrc-publications.canada.ca/eng/view/object/?id=00cbac8b-02fd-4e61-aa76-b544e7fe4bd8 https://publications-cnrc.canada.ca/fra/voir/objet/?id=00cbac8b-02fd-4e61-aa76-b544e7fe4bd8Time-dependent microstructure of bitumen and its
fractions by modulated differential scanning
calorimetry
Masson, J-F.; Polomark, G.M.; Collins, P.
A version of this paper is published in / Une version de ce document se trouve dans:
Energy & Fuels, v. 16, no. 2, Mar-Apr. 2002, pp. 470-476
www.nrc.ca/irc/ircpubs
NRCC-45137
Time-Dependent Microstructure of Bitumen and Its
Fractions by Modulated Differential Scanning
Calorimetry
J-F. Masson,* G. M. Polomark, and P. Collins
Institute for Research in Construction, National Research Council of Canada, Ottawa, Ontario, Canada, K1A 0R6
Received September 21, 2001. Revised Manuscript Received December 3, 2001
Bitumen fractions were analyzed by modulated differential scanning calorimetry (MDSC) before and after annealing at room temperature. MDSC allowed for separating glass transitions (Tg’s)
from order-disorder transitions. All fractions showed at least two Tg’s and different states of
order. Saturates were semicrystalline, aromatics were amorphous, resins, and asphaltenes were mesophasic. In bitumen, the fractions order in four stages upon cooling from the melt. In the first stage, all fractions order rapidly into a weakly organized phase. In the second stage, low molecular weight saturated segments crystallize. In the third stage, high molecular weight saturated segments crystallize. In the fourth stage, resins and asphaltenes order into a mesophase. The third and fourth stages are responsible for the room-temperature (steric) hardening of bitumen.
1. Introduction
Bitumen is an oligomeric material with a time-dependent microstructure1 that affects viscoelastic
properties.2-4After it is cooled from the melt, bitumen
becomes harder over time; the hardening is defined by the storage temperature immediately after cooling. Physical hardening takes 1-2 days at -15 to -35 °C,4
which is in the glass transition temperature (Tg) region
for most bitumens. Steric hardening,3which occurs at
room temperature, takes days to weeks. The two names for hardening imply that two mechanisms are respon-sible for hardening. On the basis of the simple Arrhe-nius relationship between rates and temperatures,5
hardening would be expected to be faster at the higher temperature. Because this is not the case, at least two molecular mechanisms must govern the development of bitumen microstructure and, consequently, its harden-ing.
Physical hardening has been related to the loss of free volume at Tg,6,7and to the crystallization of the
satu-rates.7,8 Steric hardening has been attributed to the
association of the asphaltenes,3which would explain the
increased steric hardening upon oxidation.9 However,
maltenes (deasphaltenated bitumen) have also shown a time-dependent behavior.10Consequently, the exact
molecular mechanism for steric hardening remains uncertain.
We have recently shown that modulated differential scanning calorimetry (MDSC) can be used to investigate the time-dependent behavior of bitumen.1When
bitu-men was cooled from the melt and annealed at 22 °C, its microstructure developed slowly and three stages were identified.
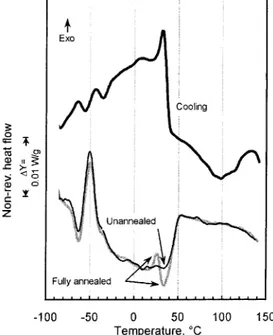
In this paper, MDSC is used to investigate the thermal behavior of bitumen fractions, to reveal the time dependency of their structure and provide a molecular basis for the steric hardening of bitumen. MDSC provides greater sensitivity than conventional DSC as it allows for differentiating between revers-ing and nonreversrevers-ing thermal behaviors in bitumen (Figure 1). Reversing events include those that can be brought to equilibrium during the period of a modulated temperature signal used in the MDSC experiment.11-14
Most important in this respect are the atomic motions
* Corresponding author. Tel: 1-613- 993-2144. Fax:1-613-952-8102. E-mail: jean-francois.masson@nrc.ca.
(1) Masson, J.-F.; Polomark, G. Thermochim. Acta 2001, 374, 105-114.
(2) Traxler, R. N.; Schweyer, H. E. Proc. Am. Soc. Test. Mater. 1936, 36, 544-550.
(3) Brown, A. B.; Sparks, J. W.; Smith, F. M. Proc. Assoc. Asphalt Paving Technol. 1957, 26, 486-494.
(4) Lu, X.; Isacsson, U. Const. Build. Mater. 2000, 14, 79-88. (5) McQuarrie, D. A.; Simon, J. D. Physical Chemistry: A Molecular Approach; University Science Books: Sausalito, CA, 1997; p 1163.
(6) Anderson, D. A.; Bahia, H. U. Proc. Assoc. Asphalt Paving Technol. 1993, 62, 93-129.
(7) Anderson, D. A.; Marasteanu, M. O. Transp. Res. Rec. 1999, 1661, 27-34.
(8) Claudy, P.; Le´toffe´, J. M.; Rondelez, F.; Germanaud, L.; King, G.; Planche, J. P. Prepr. Pap.-Am. Chem. Soc., Div. Fuel Chem. 1992, 37(3-4), 1408-1426.
(9) Petersen, J. C. Transp. Res. Rec. 1984, 999, 13-30.
(10) Branthaver, J. F.; Petersen, J. C.; Robertson, R. E.; Duvall, J. J.; Kim, S. S.; Harnsberger, P. M.; Mill, T.; Ensley, F. A.; Barbour, F. A.; Schabron, J. F. Binder Characterization and Evaluation; Strategic Highway Research Program, National Research Council: Washington, DC, 1994; Vol. 2.
(11) Jones, K. J.; Kinshott, I.; Reading, M.; Lacey, A. A.; Nikopoulos, C.; Pollock, H. M. Themochim. Acta 1997, 304/305, 187-199.
(12) Lacey, A. A.; Nikopoulos, C.; Reading, M. J. Therm. Anal. 1997, 50, 279-333.
(13) Reading, M. Trends Polym. Sci. 1993, 1, 248-253.
(14) Gill, P. S.; Sauerbrunn, S. R.; Reading, M. J. Therm. Anal. 1993, 40, 931-939.
470 Energy & Fuels 2002, 16, 470-476
10.1021/ef010233r CCC: $22.00 © 2002 American Chemical Society Published on Web 02/05/2002
responsible for the heat capacity, Cp.15 As a result,
Cp is the major contributor to the reversing curve.
Effects that cannot be modulated and brought to equilibrium are excluded from the reversing curve and show as nonreversing, e.g., oxidation, evaporation, decomposition, relaxation.13Melting and crystallization
can include both reversing and nonreversing contribu-tions.13,16
In this paper, it is shown that MDSC can be used to probe the time-dependent microstructure of the various fractions in bitumen, namely, the saturates, aromatics, resins, and asphaltenes. Moreover, the study reveals that each fraction shows at least two Tg’s, and that the
fractions contribute to a four-stage development of the microstructure in the original bitumen, instead of the three stages as originally indicated.1 Two stages are
related to the steric hardening of bitumen.
2. Experimental Section
Bitumen fractions rich in saturates, aromatics, resins, or asphaltenes were obtained by flash chromatography (FC).17 The composition of the fractions as obtained by TLC-FID18is shown in Table 1. After a slow evaporation of the FC solvent at 85 °C, samples were placed in DSC pans and dried for 1 h
at 150 °C under a flow of nitrogen. The pans were then sealed and the samples annealed for various times, the longest time being that when steady-state was achieved. This was verified by running samples periodically until no change was observed in the MDSC signal. Annealing as defined here is the storage at 22 ( 1 °C (room temperature).
MDSC heating and cooling curves were obtained at a rate of 3 °C/min with a modulation period of 60 s and an amplitude (0.47 °C. All samples were subjected to the following thermal programs: (i) First heating: -100 to 150 °C (after rapid cooling from the annealing temperature). Rapid cooling is an exponential cooling rate fastest at the beginning of cooling. About 15 min is required for cooling, so that the average cooling rate is about 15 °C/min. The first heating provides results for the annealed samples. (ii) Second heating: -100 to 150 °C (after rapid cooling from the 150 °C). This step provides results for unannealed samples. (iii) Cooling from 150 to -100 °C.
The reversing heat flow was converted to heat capacity, Cp, by dividing the heat flow by the underlying heating rate. At
Tg, the change in heat capacity was defined by its derivative as ∆Cp) ∫(dCp/dT) dT. Details pertaining to the analysis are found elsewhere.1
3. Results
3.1. Saturates. The nonreversing heat flow curves
obtained from the heating and cooling experiments are shown in Figure 2. The simplest curve, obtained from cooling, shows multiple exotherms between 40 and -85 °C. Upon heating there is a broad endothermic back-ground that corresponds to the broad exotherm obtained from cooling. As with the original bitumen,1a sharp
low-temperature exotherm overlaps with the background. In the saturates, this exotherm is centered at -50 °C. Annealing has an effect on the profile of the non-reversing heating curve between 20 and 50 °C. The annealed sample (first heating) shows a small exotherm at 27 °C, immediately followed by an endotherm of similar size centered at 35 °C. In the unannealed sample (second heating), these features are absent. However,
(15) Wunderlich, B. Thermochim. Acta 1999, 340/341, 37-52. (16) Wunderlich, B.; Okazaki, I.; Ishikiriyama, K.; Boller, A. Ther-mochim. Acta 1998, 324, 77-85.
(17) Raki, L.; Masson, J-F.; Collins, P. Energy Fuels 2000, 14, 160-163.
(18) Masson, J-F.; Price, T.; Collins, P. Energy Fuels 2001, 15 (4), 955-960.
Figure 1. Total heat flow curve for bitumen. The curve separates into reversing and nonreversing components.
Table 1. Weight Percent Composition of Flash Chromatography Fractions as Measured by TLC-FID
saturates aromatics resins A resins B heptane fraction 100 0 0 0 toluene fraction 0 51 45 4 THF fraction 0 0 93 7
asphaltenes from heptane 0 0 34 66
Figure 2. Nonreversible heat flow curves for the saturates showing the time dependence of the exotherm-endotherm pair at 20-50 °C indicating some steric hardning. The third curve shows ordering during cooling.
the endotherm-exotherm pair slowly reappears over 24 h, after which it is at steady state.
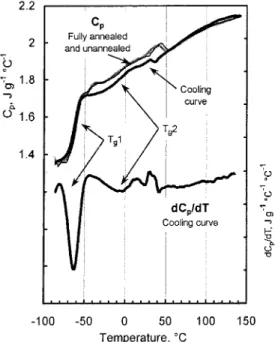
The heat capacity (Cp) curves obtained from the
saturates are shown in Figure 3. The cooling curve is again the simplest. It reveals a strong glass transition (Tg) at -60 °C, a weak Tg at -10 °C, and a small
fluctuation of the heat capacity between 25 and 40 °C. The heating curves show the same features, but the weaker Tgis more difficult to see because of fluctuations
in Cp at -37 and 42 °C, and because of thermal
hysteresis between -50 and 50 °C. The derivative, dCp/
dT, helps identify the Tgregion and center the
transi-tion.
3.2. Aromatics. Upon cooling from 150 °C, the
nonreversing heat flow from the aromatics shows a wide exotherm with a maximum at -15 °C (Figure 4). Upon heating there is a correspondingly broad endotherm and no exotherm rise above a baseline drawn from -60 to 60 °C.
The Cp curves are shown in Figure 5. There is an
overlap of the heating and cooling curves and no thermal hysteresis. These curves show at least two Tg’s,
a strong one centered at -15 °C and a weak one at 65 °C, as confirmed with the derivative curve. There might also be a very weak Tgaround -50 °C, which would be
responsible for the slight asymmetry at the base of the derivative peak at -15 °C.
3.3. Resins. Typical nonreversing heat-flow curves
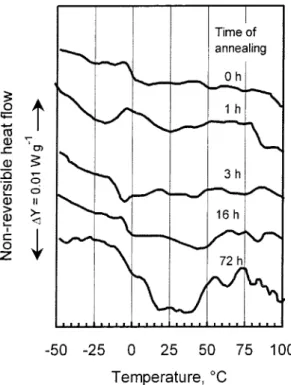
for the resins are shown in Figure 6. The curve for the annealed sample shows a relatively large endotherm between -10 and 60 °C, but the curve for the un-annealed sample only shows a small one. The cooling run shows an exotherm similar in size to the endotherm for the unannealed sample. When the resins are an-nealed at 22 °C, the endotherm returns to its full size in ∼3 days (Figure 7).
The Cpcurves for the resins are shown in Figure 8.
Heating and cooling curves overlap and no thermal hysteresis is observed. In contrast to the main
low-temperature Tg of the aromatics, which is sharp, the
resins show a broad low-temperature Tg. The dCp/dT
curve reveals the presence of two, possibly three, overlapping Tg’s, as indicated by the dotted lines at the
bottom of Figure 8. The larger Tg region, centered at
20 °C, overlaps with a small Tg at 70 °C and possibly
another at -60 °C.
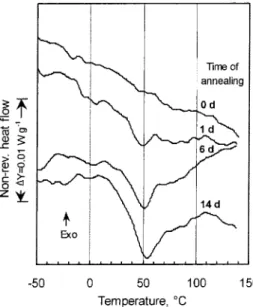
3.4. Asphaltenes. The nonreversing heat flow curves
for fully annealed asphaltenes show an endotherm
Figure 3. Cpcurves for the saturates. The dCp/dT curve helps to highlight the small Tg at -10 °C. The derivative signal between 10 and 50 °C is not a Tg, but arises from reversible melting. See text for details.
Figure 4. Nonreversing heat flow curves for the aromatics obtained upon heating (bottom). Time-independent behavior is shown by the similarity of the curves for annealed and unannealed samples. The upper curve shows an exotherm (ordering) during cooling. The baseline between about -50 and 50 °C helps visualize the exotherms and endotherms.
Figure 5. Cpcurves for the aromatics after a first heating (annealed), second heating (unannealed), and cooling runs show no hysteresis, hence they overlap. The dCp/dT curve reveals a second weak Tg at 70 °C, as shown by the black shade, and possibly a very weak Tgaround -50 °C. See text for details.
centered around 50 °C (Figure 9). The curve for the unannealed sample shows a small, broad endotherm similar in size to the exotherm of the cooling curve. When the asphaltenes are annealed at 22 °C, the endotherm increases to attain steady-state in ∼14 days (Figure 10).
The Cpcurves for the asphaltenes are shown in Figure
11. There is an overlap of the heating and cooling curves and no thermal hysteresis. The Cp curves have an
extended S shape, which reveal an extraordinarily broad Tgregion that extends over 200 °C. Two poorly resolved
Tg’s can be identified in the derivative curve. The dotted
lines in Figure 11 show the deconvoluted Tg’s. The first
transition is centered at 0 °C and the other at 70 °C, with the latter being prevalent.
4. Discussion
4.1. Saturates. Saturates are semicrystalline.8The
endotherms and exotherms shown by the saturates on the nonreversing curves arise from melting and crystal-lization (Figure 2). Upon cooling from 150 °C, the saturates crystallize because of nucleation, which typi-cally begins at a supercooling of 30 to 100 °C.19 The
numerous peaks and the breadth of the exotherm obtained during cooling indicate that a myriad of crystalline structures develop upon cooling. The low temperatures of these peaks suggest that crystal density is low, in accordance with that for low-density poly-olefins.20 The low crystal density, which most likely
(19) Wunderlich, B. Macromolecular Physics; Academic Press: New York, 1976.
(20) Mathot, V. B. F. In New Advances in Polyolefins; Chung, T. C., Ed.; Plenum Press: New York, 1993; Vol. 2, pp 1-30.
Figure 6. Nonreversing heat flow curves for annealed and unannealed resins are different as seen from the increased area under a baseline drawn from -20 to 60 °C (bottom). The upper curve shows the ordering of resins upon cooling from the melt.
Figure 7. Time-dependent nonreversing heat flow curves for resins.
Figure 8. Cpcurves for the resins show no hysteresis. The dCp/dT curve reveals the existence of overlapping Tg’s, as shown by the dotted lines.
Figure 9. Nonreversing heat flow curves for annealed and unannealed asphaltenes are different as seen from the baseline (bottom). The exotherm of the upper curve shows the very slight ordering of asphaltenes upon cooling from the melt.
arises from the polydispersity21and branching of the
saturates,22also suggests that crystals are small and
imperfect. This is confirmed by the existence of a cold crystallization exotherm at -50 °C on the heating curves.
Crystals formed upon cooling will melt during heating to provide the endothermic background. Within this background, exotherms mark the cold crystallization of some saturates. In this process, the small and imperfect crystals that formed upon cooling melt and recrystallize to larger crystals with higher melting points.19 Thus,
the intense cold crystallization peak at -50 °C first detracts and then contributes to the endothermic back-ground. In the same background, the small cold crystal-lization peak at 27 °C gives rise to the small melting peak at 35 °C.
The heating curve for the unannealed saturates shows cold crystallization at -50 °C but not at 27 °C. It takes 1 day of annealing for the cold crystallization peak at 27 °C to reform. This indicates that cold crystallization at -50 and 27 °C arise from the melting and recrystal-lization of crystals built from segments of different sizes and with different diffusion rates. In polymers, an increase in molecular weight reduces the rate of diffu-sion and crystallization.19Hence, it is likely that with
saturates small imperfect crystals with short saturated segments give rise to the cold crystallization at -50 °C, and those with longer, heavier and slower diffusing segments give rise to the cold crystallization at 27 °C. This transition would arise upon heating, but only after heavy segments have had sufficient time to properly group. These segments could be monosubstituted cycloaliphatics (naphthenes), which because of their larger molecular volumes would diffuse more slowly than aliphatic segments.
Crystallization and melting can contribute to Cp
(Figure 3), although they are generally considered irreversible processes. They do so because imperfect crystals have a small region of metastability between crystallization and melting.16 During the modulation
cycle of the MDSC experiment, the crystals have time to perfect and melt. As a result, rapid melting and crystallization appear in the reversing curve. This reversible melting and recrystallization explains the thermal hysteresis in the heat capacity obtained by heating and cooling and the small rises in Cp, at -37
and 42 °C. Interestingly, the original bitumen showed no thermal hysteresis in its Cpcurves,1which indicates
that the saturates had a much lower state of ordering when blended with the other bitumen fractions. How-ever, unpublished work shows that some bitumens exhibit thermal hysteresis.
The change in Cpfor the saturates results not only
from crystalline matter, but also from amorphous mat-ter, which gives rise to two Tg’s. The large Tg in the
region from -75 to -50 °C is consistent with that obtained by regular DSC,23but here it is better resolved
because of the absence of overlap with the cold crystal-lization peak at -50 °C. As a result, MDSC allows for a better assessment of ∆Cp at Tg than regular DSC.
Moreover, in regular DSC, the small Tg at -10 °C is
hidden in the endothermic background. This small Tg
is only observed by MDSC because of the deconvolution of reversing and nonreversing events.
The positions of the two Tg’s provide some indication
of the structure responsible for the transitions. The Tg
increases when the molecular structure becomes more rigid due to the increase in molecular weight, the presence of rings, or polar groups.24Consequently, the
Tgat -60 °C arises from the most flexible segments of
the saturates, whereas that at -10 °C arises from the most rigid segments. Given the presence of linear, branched, and cyclic structures in the saturates,22the
higher Tgmore likely results from the stiffest of those
structures, i.e., the highly branched or cyclic structures. They would also provide for imperfect crystals from which cold crystallization could develop, in accordance
(21) Paramanu, S.; Pruden, B. B.; Rahimi, P. Ind. Eng. Chem. Res.
1999, 38, 3121-3130.
(22) Speight, J. G. Chemistry and Technology of Petroleum, 3rd ed.; Marcel Dekker: New York, 1999.
(23) Claudy, P.; Le´toffe´, J.-M.; King, G. N.; Bruˆle´, B.; Planche J.-P. Fuel Sci. Technol. Int. 1991, 9, 71-92.
(24) Shen, M. C.; Eisenberg, A. Rubber Chem. Technol. 1970, 43, 95-155.
Figure 10. Nonreversing heat flow curves for asphaltenes annealed for 0 to 14 days.
Figure 11. Cpcurves for the asphaltenes show no hysteresis. The dCp/dT curve shows the existence of two overlapping Tg’s, as shown by the dotted lines.
with the nonreversing curve at steady-state. Conse-quently, cold crystallization arises after Tg,19or as seen
here, at the end of the Tgregion. The same is observed
with bitumen.1 Hence, upon heating above the frozen
state defined by the Tg region, diffusion of saturated
segments is again permitted and nearest-neighbor crystallizable segments can crystallize. This explains why cold crystallization occurs at -50 °C in the satu-rates (Tgat -61 °C), and -10 °C in bitumen (Tgat -20
°C).1
The Tg’s of the saturates, which arise from amorphous
matter, are not affected by annealing. In contrast, annealing does affect the internal order of poorly crystalline domains that contain slow diffusing crystal-lizable segments. These segments align over ∼24 h and lead to cold crystallization at 27 °C. In other words, they lead to steric hardening of the saturates. As a result, saturates will also contribute to steric hardening of bitumen. However, the effect may be small due to the weakness of the transition within the saturates, and their dilution and lower relative crystallization within bitumen, as indicated by the absence of thermal hys-teresis in the original mixture.1
4.2. Aromatics. The nonreversing heat flow curves
for the aromatics show no conspicuous exotherm and the Cp curves show no hysteresis (Figures 4 and 5).
Aromatics thus lack a crystalline phase, but they are not completely disordered. Low intensity exotherms and endotherms in the reversing and nonreversing curves indicate the existence of order-disorder transitions. The ordered phase is likely a mesophase (an ordered amor-phous phase), in contrast to the crystalline (ordered) and amorphous (disordered) phases.
The aromatics have a large Tgflanked by one or two
weaker transitions. The Tgat 70 °C is observed in the
original bitumen (Figure 1) and in all fractions that contain aromatic structures. This Tglikely arises from
an aromatic structure common to all fractions except the saturates. Given that the intensity of the transition increases in the order aromatics < resins < asphaltenes, it may arise from multi-ring structures, whose concen-tration increase in the same order.22 In contrast, the
presence of a very weak Tgaround -50 °C is uncertain,
but it would be consistent with the existence of satu-rated segments bonded to more rigid molecules that give rise to the Tgregion centered at -15 °C.
The position of the thermal events in both the reversing and nonreversing curves were not affected by annealing. Hence aromatics did not contribute to steric hardening of bitumen. It is noteworthy, however, that aromatics fractionated from other bitumens have shown exotherms that rise above a baseline drawn from -60 to 100 °C.25 It is likely that aromatics with long or
stereoregular saturated segments can crystallize. Hence, like the saturates, they may contribute to steric harden-ing.
4.3. Resins. The nonreversing heat flow curves show
no exotherm and the Cpcurves for the resins show no
hysteresis (Figures 6 and 8). The resins are thus mostly, if not completely, amorphous. The presence of two, possibly three, Tg’s highlights the existence of distinct
structural segments in resins, whereas the breadth of the main Tg, 85 °C, is consistent with that of a
multi-component mixture. Like the aromatics, the resins show a Tg centered at 70 °C. The relative intensity of that
transition indicates that the structures from which it arises are in greater concentration in the resins than in the aromatics. The Tgaround -60 °C is somewhat
uncertain, but it is close to that for saturates. This Tg
would be consistent with the presence of saturated segments in resins, as postulated by Speight,26and the
strong methylene and methyl absorbances in infrared spectra of resins.27
The Tg’s of the resins are not affected by annealing,
as the Cp curves remain unchanged over time. In
contrast, the nonreversing curve is time-dependent (Figure 7). The growth of an endotherm due to ordering of the resins indicates that they play a role in the steric hardening of bitumen. From the amorphous nature of the resins, the relatively high aromaticity,21 and the
somewhat slow ordering process, it is likely that this fraction forms a mesophase whose order is high enough to provide an endotherm in the nonreversing curve, but not high enough to affect Tg.
4.4. Asphaltenes. Like the resins and the aromatics,
the asphaltenes show no exotherm in the nonreversing heat flow curves obtained upon heating, and no thermal hysteresis in the Cp curve (Figures 9-11). They thus
lack a crystalline phase, but like the resins they have an ordered amorphous phase. Indeed, a mesophase grows over ∼2 weeks, which is seen as an endotherm of increasing size at 50°C (Figure 10). At steady-state, the size of the endotherm is larger than that of the resins. The asphaltenes thus contribute the most to the steric hardening of the original bitumen.
The amorphous domains in asphaltenes give rise to two extraordinarily broad and poorly resolved Tg’s
(Figure 11). The breadth of the transitions indicates that asphaltenes are polydisperse and heterogeneous. In other words, each Tg could be the overlap of several
small Tg’s. As Tgincreases with the polarity,
aromatic-ity, and molecular weight of the amorphous phase from which it originates,24the T
gat 0 °C may arise from polar
aliphatic segments whereas that at 70 °C may arise from oligo-aromatic structures. The higher relative concentration of these structures in the asphaltenes may be responsible for the higher intensity of the Tgat 70
°C as compared with the other fractions. The Tg’s for
the asphaltenes is independent of time.
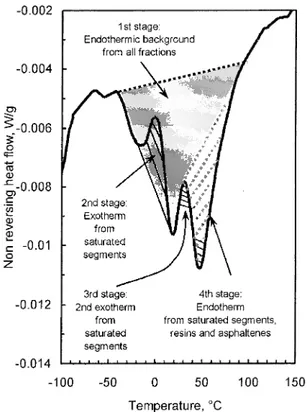
4.5. Bitumen. The thermal curves for bitumen are
more than the sum of its fractions. Nonetheless, there are some similarities between the nonreversing curves that makes it possible to relate the features of the bitumen curve to individual fractions as shown in Figure 12. Four stages, instead of three as reported earlier,1
were identified in the development of bitumen micro-structure. A rapid first stage, which overlaps with the second one provides the endothermic background. As demonstrated earlier,1the background arises from the
rapid ordering of saturated and aromatic segments upon cooling. As shown here, it arises from all fractions, but asphaltenes contribute the least. This ordering may be orchestrated by a collection of weak intermolecular interactions between alkylated and aromatic segments
(25) Masson, J-F.; Polomark, G. Unpublished results.
(26) Speight, J. G. Chemistry and Technology of Petroleum, 2nd ed.; Marcel Dekker: New York, 1981; p 441.
(27) Christy, A. A.; Dahl, B.; Kvalheim, O. M. Fuel 1989, 68, 430-435.
in an arrangement that facilitate the interactions of C-H bonds with π-electrons. The CH/π interaction is the weakest of the hydrogen bonds, but it is ubiquitous. As a result, it is thought to govern the conformation of many chemical systems,28and it may play an important
role in bitumen microstructure. The second stage arises from the crystallization of low molecular weight satu-rated segments in saturates and other fractions, a process that takes about 3 h.1It is noteworthy that the
original bitumen showed no thermal hysteresis in its Cp curves,1 which indicates that the saturates had a
much lower state of ordering when blended with the other fractions.
The third and fourth stages overlap (Figure 12). This is not immediately clear and it makes for a confusing curve and difficult analysis of bitumen that is only resolved by the analysis of its fractions. The third stage relates to a time-dependent crystallization of high molecular weight saturated segments. The process is similar to that of the second stage, but it is slower as seen with the fractions. The fourth stage, the develop-ment of an endotherm at 40-50 °C, is the slowest stage, which arises from resins and asphaltenes mesophases. Upon heating, there is an overlap of a melting peak from the saturated segments that crystallize in the third stage with the isotropization of resins and asphaltenes mesophases.
It is the time-dependent development of bitumen microstructure that causes the room-temperature steric hardening of bitumen. Stages 3 and 4 are thus
respon-sible for steric hardening. Work on the bitumen fractions indicates that saturates contribute slightly to steric hardening, resins contribute more, and that asphaltenes contribute the most.
5. Conclusion
Bitumen fractions rich in saturates, aromatics, resins, or asphaltenes were analyzed by MDSC both before and after annealing at room temperature. MDSC allows for the separation of Tg’s from order-disorder transitions.
The Cp curves revealed at least two Tg’s for each
fraction, and the combined Cp and nonreversing heat
flow curves allowed for an assessment of the state of order of each fraction.
The saturates showed thermal hysteresis between the heating and cooling Cpcurves due to crystallinity. The
nonreversing curve showed exothermic signals from two distinct crystalline phases. At low temperatures, a first phase develops immediately upon cooling from the melt. A second phase develops slowly over 1 day at room temperature. This second phase contributes to steric hardening. In contrast, the aromatics contained little crystalline material, if any, and showed no time depen-dence, and thus no steric hardening. However, aroma-tics that can crystallize may contribute to steric harden-ing. The resins and the asphaltenes were both affected by annealing, as time allowed for the formation of a phase of intermediate order between the amorphous and crystalline phases, i.e., a mesophase. Resins and as-phaltenes achieved steady state in about 1 and 14 days, respectively. This indicated that both fractions contrib-ute to steric hardening of bitumen.
A comparison of the nonreversing thermal curves for the original bitumen and its fractions allows for the identification of four stages in the development of bitumen microstructures. Steric hardening is the result of two mechanisms, i.e., the third and fourth stages. The third stage is the slow crystallization of high molecular weight saturated segments, e.g., cycloaliphatics, and the fourth stage is the slow formation of a mesophase due to resins and asphaltenes. The contribution of the asphaltenes to steric hardening is predominant, but that of the maltenes is not negligeable. They have a large influence on the kinetics aspect. For example, asphalt-enes alone showed hardening during 14 days, but the original bitumen showed hardening during only 2-3 days.
There are three corollaries to this study. First, the increased concentration of resins and asphaltenes in oxidized bitumen explains the increased steric harden-ing of oxidized or blown bitumen over the unoxidized material. Second, the rheological testing of bitumen, which is most often started 1 h after cooling from the melt, would gain in reproducibility if started 24 h after cooling when much of the bitumen microstructure has redeveloped. Third, like its fractions, bitumen shows multiple Tg’s. It is therefore likely that physical
harden-ing, which occurs below Tg, is related to all the Tg’s, and
not only to the most intense, sub-zero Tg. This would
explain the paradoxal physical hardening that seems to occur above Tg.
EF010233R
(28) Nishio, M.; Minoru, H.; Umezawa, Y. The CH/π Interaction: Evidence, Nature and Consequences; Wiley-VCH: New York, 1998. Figure 12. The nonreversing heat flow curve for the original bitumen, and the origin of the various stages of microstructure development. Stages 3 and 4 are responsible for steric harden-ing.