READ THESE TERMS AND CONDITIONS CAREFULLY BEFORE USING THIS WEBSITE.
https://nrc-publications.canada.ca/eng/copyright
Vous avez des questions? Nous pouvons vous aider. Pour communiquer directement avec un auteur, consultez la
première page de la revue dans laquelle son article a été publié afin de trouver ses coordonnées. Si vous n’arrivez pas à les repérer, communiquez avec nous à PublicationsArchive-ArchivesPublications@nrc-cnrc.gc.ca.
Questions? Contact the NRC Publications Archive team at
PublicationsArchive-ArchivesPublications@nrc-cnrc.gc.ca. If you wish to email the authors directly, please see the first page of the publication for their contact information.
NRC Publications Archive
Archives des publications du CNRC
This publication could be one of several versions: author’s original, accepted manuscript or the publisher’s version. / La version de cette publication peut être l’une des suivantes : la version prépublication de l’auteur, la version acceptée du manuscrit ou la version de l’éditeur.
Access and use of this website and the material on it are subject to the Terms and Conditions set forth at
Prediction of VOC concentration profiles in a newly constructed house using small chamber data and an IAQ simulation program
Magee, R. J.; Bodalal, A.; Biesenthal, T. A.; Lusztyk, E.; Brouzes, M. A.; Shaw, C. Y.
https://publications-cnrc.canada.ca/fra/droits
L’accès à ce site Web et l’utilisation de son contenu sont assujettis aux conditions présentées dans le site LISEZ CES CONDITIONS ATTENTIVEMENT AVANT D’UTILISER CE SITE WEB.
NRC Publications Record / Notice d'Archives des publications de CNRC: https://nrc-publications.canada.ca/eng/view/object/?id=f34275da-4f18-4466-ace6-a851af9c5948 https://publications-cnrc.canada.ca/fra/voir/objet/?id=f34275da-4f18-4466-ace6-a851af9c5948
Prediction of VOC concentration profiles in a newly constructed house using small chamber data and an IAQ simulation program
RJ Magee, A Bodalal, TA Biesenthal, E Lusztyk, M Brouzes, and CY Shaw
A version of this document is published in / Une version de ce document se trouve dans : Indoor Air 2002, 9th International Conference on IAQ and Climate, Monterey, California,
June 2002, pp. 298-303
www.nrc.ca/irc/ircpubs
PREDICTION OF VOC CONCENTRATION PROFILES IN A NEWLY
CONSTRUCTED HOUSE USING SMALL CHAMBER DATA AND AN
IAQ SIMULATION PROGRAM.
RJ Magee1∗, A Bodalal1, TA Biesenthal1, E Lusztyk1, M Brouzes1, and CY Shaw1
1
Indoor Environment Program, Institute for Research in Construction, National Research Council of Canada.
ABSTRACT
The ability of the Material Emission Database and Indoor Air Quality simulation program (“MEDB-IAQ”) to use small chamber test results to model volatile organic compound (VOC) profiles in a newly constructed 2-storey single family home was evaluated. Selected building materials used in the construction of the CCHT (Canadian Centre for Housing Technology) “Reference” house were collected and subjected to chamber testing. VOC emission rates were modeled from the results and entered into MEDB-IAQ. A simulation of the house construction and subsequent operation for an additional nine months was then run with the software package. Air exchange rate data from the house was also used as model input. Predicted VOC results were then compared with air samples taken from the house and analyzed by GC/MS. Prediction accuracy depended on source complexity, source identification and emitting area, and on sink effects. Trends in relative contributions of individual materials could be readily identified.
INDEX TERMS
VOC emissions; building materials; indoor air quality; modeling/simulation; chamber testing
INTRODUCTION
Materials used in the initial construction, retrofit, or refinishing of buildings may be significant sources of VOCs in the indoor environment (Yu and Crump, 1998; Wolkoff, 1999). A great deal of effort by many different groups has focussed on developing techniques for the evaluation (chamber testing) and modeling of VOC emissions from building materials (Guo and Tichenor, 1992; Yang et al., 2001a and b; Zhu et al., 1998). Adsorption and re-emission of VOCs, i.e. the “sink” effect, is an important aspect of this latter effort (Won et al., 2001). Only with reliable emission/adsorption/re-emission data and proven emission models can we attempt realistic simulations of VOC emissions in the indoor environment. We are still at the early stages in the development of these tools. Since the output from simulation
attempts reflects the quality of the input data, detailed knowledge of the modeled environment, coupled with precise estimations of VOC emission characteristics of key building materials are essential requirements for modeling the indoor environment. The Materials Emission DataBase and IAQ Simulation Program (“MEDB-IAQ”) was developed for this reason (Zhang et al., 1999). The MEDB-IAQ package allows users to: 1) select building materials from a database of carefully controlled chamber tests of VOC emissions, 2) specify building ventilation rates and schedules, and, 3) use a single zone model to predict
resultant VOC concentrations. An opportunity to evaluate MEDB-IAQ’s capabilities arose with the construction of identical R-2000 specification two-story research houses at the Canadian Centre for Housing Technology (CCHT) in Ottawa.
METHODS
Throughout the construction of the CCHT Reference house, details regarding building materials and their installation were carefully documented. Regular VOC sampling (multisorbent tubes, GC/MS analysis) and air change rate monitoring (tracer decay) was conducted during the nine-month period following completion of the house. Temperature and humidity conditions in the house were also continuously monitored. Of the hundreds of building materials used in the construction of the CCHT Reference house, 12 were selected for detailed emissions testing based on their VOC source strength and/or large emitting surface areas. Samples of these materials were collected directly from the construction site and subjected to VOC emission testing in small (50L) environmental chambers according to guidelines presented in ASTM D5116 (ASTM, 1997). Further details of the testing protocols can be found in Zhu et al., 1998. The emission characteristics of the wet building materials (paint/primer, stains, caulking) were determined using the segmented VB-power law model (Guo Z, Tichenor BA. 1992). A power law model was employed to fit the emission
characteristics of the dry materials. The model coefficients were entered into the MEDB-IAQ database, which was then used to simulate entry of the selected building materials and
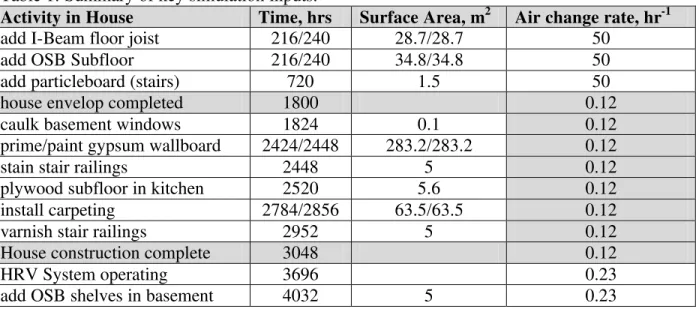
generate VOC estimations at 1h intervals for the 10,000 hour simulation period (approx. 14 months) commencing with the house foundation pour. The house volume was 794.3 m3. Table 1 summarizes the modeled air change rates and the exposed surface areas (carefully measured following completion of the house) and entry times for the modeled building materials. Note that in some cases the installations were split over several days. Table 1: Summary of key simulation inputs.
Activity in House Time, hrs Surface Area, m2 Air change rate, hr-1
add I-Beam floor joist 216/240 28.7/28.7 50 add OSB Subfloor 216/240 34.8/34.8 50 add particleboard (stairs) 720 1.5 50 house envelop completed 1800 0.12 caulk basement windows 1824 0.1 0.12 prime/paint gypsum wallboard 2424/2448 283.2/283.2 0.12 stain stair railings 2448 5 0.12 plywood subfloor in kitchen 2520 5.6 0.12 install carpeting 2784/2856 63.5/63.5 0.12 varnish stair railings 2952 5 0.12 House construction complete 3048 0.12 HRV System operating 3696 0.23 add OSB shelves in basement 4032 5 0.23
RESULTS
GC/MS analysis of the air samples from the chamber tests of the 12 building materials identified almost 200 individual VOCs. Four to six VOCs per material were selected for detailed analysis / modeling / input into MEDB-IAQ. Figure 1 shows the predicted
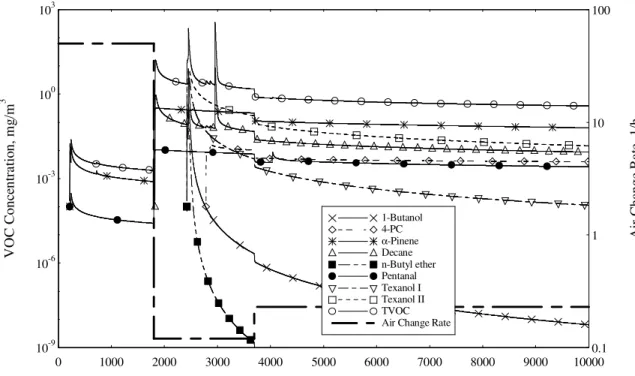
contribution of each building material to the TVOC levels. Figure 2 shows the estimated total emission of selected VOCs. Spikes evident in the VOC levels were the result of either a step
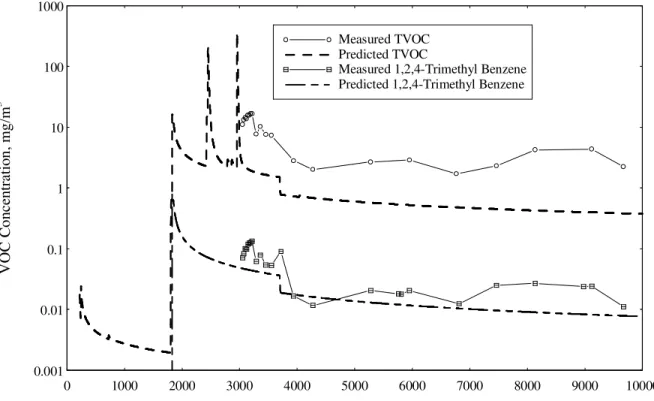
change in the modeled air change rate, or the entry of a building material with a relatively strong source strength (e.g. caulking at 1824h; paint / woodstain at ~2440h; varnish at 2952h). Figure 3 compares modeled and measured values of TVOC and 1,2,4-trimethyl benzene (released from the caulking). Figure 4 shows the individual contributions of the four decane-emitting building materials and compares the predicted total with the measured levels.
Figure 1. Contribution of individual building materials to TVOC level in the house.
Figure 2. Predicted levels of individual VOCs in the house. 10-9 10-6 10-3 100 103 0 1000 2000 3000 4000 5000 6000 7000 8000 9000 10000 0.1 1 10 100 1-Butanol 4-PC α-Pinene Decane n-Butyl ether Pentanal Texanol I Texanol II TVOC Air Change Rate
Elapsed Time, hours
V O C C on ce n tr a ti o n , m g /m 3 A ir C h ang e R a te , 1 /h 0.00001 0.001 0.1 10 1000 0.0001 0.01 1 100 0 1000 2000 3000 4000 5000 6000 7000 8000 9000 10000 0.1 1 10 100 Total Carpet Caulking I-beam floor joist OSB subfloor OSB shelves Paint/Primer/Drywall Particleboard Plywood Woodstain Varnish Air Change Rate
Elapsed Time from House Foundation Pour, hours
VO C C on ce n tr a ti on , m g /m 3 A ir C h ang e R a te , 1 /h
Figure 3. Predicted vs. measured levels of TVOC and 1,2,4-trimethyl benzene in the house.
Figure 4. Predicted vs. measured levels of decane in the house.
0.001 0.1 10 1000 0.01 1 100 0 1000 2000 3000 4000 5000 6000 7000 8000 9000 10000 Measured TVOC Predicted TVOC
Measured 1,2,4-Trimethyl Benzene Predicted 1,2,4-Trimethyl Benzene
Elapsed Time from House Foundation Pour, hours
VO C C o n ce n tr ati on , m g /m 3 0.00001 0.001 0.1 10 0.0001 0.01 1 0 1000 2000 3000 4000 5000 6000 7000 8000 9000 10000 Measured Decane Total Predicted Decane predicted from Carpet predicted from Caulking predicted from Varnish predicted from Woodstain
Elapsed Time from House Foundation Pour, hours
D ec a n e C on ce n tr a ti on , m g /m 3
DISCUSSION
Completion of the exterior structure of the house at 1800 hours, coupled with the simulated caulking of the basement windows triggers a predicted spike in the TVOC level to
approximately 14 mg/m3 (Figure 1). Combined painting and woodstaining cause a spike to almost 200 mg/m3, while the varnishing of the stair banister was predicted to produce a 360 mg/m3 spike. As indicated in Figure 1, the TVOC contributions of the materials responsible for the massive 2nd and 3rd spikes are relatively short-lived. Their major VOC components are predicted to undergo a rapid decay in emission rates, with the result that the relatively tiny emitting surface of the caulking material (0.1 m2) rapidly becomes the dominant VOC source. The engineered wood I-beam floor joists and the OSB sub-flooring become the 2nd and 3rd most significant VOC sources in the model. Figure 2 indicates that of the modeled VOCs, α -pinene becomes dominant (main source: I-beam); Texanol-II (paint and primer) and decane (see Figure 4 for sources) are the next highest in predicted concentration.
Figure 3 shows that the modeled results generally under-predict the TVOC values in the house. This is not surprising, since despite efforts to model the strongest and largest sources, only a small fraction of the total building materials were modeled, and their actual exposed emitting surfaces were uncertain (leakage in wall cavities, flooring assemblies, etc). After approximately 8000 h, the simulation predicted TVOC values of approximately 0.4 mg/m3 while the measured values were approximately 10 times higher. This discrepancy can be further explained in that while the model used an average value of 0.23 h-1 for the final stage of house operation, the actual air change rate at this time had dropped to about 0.20 h-1. Observed variations in the internal temperature and relative humidity levels in the house were also likely to impact the VOC levels. Poorly understood at present, the model made no attempt to model the impact of these environmental factors. There also appears to be a significant sink effect, as evidenced by the shifted peak for the measured TVOC values at around 3200h.
Figure 3 also shows that for a VOC such as 1,2,4-trimethyl benzene with a single, well-defined source (caulking), the model predictions were close to reality. On the other hand, a compound such as decane with multiple sources, proved harder to predict (Figure 4). The simulation does clearly predict the relative source strengths for the decane emission, with caulking being by far the dominant source of this compound.
CONCLUSION AND IMPLICATIONS
Given our current knowledge of the nature and influences of VOC emissions from building materials, simulation tools such as that found in MEDB-IAQ are not expected to provide precise estimations of VOC levels in indoor environments. They can however provide good indications of relative source strengths of individual materials, as well as general emission characteristics of individual VOCs. Much needed work is currently underway geared at refining and improving the models governing these simulations. The impact of environmental conditions on VOC emissions is of interest, as is greater understanding of VOC sink
dynamics. The current database of carefully controlled emission studies for building
materials is extremely limited, but is gradually expanding. MEDB-IAQ is a work in progress. Simulation capabilities are being expanded, data input and handling procedures are being refined. As our knowledge of VOCs grows, the choice of compounds for detailed modeling will be continuously revised.
ACKNOWLEDGEMENTS
Jianshun Zhang was project manager for the research leading to the initial development of the MEDB-IAQ model and the establishment of the chamber testing methods that form the basis of the VOC emissions database. Dan Sander has provided essential input in the ongoing development of the MEDB-IAQ package. The partners in the CCHT Project are gratefully acknowledged (www.ccht-cctr.gc.ca).
REFERENCES
ASTM 1997. ASTM Standard D5116 Standard Guide for Small-Scale Environmental Chamber Determinations of Organic Emissions From Indoor Materials/Products. American Society for Testing and Materials.
Guo Z, Tichenor BA. 1992 Fundamental mass transfer models applied to evaluating the emissions of vapor-phase organics from interior architectural coatings. EPA/AWMA Symposium, Durham, NC.
Wolkoff P. 1999. How to measure and evaluate volatile organic compound emissions from building products. A perspective. The Science of the Total Environment. Vol. 227, pp 197-213.
Won D, Sander DM, Shaw CY, Corsi RL. 2001. Validation of the surface sink model for sorptive interactions between VOCs and indoor materials. Atmospheric Environment. Vol. 35, pp 4479-4488.
Yang X, Chen Q, Zeng J, et al. 2001. A mass transfer model for simulating volatile organic compound emissions from 'wet' coating materials applied to absorptive substrates. International Journal of Heat and Mass Transfer. Vol. 44(9), pp 1803-1815.
Yang X, Chen Q, Zhang JS, et al. 2001. Numerical simulation of VOC emissions from dry materials. Building and Environment, Vol. 36, pp 1099-1107.
Yu C, Crump D. 1998. A review of the emission of VOCs from polymeric materials used in buildings. Building and Environment. Vol. 33 (6), pp 357-374.
Zhang JS, Zhu JP, Magee RJ, et al. 1999. A Database of VOC emissions from building materials. First NSF International Conference on Indoor Air Health (Denver, Colorado, 5/3/99), pp 87-96.
Zhu JP, Zhang JS, Lusztyk E, Magee RJ. 1998. Measurements of VOC emissions from three building materials using small environmental chamber under defined standard test conditions. Air & Waste Management Association 91st Annual Meeting & Exhibition (San Diego), pp 1-16.