Publisher’s version / Version de l'éditeur:
Journal of Thermal Analysis and Calorimetry, 78, 1, pp. 145-152, 2004-09-01
READ THESE TERMS AND CONDITIONS CAREFULLY BEFORE USING THIS WEBSITE.
https://nrc-publications.canada.ca/eng/copyright
Vous avez des questions? Nous pouvons vous aider. Pour communiquer directement avec un auteur, consultez la
première page de la revue dans laquelle son article a été publié afin de trouver ses coordonnées. Si vous n’arrivez pas à les repérer, communiquez avec nous à PublicationsArchive-ArchivesPublications@nrc-cnrc.gc.ca.
Questions? Contact the NRC Publications Archive team at
PublicationsArchive-ArchivesPublications@nrc-cnrc.gc.ca. If you wish to email the authors directly, please see the first page of the publication for their contact information.
NRC Publications Archive
Archives des publications du CNRC
This publication could be one of several versions: author’s original, accepted manuscript or the publisher’s version. / La version de cette publication peut être l’une des suivantes : la version prépublication de l’auteur, la version acceptée du manuscrit ou la version de l’éditeur.
For the publisher’s version, please access the DOI link below./ Pour consulter la version de l’éditeur, utilisez le lien DOI ci-dessous.
https://doi.org/10.1023/B:JTAN.0000042162.20289.ab
Access and use of this website and the material on it are subject to the Terms and Conditions set forth at
The Microstructure and optical transmittance thermal analysis of sodium borosilicate bio-glasses
Mojumdar, S. C.; Kozánková, J.; Chocholousek, J.; Majling, J.; Nemecek, V.
https://publications-cnrc.canada.ca/fra/droits
L’accès à ce site Web et l’utilisation de son contenu sont assujettis aux conditions présentées dans le site LISEZ CES CONDITIONS ATTENTIVEMENT AVANT D’UTILISER CE SITE WEB.
NRC Publications Record / Notice d'Archives des publications de CNRC:
https://nrc-publications.canada.ca/eng/view/object/?id=88fdca7e-4977-440b-af3a-406797da23e8 https://publications-cnrc.canada.ca/fra/voir/objet/?id=88fdca7e-4977-440b-af3a-406797da23e8
The Microstructure and optical transmittance thermal analysis of sodium borosilicate bio-glasses
Mojumdar, S.C.;Kozánková, J.; Chocholousek, J.; Majling, J.; Nemecek, V.
NRCC-47323
A version of this document is published in / Une version de ce document se trouve dans : Journal of Thermal Analysis and Calorimetry, v. 78, no. 1, Sept. 2004,
pp. 145-152 doi:10/1023/B:JTAN.0000042162.20289.ab
THE MICROSTRUCTURE AND OPTICAL TRANSMITTANCE THERMAL ANALYSIS OF SODIUM BOROSILICATE BIO-GLASSES
S. C. Mojumdar1*, J. Kozánková2, J. Chocholoušek3, J. Majling2 and V. Nemecek2
1
Institute for Research in Construction, National Research Council of Canada, M-20, 1200 Montreal Road, Ottawa, Ontario K1A 0R6, Canada, E-Mail: Subhash.Mojumdar@nrc-cnrc.gc.ca, scmojumdar@hotmail.com
2
Department of Ceramics, Glass and Cement, Slovak University of Technology, Radlinskeho-9, SK-81237 Bratislava, Slovakia
3
Technické sklo (Technical Glass), 844 03 Bratislava, Slovakia
Abstract
The conditions to fabricate the bulk porous specimens have been studied on account of sodium borosilicate (NBS) glasses. Glass composition, heat treatment at phase separation and TiO2
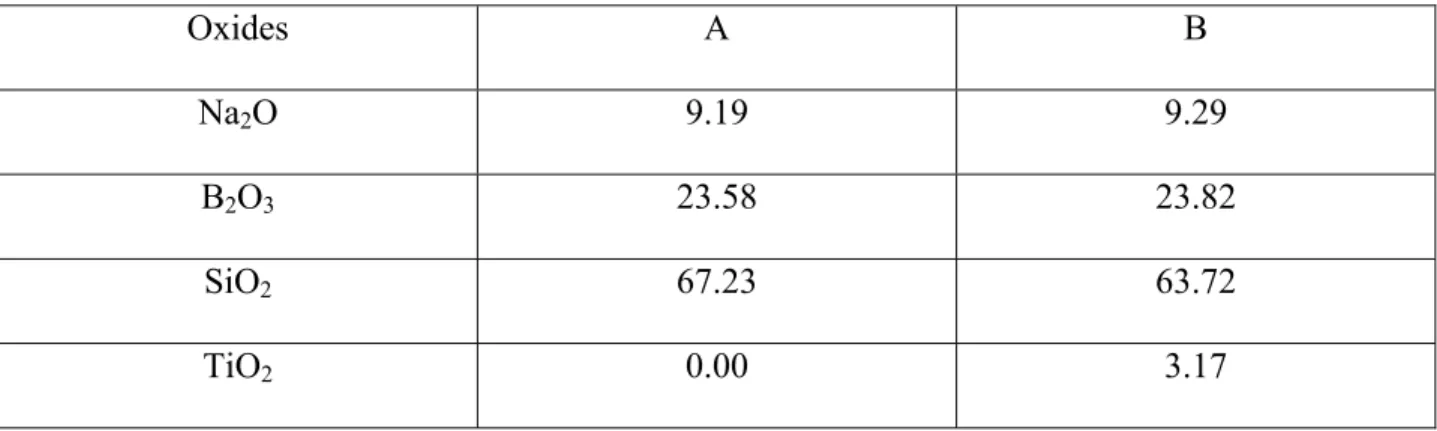
addition have been considered in this study. Original glass samples of composition in mol%: sample A: 9.19 Na2O – 23.58 B2O3 – 67.23 SiO2, sample B: 9.29 Na2O – 3.17 TiO2 – 23.82 B2O3
– 63.72 SiO2 were prepared by melting reagent grade chemicals (Na2CO3, HBO3, SiO2 and
AgNO3) in platinum crucibles at 1480°C for 1h in air. The melts were poured onto stainless steel
plates and were annealed at 500°C for 0.5h after cooling. Thus, obtained samples were phase separated at 700°C for 2, 15, 25 and 50h to study their microstructure by scanning electron microscope (SEM). Besides the direct study of the microstructure by SEM, information on glass structural changes of samples are provided by measuring in situ changes by the optical transmittance thermal analysis. The isothermal measurements were carried out at 700, 720 and
740°C. The temperature of phase separation, the leaching and nucleator addition (TiO2),
significantly influence the microstructure of the resulting leached product. TiO2 additive seems
to suppress crystallization of cristobalite: especially at the extended above heat treatment phase separation runs. The phase-separated domains of glasses containing above 80 moles of SiO2 are
so small that it is very hard to observe them by SEM. The glass composition in our case was selected in a way to have relatively large phase separated areas easily observed by SEM at magnification 20,000x. The influence of TiO2 is not too pronounced. It seems to suppress the
cristobalite crystallization, especially of longer heating runs. The image analysis of leached glasses shows the prevailing content of the skeletal phase in a comparison to pores. The TiO2
content diminishes the content of the skeletal phase.
Keywords: sodium borosilicate bio-glasses, microstructure, optical transmittance thermal
analysis, SEM, optical microscopy * Author for correspondence
Introduction
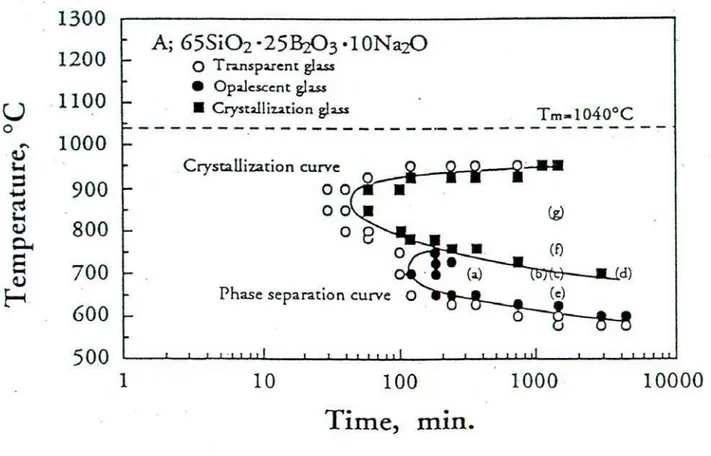
Porous glasses, such as sodium borosilicate glasses are very important from biological point of view due to their utilization in medicine as a soft porous filter as well as a protector from corrosion. Phase separation, in a spinoidal separation region (Fig. 1 and 2), is used in a well-known process for making special porous and nonporous glasses [1-3]. In this process, a sodium borosilicate glass melt cooled below its liquidus temperature separates into two intertwined phases: a phase soluble in acid solutions, and insoluble phase. Leaching of phase-separated glass in acid solution removes the acid-soluble phase leaving behind a porous glass consisting of the insoluble phase. The pore size of the remaining phase depends on the composition of the original glass and on the subsequent heat treatment (Figures 1, 2 and 3). The porous glasses have
industrial utilization as a nanofiltration membrane [4]. VYCOR porous glass is mechanically hard and strong, nondusting, nonflaking, and chemically inert. These properties permit it to be employed as a noncontaminating getter since it rapidly absorbs water and organic contaminants. Vycor porous glass (fy Corning) is often used for filtration and separation of compounds. The open-cell network allows permeability on a selective basis. The species must be smaller than the microscopic pores to pass through the porous glass. (The homogeneous pore diameters can be controlled to average between 4 and 20nm). Advantages of VYCOR porous glass for filtration include rigidity, chemical inertness, high temperature capability (up to 600°C), superior thermal shock resistance (up to 600°C when dry), and controlled microporosity. These advantages allow higher processing temperatures, back flushing or burnout cleansing and processing of most corrosive products. The aim of this study is to synthesize new bio-glasses, and study the influence of TiO2 addition, the leaching with HCl and HF, microstructure, the temperature of
phase separation as well as the presence of communicative pores with an assessment of their size by optical microscopy.
Experimental
Glass Preparation
Original glass samples A and B (Table 1) were prepared by melting reagent grade chemicals (Na2CO3, H3BO3, SiO2, TiO2) in platinum crucibles at 1480°C for 1h in air. The melts were
poured onto stainless steel plates and after cooling they were annealed at 500 °C for 0.5h. No phase separation was observed after glass annealing (SEM on etched samples). Thus obtained glasses were cut to square slabs (10x10x2 mm) and heat treated at 700 °C for 2, 15, 25, 50h. Glass composition was checked after the preparation using flame photometry (Na2O), classical
volumetry (B2O3) and gravimetry (SiO2) methods and ICP method (TiO2). The variation between
experimental and theoretical values was < 0.1 % in case of all oxides.
Measurements
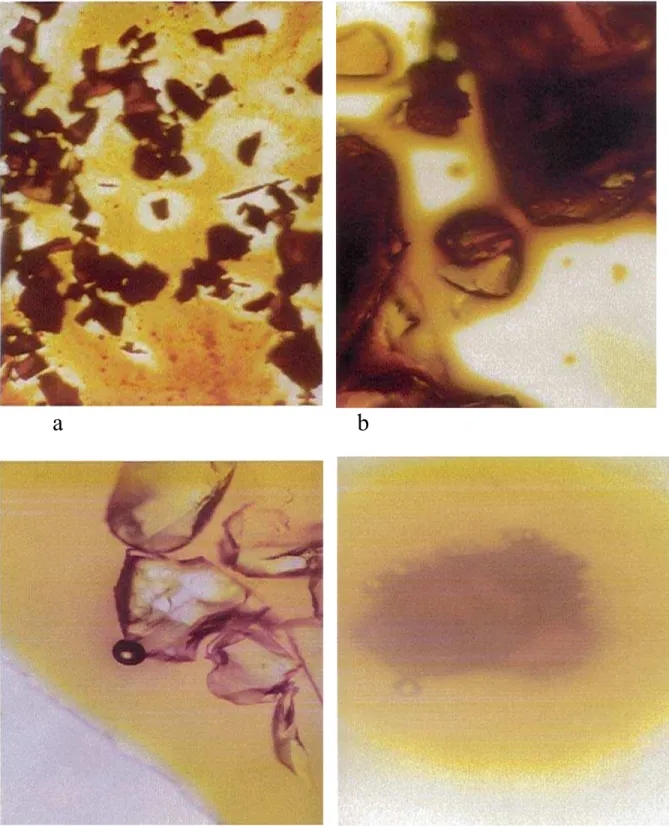
Optical microscopy was also used to identify the presence of communicative pores with an assessment of their size. For the optical microscopic analysis, the glass pieces were leached in 3M HCl aqueous solutions, at room temperature for 168h, and afterwards immersed in respective 10% iodine in ethanol and methylorange in water solutions. NBS glass samples after 50h phase separation at 700 °C, immersed in ethanol iodine solution (Figure 5 a, b) and in water methyorange solution (Figure 5 c, d) behave differently. Iodine was used because of its size could enter the pores of leached glass, coloring the glass fragments to brown. Larger molecules of methyl orange do not enter the pores. They remain on the fragments surface. Sucked water expulses air in the form of bubbles.
The phase separated glass pieces (plates) were “hammer” broken to smaller 2-3 mm pieces. Thus prepared fracture surfaces of the glass samples were further leached in 2% HF aqueous solutions at room temperature for 30, 60, 90 s and cleansed by the ultrasound. Samples of the glasses for SEM examination were prepared in form of fragments. After coating of fracture surfaces by sputter coating with gold in a BALZERS SCD 050 the samples were examined in SEM TESLA BS-300 with digital unit TESCAN. In all cases we compared the microstructure of non-etched fracture surfaces of samples with samples of glasses after etching with 2% HF, alike in the works of Moisescu and Yue [5, 6]. The samples were etched at a laboratory temperature during 10, 20 and 30 seconds. Etching with HF is based on a fact that the amorphous phase is etched faster and therefore the crystal phase is emphasized. This principle was explained elsewhere [7]. The inner structure of glass is than uncovered.
Optical transmittance measurements were accomplished using an instrument described elsewhere [8-10]. The “white” light emitting diode (LED) was used as a light source. The light illuminates the sample plate perpendicularly. The transmitted light intensity is evaluated by Si-photodiode. Electric furnace temperature control and data processing are accomplished by a program, written using Genie (Advantech Development Environment) Software, running under Windows Operation System on PC.
Results and discussion
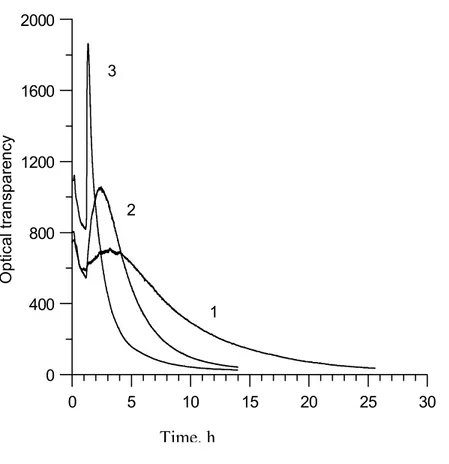
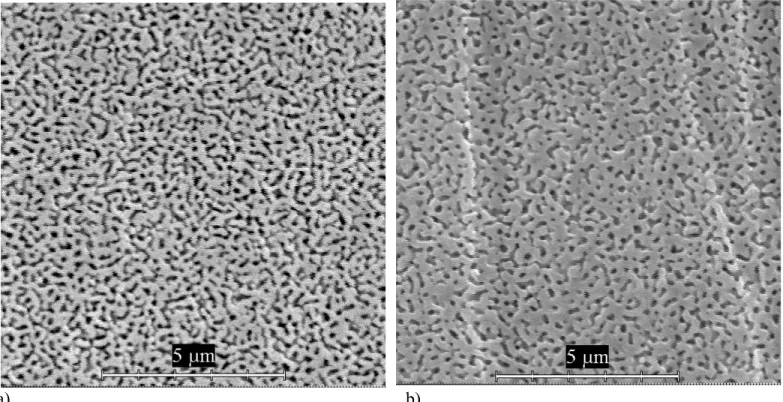
During the spinoidal separation two mutually penetrating phases with vermicular microstructure are being created, as seen in Fig. 7. The spinoidal separation at particular temperature starts when originally transparent glass matrix becames opalescent (Fig. 3) because of the diffusive light (scattering) reflexion on phase boundaries. The preliminary experiments to this respect were made using optical transmittance measurements [8-10] during isothermal glass sample treatment at temperatures 700, 720 and 740 °C. Here in Fig 4, the ordinate axis means the transmitted light intensity expressed in arbitrary units. Because of the diference in our glass composition with respect to the glass in Fig. 3 [3] no direct comparison of the onsets of phase separations can be made. Lesser amounts of the Na2O and B2O3 in our glass means that the phase separation, either
spinoidal, or by the crystallization, will be shifted to longer times. From this reason one would tend to accept the local maxima on curves in Fig. 4 as starts of the phase separation. The decrease of the optical transmittace in the heating up period (heating rate 10 °C/min) followed by an increase to the local maxima are being unexplained yet.
Optical microscopy was also used to study the structure of the glasses. Optical microscopical studies of the NBS glass samples after 50h phase separation at 700°C, immersed in ethanol
iodine solution (Figure 5 a, b) and in water methylorange solution (Figure 5 c, d) exhibit significant differences in their structure.
The temperature of phase separation, the leaching and nucleator additive (TiO2), significantly
influence the microstructure of the resulting leached product. TiO2 additive seems to suppress
crystallization of cristobalite: especially at the extended above heat treatment phase separation runs (Figures 6- 9). The results of leaching is formation of a continuous porous network, as is visible on the SEM figures (Figure 7). The phase separated domains of glasses containing above 80 mol % of SiO2 are so small that can be hardly observed by electron microscope [11].
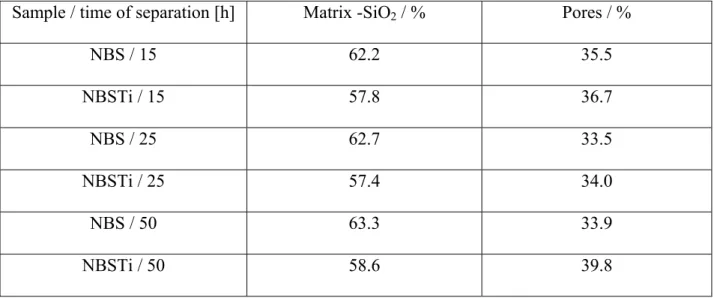
The glass composition in all cases was selected to have relatively large phase separated areas easily observed by SEM at magnification approximately 20,000x. The image analysis of leached glasses shows the prevailing content of the skeletal phase in a comparison to pores (Table 2). The TiO2 content diminishes slightly the content of the skeletal phase.
The results of mathematic evaluation of the presence of SiO2 and pores in etched glasses, gained
from SEM scans show the apparent influence of the length of separation and TiO2 addition on
three-dimensional set-up of silicate matrix. According to the references, the presence of TiO2
suppresses the superficial crystallization of cristobalit caused by volatility of Na2O a B2O3 from
References
1. L. Šašek, Speciální technologie skla, SNTL – Nakladatelství technické literatury, Praha 1985, p.107
2. J. Voldán, Odmísení skel, Státní výzkumní ústav sklářsky v Hradci Králové, Informativní přehled, 1974, 1, 11.
3. K. Nakashima, K. Noda and K. Mori, J. Am. Ceram. Soc., 80 (1997) 1102. 4. H. Wang, and G. R. Gavalas, J. Membrane Sci., 176 (2000) 75.
5. C. Moisescu, C. Jana, S. Habelitz, G. Carl and C. Rüssel, J. Non-Cryst. Solids, 248 (1999) 176.
6. Y. Yue, C. Moisescu, G. Carl and C. Rüssel, Phys. Chem. Glasses, 40 (1999) 243. 7. I. Fanderlik, Vlastnosti skel, Informatorium, Praha 1996, p. 285
8. J. Majling, V. Kremničan, L. Pach and J. Chocholoušek, High Temperatures-High Pressures, 33 (2001) 43.
9. L. Pach, Ľ. Bača and J. Majling, Chem. Papers, 54 (2000) 265.
10. J. Majling, P. Šimon and V. Khunova, J. Thermal Anal. Cal.., 67 (2002) 201. 11. M. B. Volf, Technická skla a jejich vlastnosti, SNTL, Praha 1987, p. 214 .
Table 1 Composition in mol % of glass samples A and B. Oxides A B Na2O 9.19 9.29 B2O3 23.58 23.82 SiO2 67.23 63.72 TiO2 0.00 3.17
Table 2 Mathematic evaluation of SiO2 phase and pores in samples of the etched glasses.
Sample / time of separation [h] Matrix -SiO2 / % Pores / %
NBS / 15 62.2 35.5 NBSTi / 15 57.8 36.7 NBS / 25 62.7 33.5 NBSTi / 25 57.4 34.0 NBS / 50 63.3 33.9 NBSTi / 50 58.6 39.8
0 5 10 15 20 25 30 0 400 800 1200 1600 2000 O p ti c a l tra n sp a re n cy 1 2 3 Time, h
Fig. 4 In situ changes in the optical transmittance thermal curves of samples, treated
a b
c d
Fig. 5 Optical microscopy of the NBS glass samples after 50h phase separation at 700°C,
immersed in ethanol iodine solution: a) 50x and b) 200x (samples A and B, respectively and in water methylorange solution: c) and d) 100x (Samples A and B, respectively)
a)
b)
c) d)
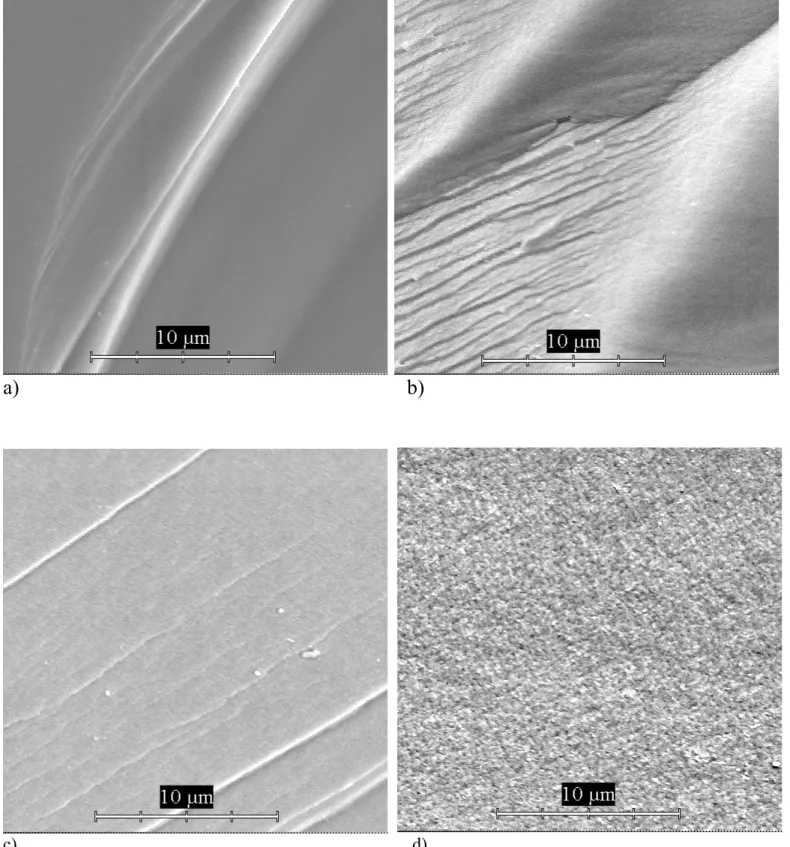
Fig. 6 The microstructure of the glass samples without (a, b) and with (c, d) TiO2 after phase
a) b)
c) d)
Fig. 7 Comparison of microstructures of the NBS glasses after the phase separation at 700°C:
a)
b)
c)
d)
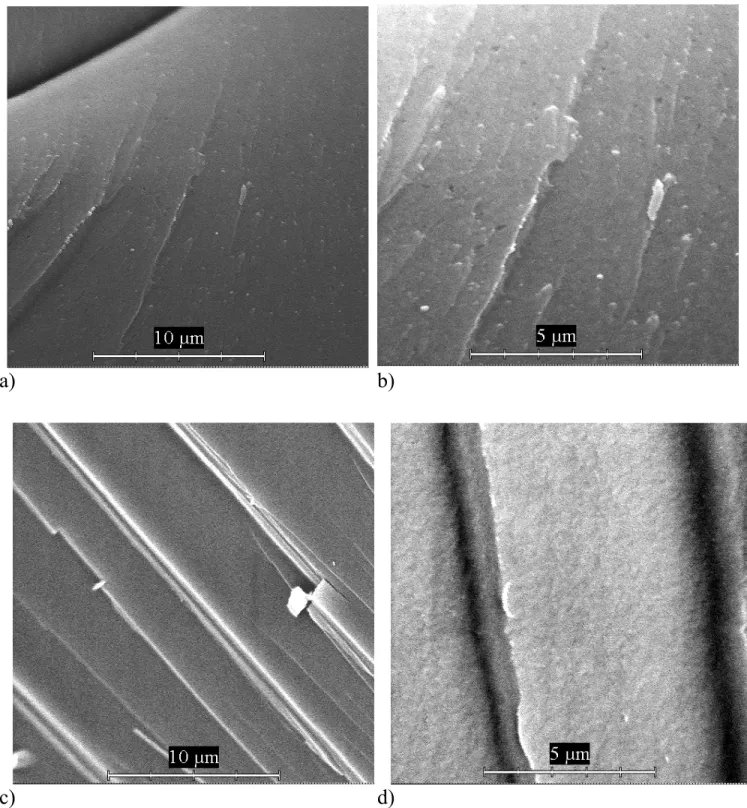
Fig. 8 The microstructure of NBS glass samples without (a, b) and with (c, d) TiO2 after phase
a) b)
Fig. 9 The microstructure of the surface of the glass samples after the phase separation at 700°C:
Caption to the figure
Fig. 1 Phase diagram of the system Na2O-B2O3-SiO2 [1]
Fig. 2 The nature of the phase separated areas in relationship to mechanism of phase separation
[2]
Fig. 3 TTT diagram (time – temperature – transformation) for the composition A
Fig. 4 In situ changes in the optical transmittance thermal curves of samples, treated
isothermally 700 (1), 720 (2) and 740 (3)°C.
Fig. 5 Optical microscopy of the NBS glass samples after 50h phase separation at 700°C,
immersed in ethanol iodine solution: a) 50x and b) 200x (samples A and B, respectively and in water methylorange solution: c) and d) 100x (Samples A and B, respectively)
Fig. 6 The microstructure of the glass samples without (a, b) and with (c, d) TiO2 after phase
separation at 700°C: a) 2h, b) 15h, (without etching)
Fig. 7 Comparison of microstructures of the NBS glasses after the phase separation at 700°C:
a) 25h, c) 50h without TiO2; b) 25h , d) 50h with TiO2. All samples were etched with 2% HF
Fig. 8 The microstructure of NBS glass samples without (a, b) and with (c, d) TiO2 after phase
separation at 700°C/50h. (inner structure)
Fig. 9 The microstructure of the surface of the glass samples after the phase separation at 700°C: