DEWEV
HB31
.M415Massachusetts
Institute
of
Technology
Department
of
Economics
Working
Paper
Series
The
Causes
and
Consequences
of
Attending
Historically
Black
Colleges
and
Universities
Roland
G.
Fryer,
Jr.Michael
Greenstone
Working
Paper
07-1
2
April
9,2007
Room
E52-251
50
Memorial
Drive
Cambridge,
MA
021
42
This
paper
can be
downloaded
withoutcharge
from
the SocialScience Research
Network
Paper
CollectionatThe
Causes
and Consequences
ofAttending
HistoricallyBlack
Collegesand
Universities*Roland
G.Fryer,Jr.Harvard University and
NBER
Michael GreenstoneMIT
and
NBER
April
2007
We
aregratefultoDavid Card,David Cutler,Bryan Graham, Chang-TaiHsieh, LawrenceKatz,HenryLouis Gates,Jr.,EdwardGlaeser,Lani Gunier, CarolineHoxby, GlennLoury, Enrico Moretti,AndreiShleifer,LawrenceSummers,colleaguesattheMellonFoundation,andparticipants innumerousseminars.Fryerisespeciallythankful
totheMichorfamilyinKritzendorf,Austriafortheirsupportandgeneroushospitalitywhileworking onthe paper.
This papermakesuseoftheCollegeandBeyond(C&B)database.The
C&B
databaseisarestricted-usedatabase. Researcherswhoareinterested inusingthedatabasemay
applytotheAndrewW.
Mellonfoundationforaccess.Sam
Schulhofer-Wohl, Sheldon Bond,JorgSpenkuch,ElizabethGreenwood, andPaulTorelliprovided exceptionalresearch assistance. All errors are ourown. Correspondence can be addressed to Fryerat the Department of
Economics, HarvardUniversity, 1805CambridgeStreet,Cambridge
MA,
02138,(e-mail:rfryer@fas.harvard.edu);orGreenstoneatDepartment of Economics,MassachusettsInstituteofTechnology, 50MemorialDrive,E52-359,
Digitized
by
the
Internet
Archive
in
2011
with
funding
from
Boston
Library
Consortium
IVIember
Libraries
The
Causes and Consequences
ofAttending
HistoricallyBlack
Collegesand
UniversitiesABSTRACT
Until the 1960s, HistoricallyBlack Colleges
and
Universities(HBCUs)
were
practicallytheonlyinstitutions of higherlearning
open
to Blacks intheUS.
Using
nationally representativedatafiles
irom
1970sand
1990scollege attendees,we
findthat inthe 1970sHBCU
matriculationwas
associatedwith higher
wages
and anincreased probabilityofgraduation,relative to attending aTraditionally
White
Institution(TWI).By
the 1990s,however,thereisawage
penalty, resultingina
20%
declinein therelativewages
ofHBCU
graduatesbetween
thetwo
decades.We
alsoanalyze the College
and
Beyond's 1976and
1989 samples ofmatriculateswhich
allowsus tofocus
on two
ofthemost
eliteHBCUs.
Between
the 1970sand
1990s,HBCU
students reportstatistically significant declines in the proportion that
would
choose thesame
college again,preparation for getting along with other racial groups, and
development
ofleadership skills,relativetoblackstudentsin
TWIs.
On
the positiveside,HBCU
attendeesbecame
relativelymore
likely to be
engaged
insocial, political, andphilanthropic activities.The
data providemodest
support for the possibility thatHBCUs'
relative decline inwages
is partially due toimprovements
inTWIs'
effectivenessateducatingblacks.The
data contradictanumber
ofotherintuitive explanations,includingrelativedeclineinpre-coUegecredentials(e.g.,
SAT
scores) ofstudentsattending
HBCUs
and
expenditures perstudentatHBCUs.
Roland
G.Fryer,Jr. . Michael GreenstoneHaiward
University ' 'MIT
Department
ofEconomics
Department
ofEconomics
1805
Cambridge
Street 50Memorial
Drive,E52-359
Cambridge,
MA
02138
Cambridge,MA
02142
andNBER
^^ -andNBER
Introduction
Historically Black Colleges and Universities
(HBCUs)
have a proud and storied role in theeducation and progress ofBlacks in America. For nearly a century, Historically Black Collegesand
Universities
(HBCUs)
werepractically theonlyinstitutionsof higherlearningopentoBlacksintheUS.Today, roughly
20%
ofallcollege goingBlackschooses toattend one ofthe 103HBCUs
and theseinstitutions are responsible for
22%
ofcuirentbachelor's degrees granted to Blacks. W.E.B. Dubois(Wilberforce), Ralph Ellison (Tuskegee), Martin Luther King, Jr. (Morehouse), Thurgood Marshall
(Lincoln),Ruth
Simmons
(Dillard),andOprah Winfrey(Tennessee State)headlinealonglistoffamousHBCU
alumni.Among
Blacks, 40%) ofallcongressmen, 12.5%) ofCEOs, 50%) of professorsatnon-HBCUs,
50%
of lawyers,and80%
of judgesareHBCU
graduates.'HBCUs'
successes arein nosmallpartdue to theirsubstantial financialsupportfrom federal,state,andtoa lesserdegree, localgovernments. Between 1977and2001,61%)to73%o of public
HBCUs
revenues
came
frompublic fiinds. Whilenumbers aresmallerforprivateHBCUs,
public supportstillaccounts for nearlya third oftotal revenues. In theyears 1999-2001, annualtotal public support of
HBCUs
averaged roughly $2.65billion(2005$) (Provasniketal.2004).Despitetheirpastsuccessesandhistoricalimportance,
HBCUs
areatacrossroadstoday. In U.S.V. Fordice("505U.S. 717 (1992)), the SupremeCourtinstructed state legislatures to find"educational
justification" for the existence of
HBCUs
or integrate them; the latterwould completely alter theirmission. Inresponse,
some
HBCUs
experienced declinesin enrollment,others havepursued dramaticincreasesinthe fractionofnon-Blackstudents,anda
number
ofHBCUs
haveseenimportantdeclinesintheirfinancial positions.^
The
Supreme Court'scall foran "educationaljustification"issurely related to theabsence ofconvincing evidence on the causes and consequences of attending an
HBCU
for Blacks.HBCU
proponents claim that they provide an idyllic learningenvironment that is free from thepressures of
discriminationandracism. It isalsoarguedthat
HBCUs
helptobuildimportantsocial capital forBlacksby engendering a strong sense of
communal
responsibility and civic consciousness and providingnetworkingopportunities forhigh achievingBlacks(Drewry and
Doennarm
2001). Iftheseargumentsare correct, then
HBCUs
offerunique opportunities foreducafional and social development ofBlackstudentsandtheargumentforremaining segregatedseemsjustified.
Thedata sourcesareCongressionalBlackCaucus(congressmen), BlackEnterprise(CEOs),
US
Departmentof Education, OfficeofCivilRights(professors),and Ehrenberg(1996)(Lawyers andJudges).Therulinghadan adverseeffectonmanyHBCUs.AlcornStateexperienced a9.9%decreaseinenrollmentand
Mississippi ValleyState a20.1% decrease.OtherHBCUs,especiallyinNorthCarolina,haveshown substantial
increasesinintegration.ElizabethCityStateincreasedfrom1
1%
whitein1980to23.7%
in1998,Fayetteville Statefrom 11.9to22.2,NorthCarolina Centralfrom4.1to 13.4,andWinstonSalem from 11.3to18.0. Inotherstates,
On
the other hand, it is possible thatHBCUs
are inferior to Traditionally White Institutions(TWIs)inpreparing Blacksforpost-collegelife. Ifstudents aretakinglesschallenging coursesfi-omless
distinguishedfaculty,haveaccesstopoorresources,or arenotinvestinginthe socialskillsnecessaryto
interactwith diverse sets of people, then graduates willperform poorly inthe labormarket and have
inferior non-labor market outcomes. In this scenario, the case for supporting
HBCUs
with publicresourcesappears weak.
This paper empiricallyassesses the causes and consequences of
HBCU
attendance so that thefuture decisionsby governments, students,and parents arebased on evidence, ratherthantheoriesand
historicalanecdotes.
We
analyzethi^eelargedatasetswith adequatepreandpostcollegeinfonnationforBlacksthat identify thestudents'choice ofcollege and whetheritisan
HBCU.
Thedata setsare: theNational Longitudinal Sui^veyofthe HighSchool Class of1972 (NLS-72), Baccalaureate and
Beyond
(B&B), and theCollege and
Beyond
database (C&B).The first two datasetsprovide a snapshot ofa nationally representative sample ofHBCU
studentsat two points in time: 1972 and 1992. The third datasetcontainsfourHBCUs,
Howard, Morehouse, Spelman, andXavier,allowing ustotake afocused lookintothemosteliteHBCUs
in 1976and 1989.Althoughthere areimportantlimitationswith each ofthese datasets,togethertheyprovidea rich portraitofthecausesandlabormarketandnon-labormarket
consequencesof
HBCU
attendance. Importantly,thesedata setssamplecollegematriculatesinthe 1970sand 1990s so it is possible to assess
how
these causes and consequences changed during these twodecadesof dramaticsocialchange.
The analysis uses four separate statistical approaches to adjust for pre-college differences
between
HBCU
andTWI
attendees.We
beginbyusingthe richsetofcovariatesonfamilybackgroimdandhigh schoolacademic achievement(including
SAT
scores) tofitleastsquares models.We
then usethe same pre-college covariates to implement a propensity-score matching estimator to assess the
robustnessofthe results to functional formassumptions aboutthe observables. These approaches are
supplemented by methods that are designed to account for selection bias due to missing outcome
observations
(Heckman
1979) and bias which emergeswhen
colleges admit students based partly oncharacteristics unobsei"ved in our data that are positively correlated with future outcomes (Dale and
Ki-ueger 2002).
Theresults arerobust acrossthesefourmethods. However,lackingarandomizedexperimentor
credible quasi-experiment, thorny issues ofselection
may
remain. Consequently,we
urge caution ininterpreting the results as causal.
Togetherthenationallyrepresentative
NLS
andB&B
revealan importantchangeinthe returnstoHBCU
attendance. In the 1970s,HBCU
matriculationwasassociatedwith higherwagesand an increasedpenalty. Overall, thereis a
20%
declineinthe relativewagesofHBCU
graduatesinjusttwodecades.Interestingly, relativepre-collegemeasures ofstudent quality
(SAT
scores,e.g.)improvedamong
HBCU
attendeesduringthisperiod,so higher achievingstudentswereincreasinglychoosingtheseschoolsatthesametimethatthe returns forattendingtheseschoolswerefallingbehind.
Theunderlying sourceofthedeclinein
HBCU
perfoiTnanceisunlikely tobeimportantforpolicyreasons,giventhehighcourt's stance. Nevertheless,understandingitwouldbe of considerableinterestto
researchersand educationalpractitioners. Thedata fail tocontradict, and in atleast one specification
support, the possibility that
HBCUs'
relative decline is partially due to improvements in TWIs'effectivenessateducatingblacks. In contrast,thedatacontradict a
number
ofintuitiveexplanationsfor the decline in outcomesamong
HBCU
attendees—
for example, educational expenditures per studentincreasedmoreat
HBCUs
thanatTWIs
betweenthe 1970sand 1990s.The
C&B
provides a rare opportunity to assess the most elite colleges. Here too, there isevidence of a
wage
decline between the 1976 and 1989 cohorts but it should only be consideredsuggestive because these estimates are imprecise. There is stronger evidence that the later
HBCU
matriculateswerelesssatisfiedwiththeirchoice ofcollegeandself-reporteddevelopingfewerleadership
andsocialskillsthatarevaluableinpost-collegelife,relativeto
TWI
students.On
theotherhand,thelatercohortwassignificantlymoreHkelytobeinvolvedin political,social,andphilanthropicactivities.
Thepaper proceedsasfollows. SectionIIprovides abrief historyof
HBCUS
andtheirimportantrole intheeducation of blacksinAmerica. Section IIIreviews sometheoretical explanationsfor
why
blacksmightbenefit (orbe haniied)byattending ahistoricallyblackcollege or university. SectionIV
presentsthedataand
summary
statistics.SectionsV
andVI
report resultsonthecausesandconsequencesof
HBCU
attendance. Section VIIsummarizesthe differencesbetweenthe resultsfromthe 1970sand1990sandassesses alternativeexplanationsforthese differences. Lastly,Section VIII concludes.
A
dataappendix describesthe detailsof oursampleconstmction.
:
.•II.
A
BriefHistory of HistoricallyBlackCollegesandUniversitiesA.Ante-BellumPeriod
The1860Censuscounted4.4millionBlackpeopleintheUnitedStates,mostof
whom
lived intheSouthernstatesand wereheldas slaves.Prior to theend ofthe CivilWar,teachingslavestoread or
writewasprohibitedby law(or socialcustom)in
many
areasofthe South.Still, therewerethreeBlackcolleges founded before the Civil War: the Institute for Colored Youth (now
known
as CheneyUniversity) was founded in Pennsylvania in 1837; Lincoln College in Pennsylvania, 1854, and
Wilberforce College in Ohio, 1856. All of these universities served secondary and post-secondai'y
the Freedmen'sBureau, black communities and their churches, and private philanthropists organized
schoolsforBlacks(Donohue,Heckman, and
Todd
2002).B.Post-Civil
War and
theSecondMorrillLand
GrantDuring theperiod immediately following the CivilWar, there was adramatic increase in the
number of educational institutions geared toward blacks, funded primarily through groups like the
AmericanMissionary Association, theFreedmen's Bureaus,and southernstate governments,especially
duringthe Reconstructionperiod. Between 1865 and 1890, overtwo hundredprivateblackinstitutions
were founded in the south. Very few ofthese early institutions awarded bachelor's degrees. The AmericanMissionary Association,theFreedmen'sBureaus,andothergroupsthatwereactiveintheearly
educationoffreedblacksplayed alarge roleinestablishingsome standardof education
—
mostnotablyliteracy
—
thatwouldbe importantwhen
degree grantinginstitutionsforBlacksopenedenmasseinthe1890s.
Mostpublic
HBCUs
trace theirhistorytothesecondMoixill Act,passedinAugust 1890.Inthenext decade,16
HBCUs
openedtheirdoors.TheMorrillActallowedfor the creationofa two-tiersystemof landgrant universities, with southernandborderstatescreating
HBCUs
principally togain accesstofederal"funds to develop white land grant colleges. These
HBCUs
were largely limited to vocationaltraining;well-knownagricultural,mechanical,andtechnical institutionssuchasNorthCarolina
A&T
andFlorida
A&M
were foundedduringthisperiod.By
1895, publicHBCUs
hadawarded 1,100 college diplomastoblackstudents.Yet, liberalartseducation, as was offered at
many
public white institutions, remainedunavailable toblack students.DuringtheJim
Crow
erainthesouththatfollowedReconstmction, educationalopportunities forwhitestudentsexpanded andblackswerealmost completelyexcludedfromwhiteinstitutions.
Inthe 1896 decision,Plessy v. Ferguson (163 U.S. 537(1896)), the two-tier system of higher
education, basedon the incentive structure in the Second MorrillAct,
became
more finnly set.As
aresult,
HBCUs
begantobecome
institutions thatprimarily trainedteacherstoteachinsegregated publicschools. The rapid expansion of black high schools in southern urban areas set in motion a
supply-demand
chaininwhichavailabilityof teachingpositions,supportedbystatetreasuries,drewmoreblackstudents into
HBCUs
to qualify themselves for teaching positions (Roebuck andMurty 1993). Therebecamean interdependencebetweenthepublicschoolsystemand
HBCUs.
C. World
War
IIand
theHigherEducation Actof 1965HBCUs,
aswellasother institutionsof higherlearning,facedafundingcrisisinthe1940sduetowasestablished, raising$765,000 for
HBCUs
inits firstfixndingcampaign;threetimesasmuch
ashad beenraisedbythe individualcollegesinthepreviousthree years.The landmarkdecisionin
Brown
v.Board
ofEducation (349 U.S.294(1955))andthe legislationdevelopedtoimplementitimprovedthe plightof
many
HBCUs.
TitleIIIoftheHigherEducationActof1965, which was devoted to "Strengthening Developing Institutions" was interpreted as primarily
refen-ingto
HBCUs. As
aresultmany
HBCUs
benefitedgreatlyfromthefederalfundsprovidedunderTitleIII, funds that couldbe used for faculty and studentexchanges, faculty improvement programs,
cumculum
improvements, studentservices, visiting scholarsprograms, and administrative improvements.Despitethematerialgains to the
HBCUs
arisingundertheHigherEducation Act,theNAACP
continueda legal strategy ofattacking the two-tiereducationalsystem, asking the U.S. Department of
Health,Education,andWelfaretoenforcethe CivilRightsActof1964 andprohibitsouthernstatesfrom
operatingasegregatedhighereducation system.In the1973 case of
Adams
v.Richardson (356F.Supp.92(D.D.C.),modifiedandaffd,480F.2d1159 (D.C.Cir.1973)), the
NAACP
won,requiring that statesdevelop desegregationstrategies thatwouldallowforabetter racialmixofstudents, faculty,andstaffin
publiccolleges,andincrease theaccessandretentionofminoritiesat alllevelsof highereducation.The
ruling
was
primarilyaimedatnon-HBCUs,
however,andthecourtmade
itclear thatfulfillingthe ruling'smandateshould notbeaccomplishedattheexpense ofordetrimenttotraditionallyblackcolleges
The
Adams
decisionincreasedfunding forHBCUs
becausethedecisionstated that statescould notmeettheirmandates byclosingHBCUs
andthattheymustinsteadinclude "yardsticks"tomeasuretheimprovementof blackcolleges' facilitiesaswellas theiracademicprograms.
The
court'sreasoningwasthatthiswastheonly
way
possible toensurethatHBCUs
wouldbecome
desirable institutions forwhitestudents.
D.The UnintendedConsequences ofU.S.v.Fordice - . •. ,;•::;.'':;-^ , r
:.:,y.
.%'/
^^On
June 26, 1992, theSupreme Court decided U.S. v. Fordice, adecisionbroughtby ablacklitigant withthechiefaim ofremoving structural differencesbetween
HBCUs
andtraditionally whiteinstitutions.Theplaintiff, representedby the
NAACP,
brought thesuitbecause ofthe disparity inthenumber
and qualityofthe academicprograms, instmctionalstaff,andphysical plant facihties, arguingthatthisresultedfromthe "historicallyoperatedraciallysegregated dualsystemsof higher education."
Thecourt ruled thatitwouldbe wastefultomaintainthe two-tiersystemthathad beenerectedduring an
eraof de juresegregation,notingthatMississippihadeight institutions, fivewhiteandthreeblack,and
thatfour ofthem(two whiteand twoblack)werewithin 25 milesof oneanother. Thedecisionwasa
victoiy forcivilrightslawyers,ordering Mississippi and 18 othersouthernstatestodomoreto integrate
However,themling hadan adverseeffecton
HBCUs
becausethecourtorderedstate legislaturestofind"educationaljustification for thecontinued existence"ofthetwoparalleleducation systems. The
consequencesofthismlingforthe futureof
HBCUs
isunclearat thispoint,butatleastthreeoutcomesseempossible: 1)adecisionthat
HBCUs
areindispensablefor theeducation of Blacksandanincreaseinpublic funding; 2)increased recruitmentand matriculationof whitestudents,whichhasthe potentialto
underminetheunique missionandcultureoftheseinstitutions;and3) adecisionthattheynolongerare
necessary(or asnecessary)andacommensuratereductioninpublicfinancial support.
The remainder ofthe paper assesses empirically the causes and consequences of attending
HBCUs,
whichwillhelpdeterminetheir"educationaljustification."III.Conceptual
Framework
There are at least three theories for
why
blacks would benefit from racial segregation ofinstitutions of higher education. First,
Tatum
(1997) argues that racial grouping is adevelopmentalprocessinresponsetoracism. Thisargumentgoesthatsegregationbyraceisa positivecopingstrategy
thatallowsindividuals to gathersupportthrough shared experiencesandmutual understanding. Second,
Wilson's (1987) pioneering study ofthe South Side ofChicago argues thatthemigration oftalented
blacks from black neighborhoods had adverse effects on the individuals left behind.
A
similarphenomenon
may
existforsegregation acrossschools- lowabilityblacksmay
benefitfromsegregationthroughmoreintensive interactions with theirhighabilitypeers. Third, segregatedsocial connections
within schools
may
alsoreduce adverse peerinteractions resultingfrominterracial contact.FryerwithTorelli(2006)showsthat racialdifferencesinthe socialprice foracademicachievementareexacerbated
inenvironments withmoreinteixacialcontact.
Thereare also several theories for
why
racialsegregation acrosscolleges anduniversitiesmay
harm
blacks.A
well developed literature emphasizes theimportance of peer groups (Coleman 1966), social interactions (Case and Katz 1991, Cutler and Glaeser 1997), and network externalities (Borjas1995, Lazear1999), especially foryouths.
Many
arguethat these effects areimportantinthefonnation ofskilland valuesandthedevelopmentof
human
andsocialcapital.Moreover,segi-egationacrossschoolsmay
lead to the development of an "oppositional culture" and the enforcement of other negativebehavioralnonns(Ogbu 1989). Additionally,segregationacrossschoolscan preventpositive spillovers
betweenraciallydefinedpeer groups (Lazear1999).
A
final disadvantage of the separation of racial groups across universities concerns theimportance ofinterracial contactinmediatingstereotypes andpromotingunderstanding andtolerance.
Interracialinteraction generally leads to positive sentiment
(Hpmans
1950),andfostersthecreationofItisimpossibletoidentifytheseparateimpact of each ofthese chamielsonsegregated Blacks'
wellbeing with theavailabledatasets. Instead,thispaper's goalistoproducereliableestimatesofthe
netimpactof
HBCU
attendance. Theresulting"reducedforni"estimates will likelyreflectanumber
ofthechannelsspecified inthissection.
IV.Data Sourcesand
Summary
StatisticsWe
analyzethree large datasets:The
NationalLongitudinalStudy oftheHighSchool Class of1972 (NLS-72), Baccalaureate and
Beyond
Longitudinal Study (B&B), and the College andBeyond
(C&B)
database. Thesedata setshavebeenchosen because oftheenormousamountof information eachcontainsonpre-collegeacademicperformance, familybackground,college entry decisions,perfoiTnance
whilein college,andlater lifeoutcomes.^Throughoutthe analysis, the rich setof pre-collegeandfamily
backgroundvariables are used as conditioning variables to adjust for obsei^vable differences between
HBCU
andnon-HBCU
matriculatesinequationsfor theother variables.We
discusseach ofthesesourcesandpresent
summary
statisticsfromthem.Before proceedingto thismaterial.AppendixTable 1providessome
summary
statisticsonthe894-year historicallyblackcollegesand universities intheUnited States. Foity-nine ofthemareprivate
institutions. Theyarepredominantly locatedintheSouth. Togethertheirundergraduate enrollmentinthe
Fallof2005
was
238,911 andtherewereanadditional37,151 graduatestudents enrolled. Thefourteenhistoricallyblack 2-yearcolleges arenotincludedinthistable.
A.TheNational LongitudinalSurveyoftheHigh SchoolClassof 1972
TheNational Longitudinal Surveyofthe HighSchool Class of 1972(NLS-72) is anationally
representativesampleof 23,451 high schoolseniors in1972. Participants in thesamplewereselectedin
theSpring of 1972,andinasupplemental^sampledrawnin 1973. Thedataincludeabase yearsurvey,
andfollow-up surveysin 1973,1974, 1976, 1979, and 1986.Roughly 1,300 high schoolsareincludedin
thesample,with an average of18studentsperschoolinthe study.
A
widerange ofdataisgatheredonthestudentsinthe study, asdescribedindetailattheNLS-72
website (http://nces.ed.gov/surveys/nls72). There is detailed information on each student's family
environment, parent's education and occupation, socio-economic status, and the pre-college
characteristicsof eachstudent(i.e. high schoolgrades,collegeadmissionscores,andsoon). Thereare also detailed records from post-secondary transcripts, collected in 1984, and high school records.
Two
other data sets collected by the National Center for Education Statistics, the National Educational LongitudinalStudy2000(NELS)andtheBeginningPostsecondaryStudy(BPS),areequippedtoanswersomeofthequestionsposedhere.Unfortunately,however,these datasetsdonot track individualslongenoughaftercollege
Importantforour purposes,a six digit identificationnumber was assignedtoeducationalinstitutionsby
the Federal Interagency Committee on Education (FICE) to, historically, distinguish postsecondary
schoolsthat qualifiedas institutionsof higherlearningfromthose thatdidnot.Thesecodesare cracialin
defining
HBCUs
andensuringthatthisdefinitionisconsistent acrossdatasets.B.Baccalaureate
and Beyond
TheBaccalaureateand
Beyond
LongitudinalStudy(B&B)
isanationally representativesampleof 11,192 degree completersfrom 648 American colleges anduniversities in the 1992-1993 academic
year.
To
identifyarandom sampleof degree completers,B&B
usestheNationalPostsecondary StudentAidStudyas a basis.TheNationalPostsecondary StudentAidStudy isa largenationallyrepresentative
sampleofcollegesanduniversities, students,andparents.
A
considerableamountofdataisgatheredonthestudentsinthestudy, asdescribedindetail atthe
B&B
website http://nces.ed.gov/sui"veys/b&b. It contains detailed information on pre-coUegecharacteristicsof eachstudent, informationabouttheirparents and
home
environment,andfinancialaidinfonnation.Follow-up sui"veyswere administeredin 1994, 1997,and 2003. Thesefollow-up surveys
include informationonemployment andentry intograduate school.
We
focusontheresponsestothe1997sui-vey,whichtakesplaceaftermoststudents areintheworkplace.
We
hadhopedtousethe2003datamore extensively,but
we
foundittobe of generallypoorqualityonthedimensionswe
caredmostabout. For example,
25%
ofthe originalblack respondentsattritedfromthe2003sample,comparedtojust
6%
inthe1997 sample.And,thisattritionwaslargelyfromblack studentsinTWIs.Thereisoneimportantdifferencebetweenthe
B&B
andtheotherdata setswe
employ.TheNLS
and
C&B
begin withsamples ofstudents thatenrolled theirfreshmanyear. TheB&B
samples degreecompleters, which can introduce bias if graduation rates between
HBCUs
andnon-HBCUs
differsubstantially.
Whenever
the results fromthissurvey differwithour other data,we
willbeclearaboutwhetherthisdifferencecanbe accountedforbydifferences insamples.
A
convenientway
tohandlethisisto restrictthesampleinourother datasetstobe of degree completers,which
we
do throughout.C.TheCollege
and Beyond
DatabaseTheCollege and
Beyond
Database contains studentlevel administrative dataonon93,660full-timestudents
who
entered(butdid not necessarilygraduatefrom)thirty-fourcollegesanduniversitiesinthefallof 1951, 1976,and1989.Theseinstitutionalrecordswerelinkedtoan extensive survey conducted
by the
Andrew W.
Mellon Foundation between 1995 and 1997 and to files providedby the CollegeEntranceExaminationBoard andtheHigherEducation ResearchInstitute.Therearefour
HBCUs
inthedataonallfourblackcolleges; the 1989cohortonly includesMorehouseandXavier.''Thefinaldata set consistsof blackstudentsfrom 34collegesanduniversitiesincludingthefourelite
HBCUs;
thesampleconsistsof 2,125studentsin 1976and1,785in1989.
The
C&B
data areremarkablyrich,containinginfoiTnationdrawn fromstudents'applicationsandtranscripts, Scholastic Aptitude Test (SAT) and American College Test
(ACT)
scores, as well asinfonnationonfamilydemographic andsocioeconomicstatus.This informationwasattainedbylinking
the institutional files ofthe thii1y-four colleges and universities with data provided by the College
EntranceExamination Board andtheHigher Education ResearchInstitute. Importantly,the
C&B
surveyincludestheresponsestoa questionnaireadministeredtoallthreecohortsin 1996thatprovidesdetailed
informationonpost-collegelabormarket,lifesatisfaction,andotheroutcomes. Theresponseratetothe
1996 questionnairewas approximately 80%. The College and
Beyond
Survey is described in greaterdetailin
Bowen
andBok
(1998).D.
Summaiy
StatisticsSummary
statisticsforthe variables inour corespecification aredisplayedinTable 1 forblackstudentsinthe three datasetsdescribed above,accordingtowhetheror nottheyattend a
HBCU
orTWI.
Students
who
aremissing dataonrace orwhichcollegethey attendedaredroppedfromthesample.Table1consistsoffive setsof columns.Thefirstcolumnprovides
summary
statisticsforstudentsinthe
NLS-72
whosefirstcollegewasanHBCU
versusTWI,
wherefirstcollegeisdefinedasthefirst4-year college a studentattends.
An
individualwho
attends ajuniorcollege,technical school, or thelikeandthen attends an
HBCU
willbe counted ashaving his firstcollege as anHBCU.
The second columnrestrictsthesampletothose
who
completedabachelor'sdegree,allowingonetomake
directcomparisons withB&B
whosedescriptivestatisticsaredisplayedincolumn3.Columns
4 and5providemeansofthe variables forstudentsintheC&B
databaseforthe1976and1989cohorts, respectively.^Across all our datasets, blacks attending
TWIs
tend to have substantially higher academiccredentials. In theNLS-72,
SAT
andACT
scores of BlacksinTWIs
are roughly 1 standard deviationhigher. Yet,Blacks attending
HBCUs
haveslightlyhigherGPAs
thantheirpeerswho
attendTWIs
(2.86compared to 2.83), suggesting that these students attend less academically challenging high schools.
Students in
HBCUs
are morelikely to attend private high schools. Similartrends are apparent intheB&B,
thoughthedifferencesinacademiccredentials betweenHBCU
studentsandnon-HBCU
students are lesspronounced.A
portionofthedifferencebetweentheNLS-72
andB&B
can be explainedbytheAllforthcomingresultshavebeenrunbyrestrictingthe1976cohorttoMorehouse and Xaviertoensurethatany
differenceswhich emergecannot be explainedbydifferentsamplesinthetwocohorts.
differentsamplerestrictions.
Inthe 1976 and 1989 cohorts of
C&B,
theGPAs
ofBlackstudents inHBCUs
are .73 and.5standarddeviationsless,respectively.
SAT
andACT
scoresofHBCU
students aremorethan1 standarddeviationbehind Blackstudentsin
non-HBCUs.
In these data, studentswho
attendHBCUs
are less likelytohaveattendedaprivatehighschool.
The"Pre-College Personal and Family Background" variablesprovide measures forthe
home
environmentsthat students werereared in. These variables include family income (measuredin 1972
dollars), parental education, orwhether or nota student attendedhigh school in a rural area or the
southern portion ofthe US. The definitionofincome differs slightly between data sets. In NLS-72,
studentswereasked,
"What
istheapproximateincomebeforetaxesofyour parents(orguardian)? Includetaxableand non-taxableincome fromallsources."For
B&B,
we
used familyincomein1991 forstudentsthatweredependents oftheirparentsandthestudent's
own
taxedanduntaxed incomeforstudents thatwerenotdependents.^For
C&B,
familyincomeisderivedfromtheHERI
studentsui"vey.TheCPI-U
wasusedtoconvertallincome measuresto1982-84dollars.
Itisapparentthatthere areimportant observabledifferencesbetweenblacks
who
attendHBCUs
and TWIs.Thesubsequentanalysisusesa varietyofstatisticalapproachesto adjust forthese differences.
Thethirdpanelreportson
many
ofthe outcomevariables.These includewages,majorchoice,whether or not a student received their bachelor's degree, attended graduate school, orobtained a
graduatedegree, andvariablesdesignedtomeasurecollegeexperiencesandjobandlifesatisfaction.In
therawdata,blacks
who
attendHBCUs
tendtomake
lessmoney
than blackswho
attendTWIs,withoneexception;NLS-72.^Theyare also less likely tobeemployedfull-timeandmorelikely tobedissatisfied
withlife.
HBCU
students aremorelikelytomajorinphysicalsciences.Inthetwonationallyrepresentativesamples,blackstudentsat
HBCUs
aremorelikelytoreceiveabachelor'sdegreeandattendgraduate school (though theyarelesslikely tograduate).Blackstudentsin
theelite
HBCUs
aremorelikely tomajorinbiologicalsciences(thisisdriveninlarge partbyXavierwho
hasa storied reputation forpre-medical studies),business, lesslikely toreceiveabachelor'sdegree or
attendgraduateschool,and,inthe1989cohort,less likelytoreport that theircollegeexperience helped
Forstudents
who
weretheirparents'dependentsin 1991,totalfamilytaxedand untaxedincomewasobtained,inorderofpriority,fromthestudent'sfinancial aidapplication, atelephone interviewofparents, atelephone interview ofthe student, thestudent's Pellgrant file,or the student loanfile. Forstudents thatwere nottheir parents' dependent,theinformationwasobtained,inorderofpriority,fromthe financial aid application, the student'sphone
interview,thestudent'sPellgrantfile,orthestudentloanfile.
'IntheNLS-72,theaverage hourlywage
is$12.82 ($14.46)for
HBCU
attendees (graduates)and$10.55 ($11. 38)for
TWI
attendees(graduates). Themeanofthe naturallogarithmof hourlywagesisabout5%
(12%)higherforTWI
attendees(graduates). Thedifferenceintherankof wagesacrossHBCUs
andTWIsisdueto a singleHBCU
respondent with an average hourlywageof$494. Theinfluenceofthisobsei'vadonontheTable1 entriesisalso evidentinthelargerstandard deviation ofwagesamong
HBCU
attendeesandgraduates. SeetheDataAppendixfor detailsonthesampleselectionndes.develop anabilitytogetalong withindividualsofother races.
Thefinalpanel in Table 1 provides thetotal
number
ofHBCU
andTWl
observationsin eachsample. Italsoprovides
some
detailsontheincompleteobservations.As
asolutiontothe largenumberof observations withatleastone missingvariable,
we
turnalloftheexplanatoryvariables intoaseriesofindicator variablesbased onranges ofthe values ofthese variablesand includeseparate indicators for
missing responses toeachvariable. The bottompanel alsoreportsonthe
number
of observations withmissing
wage
information. Thesubsequentanalysisimplementsa standardselectioncorrectionapproachtoaccountforthesecases
(Heckman
1979).V.
The
Causesand ConsequencesofAttendingHBCUs
intheNLS
andB&B
DataFiles A. The Causes ofAttendingHBCUs
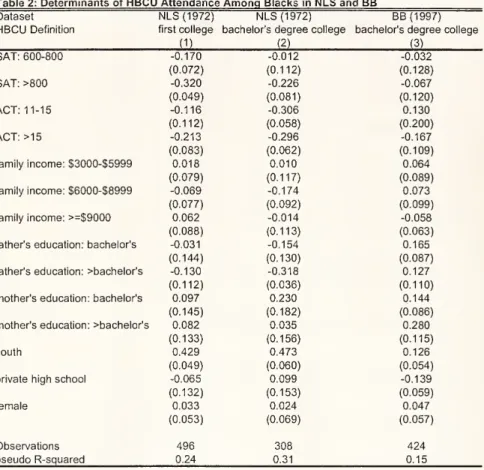
Table2presentsa seriesofestimatesofthedetenninantsof
HBCU
attendance.Thespecificationsestimatedareoftheform:
(1)
HBCU,
=
a
+
pX.''""^+
yX.''^^-^''"^^^+
e,,
where
HBCU
isadichotomousvariable thatequalsoneifthestudent attendsanHBCU
andzeroifnot,X
°' " denotes an aiTay ofvariables which proxy for a student's
home
environment, andX/™
^°''^''denotes pre-college characteristics of each student. In all instances, weighted Probit
regressionsareusedandthe coefficientsreportedaremarginaleffectsevaluatedatthesamplemean.The
weightsare thesampleweightsinthe relevant datafile.
The
interpretationofanycoefficientisthe effectofthatcoefficient relative to theomitted category
when
allother variables areheldattheirsample mean.The
home
environment variables thatwe
include are family income, mother and father'seducation,andwhetherornotastudent livesintheSouth.Familyincome,measuredin 1972dollars,is
dividedinto4categories:<$3,000,S3000
-
$6000,$6000-$9000,and$9000+basedonasurvey questiondescribedintheprevioussection.Parentaleducation(motherandfather,independently)ispartitioned into
threecategorical variables: lessthan aBachelor's degree, aBachelor's degree,and greater. Whetheror
notastudent livesintheSouthisa
dummy
variable thattakesonthevariableofoneiftheanswerisyes.Pre-collegecharacteristicsinclude
SAT
andACT
scores,high schoolGPA,
and whetherornot astudentattendeda privatehigh school.
Combined
SAT
scoresaredividedintolessthan 600,between600-800,andgreaterthan800.
ACT
scoresaredividedupsimilarly, lessthan11,between11 and15,andgreaterthan15.Highschool
GPA
ismeasured onafour pointscaleandisdividedinto lessthan2.5, 2.5 to3.5,andgreaterthan3.5.
We
alsoincludeanindicator forwhethertherespondentisfemale.In 1972,students
who
attendHBCUs
have lowerSAT
andACT
scoresand are more likelytoprobabilityofattendingan
HBCU
by 32%. Similarly,moving fromanACT
score ofless than 11 toascoreofmorethan 15 reducesthelikelihoodof attending an
HBCU
by21%. Studentswho
liveintheSouthare
43%
more likely to attendHBCUs,
holding all elseconstant. Family income and parentaleducation are not statistically related to
HBCU
attendance once our other covariates are taken intoaccount.
In the 1990s,thingschange. Standardizedtestscores arenolongersuchapowerfulpredictorof
HBCU
attendance.Parentswithmoreeducationaremorelikely tohavechildrenwho
attendHBCUs.
Allelse equal, a studentwhose motherhas morethan abachelor'sdegreeis28%)morelikely toattendan
HBCU.
This is notsurprising, as these institutions have a long histoi-y ofloyal alumni and familiallegacies(Drewiy and
Doermann
2001). ResidingintheSouth continuestobe an importantdeteraiinantofcollege choice, though the magnitude ofthe coefficient is roughly a fourth ofthe magnitude in the
seventies.Privatehighschoolisnegativelycon'elatedwith
HBCU
attendance.Therearemarked differencesbetweenthedeterminantsof
HBCU
attendancein the 1970sand1990s. The most obvious explanation ofthese differences is that conditioning on degree completion
selects forhighability studentsand
among
this set,differencesbetweenthetwoperiods willdisappear.Comparing colmnns2and3intable2
we
canmake
directcomparisonsbetweenthe70sandthe 90s;eachsampleconsistsonlyofdegi^eecompleters.
Intuition suggests that as resistance to black attendance at
TWIs
faded and the need forsegregated schoolingdeclines,thosewiththehighest opportunitycostof such schoolingwilloptoutand
choosemoretiaditionaluniversities. Inotherwords,itmightbe reasonabletoexpecta"brain drain"from
HBCUs.
Yet, the datashow
the opposite to be true.Lower
academic credentials are not as highlypredictiveof
HBCU
attendanceinthe1990sasthe1970s.Studentswith highereducated parentsaremorelikely toattend
HBCUs
inthe1990sandhigheracademiccredentials arenotasstrongapredictorofnon-HBCU
attendance.This providesevidenceofa selectionoftalentedBlackstudents intoHBCUs
inrecent years.B.EconometricApproachtoEstimatingtheConsequences ofAttending
HBCUs
In the absence of a randomized experiment or a credible instrumental variable for
HBCU
attendance,
we
implementfourstatisticalapproachesto adjustforpre-collegedifferencesbetweenHBCU
and
TWI
attendees. This subsectiondetailsthese strategies.Thefirstand simplestmodel
we
estimateisa linear specificationofthefonn:(2) outcome,
=
p^+
pX
.""'"""
+ oXr"""'"' +
5HBCU
+
f,.
Inallinstances, theestimationisdone usingweightedleastsquares, withweightscoiTcspondingtothe
sample weights providedinthe data. Equation (2)is a simple and easily inteipretable
way
to obtainestimatesofthe effectof
HBCU
attendanceonoutcomes, butitreliesona linearmodeltocontrol for the covariates Xj"""""^ and ^.'"^-"'^s^_ Thismay
be unappealing since their true functional form isunknown.
As
a solution,we
matchHBCU
andTWI
students with similar predicted probabilities orpropensity scores(p-scores)of
HBCU
attendance(Rosenbaum and Rubin1983).^ Theestimated p-scorescompress themulti-dimensional vectorofcovariates intoanindex. Theadvantages ofthe propensity
score approach aretwofold. First, itisa feasiblemethodtocontrol forobservables inamoreflexible
manner than is possible with linear regression. Second, it provides an opportunity to focus the
comparisons ofoutcomesbetweenthe
HBCU
andTWI
attendeesamong
thosewithsimilar distributionsofthe obsei'vables. Since
we
modelallofthecovariateswithindicatorvariablestheformer advantageisnotsocompellingin thissetting,butthelatterisa real asset here. Finally,itisimportantto emphasize
thatjust as with linear regression, the identifying assumptionis thatassignmentto the treatment(i.e.,
HBCU
attendance) is associated only with observable pre-period variables. This is often called theignorable treatmentassignment assumptionor selectiononobservables.
We
implement thep-score matching strategy inthree steps. First, the estimated p-scores areobtainedbyfittingprobitregressionsfor
HBCU
attendance(identical toequation1 above),using X!""^"""and Xj'^'^'^"
'^^'^
as explanatoiy variables. In other words,
we
try to replicate the average student'sselection rulewith theobsei"ved covariates.
We
then conducttwo teststo ensurethatthep-scores are suitable.For bothtests,we
dividethe sampleinto quintilesbasedontheirp-scores. In thefirsttest,we
assesswhethertheestimated p-scoresareequal acrossthe
HBCU
andTWI
studentswithinquintiles. In the secondtest,we
examine whetherthemeansofthecovariates areequalfor thetwosetsofstudentswithineachquintile. Ifthe nullhypothesisofequalityisrejected for eithertest,
we
dividethe qunitilesand/orestimatea richerprobitmodel byincludinghigher order termsandinteractions.' Oncethe nullis
acceptedforbothtests,
we
proceedtothenextstep.Second,the"treatmenteffecfforagivenoutcomeiscalculatedby comparingthe differencein
theoutcome between
HBCU
andTWI
studentswithsimilaror"matched"valuesofthep-score.We
dothis intwoways. Thefirstcalculates atreatmenteffect foreach
HBCU
student forwhichthereisatleastone
TWI
studentwith an estimated p-score within 0.10 oftheHBCU
student's p-score. Incaseswheremultiple studentshavep-scoreswithin0.10,
we
take thesimpleaverageofoutcomeacrossallofthesestudents.Further,thismatchingisdonewithreplacement sothat individual
TWI
studentscanbeusedasAn
alternativeistomatchonasingle (orpossiblyafew)crucial Govariate(s).SeeAngristandLavy(1998)orRubin(1977)for applications.
'SeeDehejiaandWahba(2002)andRosenbaum(1984)formoredetailsonhowtoimplementthepropensity score
method.
controls formultiple
HBCU
students. Thesecondmatching approach usesalloftheTWI
students tofomi acontrol for each
HBCU
student but in calculating the averageamong
themwe
use akernelweighted average,wheretheweightisinversely proportionaltothe distanceto the
HBCU
student'sp-score.
We
useaGaussian kernel withabandwidthof0.10.Third,asingletreatment effectisestimatedbyaveragingthetreatmenteffectsacrossall
HBCU
students forwhichtherewasatleastonesuitablematch. Thisapproach hasthedesirablepropertythatit
focusesthecomparisonswherethereisoverlapinthe distributionof propensityscores
among
theHBCU
and
TWI
studentssothese students are"similar.""We
also implementtwoothereconometric approachestoaccountforpotentialselection issues.First,
we
estimateprobits forwhetherthewage
variableismissingonthesample ofobsei'vationswithmissingand non-missing
wage
values.We
then includetheinverseMill's ratiofromthese probits inequation(2) toaccountforthe possibility thatwages arenotmissingatrandom
(Heckman
1979). Thisprocedure is identifiedfrom afunctionalformassumption, since
we
areunaware ofa validexclusionrestrictionin thissetting.
Second,the available data sets
may
not includemeasuresofsome
attributes (e.g., strength ofessay,motivation,and teacherrecommendations)thatpersuadeadmissions committeestoselectcertain applicants foradmissionthatarealsorewardedinthelabormarket. Further,these attributes
may
differacross
HBCU
andTWI
students.Theleastsquaresand propensityscoreapproachesrelyon"selectiononobservables"assumptionsandwillproduce biasedestimatesin thiscase.
To
confrontthissourceofmisspecification,we
implementavariantofthemethodpioneeredbyDaleandKrueger(2002)thatmatchesstudentsbasedonthecolleges wheretheywereaccepted. This
approach can onlybeimplementedwiththe
NLS
datafile,asB&B
does not contain informationonthesetsofcollegestowhichindividuals areadmitted.
We
operationalize theDaleandKruegerapproachbydetenniningthe identityofthecolleges thatacceptedeachstudent.
Among
thecollegeswheretheywereaccepted,
we
find themidpoint ofthe 25th-75thpercentileSAT
range reportedinUS
Nev.'s&
WorldReport(2006).
We
use currentSAT
scores since scoresfrom 1972 are unavailable. Forcolleges thatreportonly
ACT
scores,we
usean equivalencescaletoconverttoSAT
scores.For each student,
we
recordthe highestmidpointSAT
score ofany college that acceptedthestudent.
We
dividethestudents intofourgroupsbyquartilesoftheschoolwiththehighestmidpointSAT
among
the schoolswhere they wereadmitted.We
then include separate indicators for each ofthesegroups inequation (2). This approachmitigates the impact of any confounding due tocharacteristics
'"
SeeDehejiaand
Wahba
(2002)andHeckman,Ichimura,andTodd(1998)onpropensity score algorithms. " Ifthereare heterogeneous treatment effects, thisstrategy produces an estimate ofthe average effectofthe"treatmentonthe treated".
obsei-vable to admissions officers that are notmeasiu'ed in the dataset. Specifically, the identifying
assumptionisthat afteradjustmentfor theavailable covariates, thedecisiontoattend a
HBCU
versus anon-HBCU
withina quartileis"ignorable" ororthogonaltounobserved determinants of outcomes. See DaleandKrueger(2002)for amoredetaileddiscussionofthisapproach.Finally,
we
note thatwe
considered a number of candidate instrumental variables, such as distance to a student's nearestHBCU,
residingintheSouth,or theclosingofHBCUs,
butin allcaseswe
were unconvincedthattheexclusionrestrictionwasvalid or theinstruments werenotpowerfulenoughforthe relativelysmallsamples inthe available datafiles. Withapproximately300 observations,itis very difficult to constmct an instmment with apowerful first stage. Consequently, thorny issues of
selection
may
stillremain.C.EstimatesoftheConsequences ofAttending
HBCUs
DistributionofEstimated P-Scores. Figures1 and2 presentseparatekerneldensity plotsofthe
estimated propensityscores forblackstudents thatreceiveddegreesfrom
HBCUs
andTWIs
with theNLS
andB&B
datafiles,respecdvely.To
obtainthese figures,weightedprobitswereestimatedonthesetofstudents
who
completedtheirbachelor'sdegreeatanHBCU
orTWI.InFigure1,whichisbasedonthe
NLS
data,it is evidentthat themean
propensity scorediffers across thepopulations, but there issubstandal overlapinthe distributions,exceptatp-scoresexceeding roughly0.9. Thedistributionsof
p-scoresinthe
B&B
aremoresimilarthroughoutabroader range ofthe p-score. However,there aren'tanyTWI
students with p-scores greater than about 0.8. Thus, it will be difficult to obtain meaningfulcomparisonsforthe relativelysmall subsetof
HBCU
studentswith p-scoresinthisrange.Wage
Outcomes. Table 3 presents results ofthe effect of attending aHBCU
on the naturallogarithm ofwages from the four approachesinthe six columns. The estimated standard errors are
reportedinparenthesesbelowthepoint estimatefor the
HBCU
indicator. In theNLS
entriesinPanelsA
andB,thestandardeiTorsallowforclustering
among
observationsfromstudents thatattendedthesamehigh school (exceptin column 5). In Panel A,the treatment ismatriculationat a
HBCU,
whileitisgraduationfroma
HBCU
inPanel B. FortheB&B
entries inPanel C,we
reportstandarden-ors thatallow for unspecified heteroskedasticity in the variance-covariance matrix. Underneath the standard
eiTors,
we
report the R-squaredstatistic,aswellas thenumber
ofstudentsinHBCUs
andTWIs
inthe relevantsample. FortheNLS,
wagesaremeasuredin 1986-
fourteen yearsafterhigh school graduationand roughly 10 yearsafterobtaining a bachelor'sdegree. In the
B&B,
wagesare in 1997,fiveyearsaftercompletionofthebachelor's degree.
Column
1reports themean
differenceinlabormarketwagesfor individualswho
attendHBCUs,
without adjustment for any controls. In the
NLS,
HBCU
students earn roughly5%
lesswhen
thetreatment isthefirstcollege attendedand 11.5%
when
itisreceiptofa bachelor'sdegree. Neither ofthese estimates is statisticallydifferent from zero atconventional levels. The
B&B
estimate fromthe1990sindicates that
HBCU
graduates earn16.6%lessthanTWI
graduates. Recall,Table1 demonstratedthat on observable dimensions
HBCU
students have lesser academic credentials than theirTWI
counterparts(especiallyintheNLS),sotheserawgapsare likely
downward
biased.Column
2reports the resultsfromestimatingequation(2).Theadjustmentfortheacademicandhome
environmentcontrolschangesthe resultsintheNLS
dramatically.'"Thewage
benefitof attendingaHBCU
inthe1970sis11.1%when
HBCU
statusisbasedonthefirstcollegeattendedand6.0%when
itisdefinedasreceivingabachelor'sdegree. ThefoiTnerestimateismarginallysignificant,whilethelatter
hasan associatedt-statisticlessthan1.'^ In the
B&B,
however,thewage
effect forattendingHBCUs
is-13.8%)andthe nullof zerowouldberejectedwith conventionalcriterion.'''
The
nexttwocolumnsreportontheimplementationofthep-scoremethodtotestthe sensitivityofthese resultsto the linearmodel.
Column
3 uses kernel matching, while column4relies on radiusmatching.'^ Standard errors for both matching estimates were bootstrapped (200 iterations), with
propensity scoresrecomputedforeach bootstrap sample. Further, thep-scorematching estimatesarenot
weighted withthesampleweights.
Thep-score estimates are remarkablysimilar tothose from the linearregressionin column 2.
This finding shouldn't be teixibly sui"prising because equation (2) models the covariates flexibly,
neverthelessitisreassuringthatfunctionalfomiissuesdon'tappear importantin thissetting.
Column
5presentsestimatesthatare selectioncorrectedformissingwagesand adjustedforthefull setofcovariates. It seemsplausible that
HBCU
attendanceiscoiTelatedwithselectivewithdrawalfromthelabor force. Thispossibilityisnotsupportedbythedata asthisapproachproduces unimportant
changeintheestimatedimpact of
HBCUs
onwages.''^
A
similar resultwas foundinConstantine (1995).
'^Resultsaresimilarifone implementsa "fractionmethod,"using individualtranscripts tocalculate the fractionof
astudent'scollegeexperiencethatwasspentatan
HBCU.
'^Inthemost
recentwaveofthe
B&B
(B&B
2003)thereisnowagegapbetweenHBCU
studentsandnon-HBCU
students.Unfortunately,
53%
oftheHBCU
sampledoes nothavevalidwagesinthelatersurvey(someareinthe survey and unemployed while others were dropped completely).HBCU
graduates have a 9.6% higherunemployment rate, and median regression techniques provide identical results to the 1997 wave. Thus,
we
concentrateonthe earlierwavewithmore completedata.
''
Observations with estimated p-scoresthatare notstrictly between and 1 are dropped. Further, welose 7
observationsinthe
NLS
whenthetreatmentisfirstcollegeattendedand21whenthetreatmentisdegreecollege,and21observationsinthe
B&B
whenimplementingtheradiusmatchingestimatorsduetooutliersthatdidnothavematchesintherelevant range.
"
We
alsoassessedtheimpact of labormarketdropoutsonour estimates withasimple re-weightedlinearregressionandmedianregression. In thefirstapproach,weestimateaprobitofwhetherornot
we
havevalidwages onallofthecovariatesinTable2.
We
then multiplied thesamplingweightbytheinverseof the predicted probabilityintheprobit togetnewweights. Linear regressionsarethen esrimatedwith thesenewweights. Thisapproach led to
remarkably similar conclusions as the selection correction approach. Median regressions were estimated by
Column
6implementsthecolumn2specificationbut addscontrols forthe"best"schoolthatthestudentwasadmittedto inordertoaccountforthe richerdataavailable toadmissionscommittees (Dale
and Krueger2002). Specifically,
we
includeindicators for the threehighestquartilesofSAT
scoresofthebestschoolthatthestudentwasadmittedto,leavingthelowestquartile as theexcluded group. This
methodis onlypossible in the
NLS
dataand inthis sampleitdoubles estimatedimpact of attendingaHBCU
to 22.5%. Specifically, this approach suggeststhat the gains fromHBCU
attendancemay
belarger than indicated by the other methods. However, the estimate's imprecision makes definitive
conclusionsunwarranted.
Additionally,
we
conductedanumber
oftests forwhethertherewasheterogeneityinthe returnstoattendinga
HBCU,
whicharereportedinAppendixTable2.We
assessedwhetherreturns differedwith students'
home
region (i.e., South versus North), their estimated propensity score,SAT
Score, parental education,andgender. In general,thereisn'tsubstantialevidence of heterogeneity acrossthesesubsamples ofstudents. Theloneexception isthatthe returnstoattending a
HBCU
appear higherforblack
women
thanforblackmen
intheNLS
sample. It isalsoimmediately evidentthatsubdividingthesampleistoodemandingofthedataasthestandarderrors in thesubsamplesare
much
larger.Overall, these resultssuggestthatattendingan
HBCU
conferredremarkable advantageson itsstudents in the 1970s. Conventional estimates of the average return to college are
10%
per year(Heckman, Lochner and
Todd
2003). Attending aHBCU
versus aTWI
in the 1970s was roughlyequivalent to one more year ofschooling. In contrast, more recent
HBCU
attendees appear to besuffering awagepenalty. Ifthepointestimates aretakenliterally,thereisnearly a
-25%
swing inthe relativereturnofHBCU
attendanceinjusttwodecades.Non-wage
outcomes. Thus farwe
have concentrated onthe effect of attendingaHBCU
on a singleoutcome: labormarketwages.Thevalueof attendingHBCUs,
however,likelyextends wellpastlabormarketconsiderations.Theconventional
wisdom
isthatthese institutionsinstillconfidenceintheirstudents,a senseofresponsibility,andprovideenvironmentsfreeof racismanddiscriminationthatallow
for greaterpersonal development. Such environmentsare likely to have
many
benefits beyond thosecapturedinwages.
Table 4 explores the effect of attending
HBCUS
on a number ofoutcomes, including theprobability offull-timeemployment, measures oflifesatisfaction, andaseries ofacademicoutcomes.
Thesewiderangingoutcomeswerechosen because oftheireconomic andsocialrelevanceaswellas their
comparability across datasets. The academic outcomes indexis the first principal component ofthe
dummy
variables for majoring in business, majoring in physical science/mathematics/computerimputingzerostoallmissingwageobservations. Qualitativeconclusionswere thesame,thoughthecoefficients
weresmallerasexpected.
science/engineering, majoring in biological science/liealth, receiving a bachelor's degree, attending
graduateschool,andreceiving agraduatedegree. Thecoefficientsreportedinthe table are fromkernel
matchingestimatesandtheirassociated bootstrapped standardeiTors. Inallcases,weightedleastsquares
confrnntheseresults.
The moststriking finding fromtheseoutcomes isthat
HBCU
matriculationisassociatedwith anearly
10%
increaseintheprobabilityof receivingabachelor'sdegree. Itisevidentthat partofthewage
gaininthe1970sisduetotheincreasedprobabilityof graduatingfromcollege. Thereis
some
evidencethatstudents
who
attendHBCUS
aremodestlymorelikely tomajorinphysicalsciences. Interestingly,HBCU
andTWI
matriculatesreport similardegreesoflifesatisfaction.Therearenegligible effectsonallother outcomes.
VI.
A
FocusedLook
attheMost
EliteHBCUs
There issubstantial qualityvariation
among
theset of 89 4-yearHBCUs,
aswell asamong
theTWIs.
To
thispoint,we
haveanalyzedtheNLS
andB&B,
whichare nationallyrepresentative datafilesthatincludethefullspectrumof
HBCUs
andTWIs
fromthe qualitycontinuum.Inthissection,we
takeamore focused look at four of the most elite
HBCUs:
Morehouse, Xavier, Spellman, and Howard.(Importantly, the 1989datasetdoes not include infonnation on Spellman and
Howard
students.)One
limitationofthis exercise isthatduetothe
C&B's
sampling approach,thesefourHBCUs
can only becomparedtothethirtyselective
TWIs
inthesample.Table5reportsonthedetenninantsof attendanceforelite
HBCUs
forthe 1976and 1989 cohortsof
C&B
fromestimatingequationsidenticaltothoseinTable 2."Column
(1)isasampleofindividualsin all4
HBCUs,
column(2)dropsHoward
andSpelmansothatwe
canmake
directcomparisons withthe1989 cohortwhich is displayedin column (3). Thepatternsacrossthe columns are quite similar. The
parametersonthestandardizedtestscores are themostnotableresults.Evaluatedatthesamplemean,the
difference betweena
SAT
score oflessthan600and aSAT
scoreabove 800impliesa40.1%decrease(colunm2)inthelikelihoodof attending anelite
HBCU
inthe1976 cohort anda63.1%decrease(column3)in the 1989cohort.
ACT
scoreshave a similar effect onHBCU
attendance.Mother's education ispositivelyassociatedwith
HBCU
attendancein 1989. Afteradjustmentfor theacademiccharacteristics, the incomevariables are not reliable predictorsofeliteHBCU
attendance. Residing in the southernportion ofthe United States continues to be a strongpredictor of
HBCU
attendance; increasing theprobabilityof attendancebyroughly 40%.'^
'^Throughout
the
C&B
analysis,thetreatmentisdefinedasenrollmentataHBCU,
notgraduationfromone. Forconsistency withtheothertables,
we
refer tothetreatmentas"firstcollege",althoughduetotheC&B'ssamplingschemeitispossible (but unlikely)that arespondentwasinitiallyenrolledata differentcollege oruniversity.
'*The
Figures3 and4plotthe distributionsoftheestimated propensity scoresforthe
HBCU
andTWI
attendeesfromthe 1976 and 1989
C&B
classes, respectively.Howard
andSpelman were dropped fromthis analysisto
make
thesamplesconsistent. Itisapparentthatthereisn'tsubstantialoverlapacross thetwodistributionsineither year, especiallyin1989. Thisfindingconfirmstheimpressionfromtheprobit
resultsthattheacademiccredentialsofthese students differinimportantways.
The pooroverlapofthe distributionsposes challengesfortheoutcomesanalysis. Forexample,in
thepropensityscore exercisewhere
we
require theTWI
students tohave p-scores within0.1 oftheHBCU
student, itis apparentthat
we
willrelyon asmall subset ofthe data. Inthis subsetofthe data, the selectiononobservablesassumptionmay
beespeciallyunlikelytobevalid.On
theotherhand,we
can useleastsquaresfunctional forniassumptionsto infercounterfactualsinpartsofthe distributionwherethere is littlesupport. Neitherapproach isespecially appealing, which underscores thedifficulties of
infeiTingtheimpact of
HBCU
matriculationin thissample.Consequently,the forthcoming resuhs shouldbeinterpretedwiththeseimportant caveatsinmind.
We
now
turn toan exploration ofthe effectof attendingeliteHBCUs
onlabormarket outcomes,measuresoflifesatisfaction,andacademic outcomes fromthe1976 and1989
C&B.
One
majorbenefitofthe
C&B
database is the availability of detailed questions about life outcomes, beliefs, collegeexperiences, labormarket outcomes and experiences, politicaland civicengagement, and more.These
rich questions can helptoshedlightonthe overall experience ofstudentsattending
HBCUs
andnon-HBCUs.
For both cohorts, data on the majority ofoutcomes was obtained in 1995, 15 years aftergraduationforthe earlycohortand2yearsaftergraduationforthelatercohort,thoughsomedatasuchas
wages in the 1989 cohort were collected in 1996. Individuals without valid
wage
obsei"vations aredropped fromthesample.
Becausethenumberofpotentialdependentvariablesin
C&B
issonumerous,we
construct five indicestobetterunderstandtheexperiencesofHBCU
studentsalongthefollowingdimensions:objectiveacademic, subjectiveacademic, labormarket, leadershipandlifestyle, andsocial interactions. Thedata
appendix describesthe specificquestionsusedto
make
upthese indices.Eachindexisobtainedbytakingthefirstprincipalcomponentofthe setofvariablesdescribed.Thisapproach hastwo main advantages.
First,principalcomponentsanalysisreducesthedimensionality of problemsbyextracting theportionofa setofvariables thatexplain themost variance withinthe set.Second, itensuresthatallvariables are
measured onthesamescale. Thecostisthatthe result'smeaningisn'ttransparentand cannoteasilybe
appliedtodifferent settings.
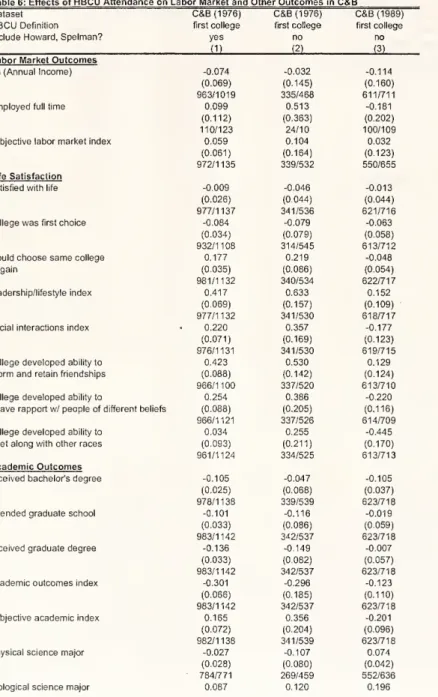
Table 6reportsthe resultsof estimatingthe effectof
HBCU
attendanceon oursetofwage andnon-wage outcomes fromkernelmatching,whichcanbecomparedto theresults incolumn3 of Tables3
the1989sample.
and4.
Column
1 includesallfourHBCUs
inthe 1976 sample.Column
2also reports resultsfromthe1976 samplebut only includes students
who
attendedMorehouse and Xaviertofacilitatecomparisons withthe1989cohort,whoseresultsarereportedincolumn3.Inthe 1976cohort,
HBCUs
graduateswere9%
morelikely tomajorinthe biologicalsciencesand 11.1% morelikely tomajorinbusiness,but
10%
less likely to attendgraduate schooland,conditionalonattending, 13.6%less likely to receiveadegree.
On
objectiveacademicoutcomes,HBCU
students are significantly negative, though their subjective view ofthe academic experience is quite positive.Leadershipand lifestylecomponentsofthe
HBCU
experienceare large, whichisconsistentwithmuch
thathas been written on these institutions (Drewey and
Doennan
2001). Social interactions are alsostatisticallysignificantandsubstantively large.Thelabormarket experiencesare positive,butnegligible.
Studentsdonotseemtopossessa particular taste forsegregation, as
HBCU
graduatesarenomorelikelyto live inmoreracially
homogenous
zipcodes.And,HBCU
graduatesarenomorelikelytobeengagedinpolitical, religious, civil rights, social service, or philanthropicactivities. Theclearestevidence ofthe
importance of
HBCUs
isthat,controlling forallother factors,HBCU
students are 18%
more likelytoreporttheywouldchoosethesamecollege again.
The
1989 cohortreports differentexperiences.Studentsaremorelikely tomajorinphysicalandbiologicalsciencesandbusiness.Studentscontinuetobenefitfromleadershipandlifestylecomponentsof
HBCUs,
butthemagnitudesofthese effects are lessthan one-fourthoftheirpreviouslevels.Many
oftheotherpositiveelements turnnegativeinthemorerecent cohort.Theobjectiveandsubjectiveacademic
outcomesarenegativeand
HBCU
matriculates are10%
lesslikely toreceive a bachelor'sdegree.Thesocial interactions index, which was positive in the 1976 cohort, tiuTis sharply negative in the 1989
cohort.Thetabledemonstratesthatthisdeclineisalso substantialinthreeofthevariables that areusedto
constmcttheindexin 1976and 1989.Thelabormarketexperiences ofthelatercohortareevenmore
negative,andtheyseemto havea taste forsegregation.
HBCU
attendanceisassociatedwithliving inazipcodethathas a
16%
higherfractionofblacks.Most
telling,HBCU
students arelesslikelythannon-HBCU
students to report they would choose the same college again, although the difference isn't statisticallysignificant.Interestingly,
HBCU
studentsin the latercohortare significantly more likelytobe engaged inactivities which are associatedwith civic consciousness. This
may
partly explain the divergence in19 wages.
VII.Reconciling the Differencesbetweenthe1970sand1990s
A.AssessingtheDifferencebetweenthe1970s
and
1990sResults"
We
are grateful toLaniGunierforpointing outthispossibility.Panel
A
of Table 7summarizesthe difference inthe results betweenthe 1970s and 1990s. Itreportsregressionresultsfor fiveofthekeydependentvariablesexaminedabove.
The
differenceisthatwe
usethestacked1970 and 1990datasets toestimate thefollowingequation:(3) outcome!,= Po+y,X/"^=""
+
a, x,r-'°"'<''+
X l(HBCUi,)+
51(1990,,)+ei(HBCUi,)-l(1990i,)+Si,,
wheretheisubscriptindexesanindividualandthetsubscriptrevealswhethertheobservationisfroma
1970sor1990scollege student. Theparametervectorsy and a havetsubscripts indicating thattheyare
allowedtodifferfor 1970s and 1990scollege attendees. Theequationalsoincludesseparate intercepts
forattendinga
HBCU
and whethertheobservationisfroma1990s collegeattendee. Theparameter ofinterestis 9,whichisassociated withthe interactionbetweenthe
HBCU
indicatorandtheindicator foranobservation from the 1990s. This parameter is a difference in differences (DD) estimate of
HBCU
attendanceandisequaltothe differenceofthecross-sectional
HBCU
estimates(e.g.,column2inTable3).^"
Incolumn(1),thedependentvariableisthenaturallogarithmof wages. Forthisregression, the nationally representative
NLS
andB&B
data files areused.The
otherseven dependentvariables aretaken from the 1976and 1989
C&B
samples, which focused on asubsetofeliteHBCUs
andTWIs.Howard
and Spellmanattendeesaredroppedfi-omthesample,just as incolumn(2)ofTable6.The
results summarize the change in the relative returns toHBCU
attendance over the twodecades. Thefirstfour"objective"outcomes(i.e.,thosewherea higher value ofthedependentvariable
wouldbe considereda positive)suggestthatthereturnsto
HBCU
attendance havedeclined. Specifically,thepoint estimatessuggest a
20%
declineinwages,a13%
deplineinthe fractionofstudentswho
wouldattend thesamecollegeagain, andsubstantialdeclinesintheleadershipandsocialinteractions indices.
The
other three"objective" outcomes, which measure political participation, social/civic sei-vice, anddonationsto national charities, all
show
anincrease betweenthetwoC&B
classes. Thenon-objectivemeasure indicates that
HBCU
attendeesbecame
less likely to live inintegratedneighborhoods. It isnoteworthythatallofthese estimates areeconomicallyandstatisticallysignificant.
B.RobustnessoftheResultthat
HBCUs
'Performance Worsened betweenthe1970sand
1990sThis subsectionreportsonsomechecksthataimtoexploretherobustnessofthebasic result that
the economic returns to attending a
HBCU
declined.Many
obvious explanationsfail to explainthe differences.We
have ensured,throughthe useof Federal Interagency Committee on Educationcodes, thatthe definitionofHBCUs
isconsistent across datasetsand overtime.Moreover,theaddifionofmore^^The
C&B
results arenotidentical tothedifferencebetweenthe 1989 and 1976resultsinTable 6 becausethat tablereportsonthekernelmatchingresults,while Table7 reliesonleastsquaresadjustmentforthecovariates.