Publisher’s version / Version de l'éditeur:
Analytical Chemistry, 67, 22, pp. 4145-4154, 1995-11
READ THESE TERMS AND CONDITIONS CAREFULLY BEFORE USING THIS WEBSITE.
https://nrc-publications.canada.ca/eng/copyright
Vous avez des questions? Nous pouvons vous aider. Pour communiquer directement avec un auteur, consultez la première page de la revue dans laquelle son article a été publié afin de trouver ses coordonnées. Si vous n’arrivez pas à les repérer, communiquez avec nous à PublicationsArchive-ArchivesPublications@nrc-cnrc.gc.ca.
Questions? Contact the NRC Publications Archive team at
PublicationsArchive-ArchivesPublications@nrc-cnrc.gc.ca. If you wish to email the authors directly, please see the first page of the publication for their contact information.
NRC Publications Archive
Archives des publications du CNRC
This publication could be one of several versions: author’s original, accepted manuscript or the publisher’s version. / La version de cette publication peut être l’une des suivantes : la version prépublication de l’auteur, la version acceptée du manuscrit ou la version de l’éditeur.
For the publisher’s version, please access the DOI link below./ Pour consulter la version de l’éditeur, utilisez le lien DOI ci-dessous.
https://doi.org/10.1021/ac00118a018
Access and use of this website and the material on it are subject to the Terms and Conditions set forth at
Comparison of liquid chromatography/mass spectrometry interfaces
for the analysis of polycyclic aromatic compounds
Anacleto, Joseph F.; Ramaley, Louis.; Benoit, Frank M.; Boyd, Robert K.;
Quilliam, Michael A.
https://publications-cnrc.canada.ca/fra/droits
L’accès à ce site Web et l’utilisation de son contenu sont assujettis aux conditions présentées dans le site
LISEZ CES CONDITIONS ATTENTIVEMENT AVANT D’UTILISER CE SITE WEB.
NRC Publications Record / Notice d'Archives des publications de CNRC:
https://nrc-publications.canada.ca/eng/view/object/?id=0a35238b-d377-4ded-a551-ceb7ebabea88 https://publications-cnrc.canada.ca/fra/voir/objet/?id=0a35238b-d377-4ded-a551-ceb7ebabea88
Anal. Chem.
zyxwvutsrqponmlkjihgfedcbaZYXWVUTSRQPONMLKJIHGFEDCBA
1995, 67,4145-4154Comparison of Liquid Chromatography/Mass
Spectrometry Interfaces for
the
Analysis of
Polycyclic Aromatic Compounds
Joseph F. Anacleto,tlL Louis Ramaley,t Frank M. Benoit,* Robert K. Boyd,*is and Michael A. Quilliams
Department of Chemistty, Dalhousie University, Halifax, Nova Scotia, Canada B3H
zyxwvutsrqponmlkjihgfedcbaZYXWVUTSRQPONMLKJIHGFEDCBA
4J3, Environmental Health Centre,Health Canada, Tunney's Pasture, Ottawa, Canada K1A OL2,
zyxwvutsrqponmlkjihgfedcbaZYXWVUTSRQPONMLKJIHGFEDCBA
and Institute for Marine Biosciences, National ResearchCouncil of Canada, 141 1 Oxford Street, Halifax, Nova Scotia, Canada B3H 321
W e e liquid chromatography/mass spectrometry inter- faces were evaluated for their suitability for the analysis of complex mixtures of polycyclic aromatic compounds (PACs). Preliminary qualitative experiments, which used a carbon black extract as test material, confirmed that the moving belt interface is mechanically awkward, is limited
with respect to the mobile phase composition which it can
zyxwvutsrqponmlkjihgfedcbaZYXWVUTSRQPONMLKJIHGFEDCBA
tolerate, and is not efficient in detecting the more volatile compounds, For these reasons it was not examined further, although it performed well for larger PACs and provided electron ionization (EI) mass spectra. The particle beam (PB) interface also provides E1 spectra, but detection limits are poor (low nanogram range) and calibration cuves are nonlinear. Only seven of the 16 PACs targeted for quantification in a complex coal tar
reference material could be detected because of the ditticulty the PB interface has with the analysis of com- pounds with very
high
or very low volatility. The heated pneumatic nebulizer (HPN) interface, which uses atmo- spheric pressure chemical ionization, produces bothmolecular ions ( M + ) and protonated molecules
zyxwvutsrqponmlkjihgfedcbaZYXWVUTSRQPONMLKJIHGFEDCBA
(MH+)
ofPACs. Detection
limits
were in the low picogram range, and calibration curves were linear. Using the HPN interhce,17
target PACs in the coal tar reference material could be detected and quantified within satisfactory agreement with certified values when perdeuterated in- ternal standards were employed.Polycyclic aromatic compounds (PACs) are potent environ- mental mutagens and carcinogens, formed from both natural (e.g., biosynthesis and natural combustion) and anthropogenic (e.g., high-temperature combustion) s0urces.l Complex mixtures of these ubiquitous compounds are commonly found in airborne particulates, tobacco smoke, fossil fuels, marine sediments, and food. In addition to health issues, the petroleum and synthetic crude oil industries are also concerned with the interferences that PACs produce in various upgrading processes. In particular, nitrogencontaining PACs are suspected of deactivating and poisoning catalysts during cracking and reforming processes.
' Department of Chemistry, Dalhousie University.
* Environmental Health Centre, Health Canada.
8 Institute for Marine Biosciences, NRCC.
Present address: SCIEX, 71 Four Valley Dr., Concord, ON, Canada L4K
(1) Lee, M. L.; Novotny, M. B.; Bartle, K D. Analytical Chemistry ofPolycych 4V8.
Aromatic Compounds; Academic Press: New York, 1981.
0003-2700/95/0367-4145$9.00/0 0 1995 American Chemical Society
Plugging problems and reduced heat exchange also arise from the formation of high molecular weight polycyclic aromatic hydrocarbon @'AH) deposits in exchangers, transfer limes, and valves.2
The difficulties associated with the characterization of samples containing PAC fractions are due primarily to the large numbers of possible compounds and isomers (which increase with molec- ular weight). Even for routine qualitative analyses, therefore, methods combining good chromatographic resolving power with selective and sensitive detection are essential for meaningful results to be obtained. Although gas chromatography (GC) possesses high resolving power and can be coupled easily with mass spectrometry (GUMS), its applicability is restricted by the limited volatility of PACs of higher molecular weights. In addition, the separation selectivity of GC for isomeric PACs is often disappointing. Quantitative analysis of complex matrices for target PACs is an even more demanding task, for which methodology is still being developed or improved. The activities of the U.S. National Institute of Standards and Technology (NISI') in this area have been summarized re~ently.~
Liquid chromatography (LC) has several advantages over GC. Less sample cleanup is required, thermally labile compounds are more easily analyzed since they are not exposed to excessive heat (though this is not a major consideration for PACs), derivatization is usually not necessary, and PACs with high molecular weights may be analyzed because volatility is not an issue for optical detection and is not such a stringent requirement for LC/MS
analysis.
zyxwvutsrqponmlkjihgfedcbaZYXWVUTSRQPONMLKJIHGFEDCBA
LC
is also an inherently better quantitative method because of the injection volume precision available with fixed loopinjectors compared with that for syringe injections with GC. The high chromatographic efficiency available from capillary GC, however, is not currently available from conventional LC. Thus, LC chromatographic peaks are more likely to contain unresolved components, which increases the need for more selective detection methods, such as mass spectrometry. The lower chromatographic efficiency of
LC
is offset to some degree by the higher separation selectivity made possible through manipulation of the composition of both stationary and mobile phases, e~emplified~-~ by theLC
(2) Sullivan, R F.; Boduszynski, M. M.; Fetzer, J. C. Energy Fuels 1989, 3,
603-612.
(3) Wise, S. A; Schantz, M. M.; Benner, B. A, Jr.; Parris, R M.; Rebbert, R E.; Sander, L. C.; Koster, B. J.; Cheder, S. N.; May, W. E. Fresenius J. Anal. Chem. 1993,345, 325-329.
(4) Sim, P. G.; Boyd, R K; Gershey, R M.; Guevremont, R; Jamieson, W. D.; Quilliam, M. A; Gergely, R J. Biomed. Enuiron. Mass Spectrom. 1987, 14,
375-381.
separation of some PAC isomers which are difficult or impossible to separate by GC.
The main obstacle to routine analytical applications of
zyxwvutsrqponmlkjihgfedcbaZYXWVUTSRQPONMLKJIHGFEDCBA
LC
coupled directly to MS (LCIMS) has been the unavailability of rugged and reliable LC/MS interfaces, and this has also been true in the special case of PAC analysis. We have employed the moving belt (MB) interface previously for the analysis of PACs in marine sediments435 and for qualitative characterization of high
molecular weight PACs
zyxwvutsrqponmlkjihgfedcbaZYXWVUTSRQPONMLKJIHGFEDCBA
(MW up to 580) in a sample from a coaltar dump site.6 Severe limitations on the mobile phase composi- tion and flow rates were encountered. In general, solvent gradients were restricted to a low aqueous content and/or low flow rates to ensure that almost all the mobile phase was evaporated before the belt entered the ion source.
This paper describes a comparison of the MB, particle beam (PB), and heated pneumatic nebulizer (HPN) LC/MS interfaces for qualitative and quantitative analyses of PACs using reversed phase
LC.
Both the MB and PB interfaces were used withelectron ionization
zyxwvutsrqponmlkjihgfedcbaZYXWVUTSRQPONMLKJIHGFEDCBA
@I), while the HPN interface used atmospheric pressure chemical ionization (APCI).
The capabilities of the threeLC/MS interfaces to provide qualitative information on PACs with a wide range of molecular weights were tested using an extract of carbon black. In evaluations of the interfaces for quantitative analyses, detection limits and linear dynamic ranges were com- pared using PAC standards, and the concentrations of 17 PACs in the NIST certified coal tar reference material (SRM 1597) are reported for measurements using internal standardization with perdeuterated PAC standards. The objective of the work was to determine whether the advantages of LC/MS over GC/MS (ability to analyze larger PACs and greater separation selectivity) could be implemented in a rugged, reliable methodology with adequate sensitivity and dynamic range.
EXPERIMENTAL SECTION
Materials. HPLC grade acetonitrile and dichloromethane
were obtained from BDH Chemicals (BDH Inc., Toronto, Canada) and were used without further purification. Distilled water was passed through a Milli-Q water pudication system (Millipore
Corp., Bedford, MA) before use.
zyxwvutsrqponmlkjihgfedcbaZYXWVUTSRQPONMLKJIHGFEDCBA
All
solvent mixtures are specified as volume/volume ratios. PAC standards from Aldrich (Milwau-kee, WI), Supelco (Oakville, Canada), and Anachemia (Montreal, Canada) were used without further purification.
A sample prepared by dichloromethane Soxhlet extraction of
carbon black was received as a
zyxwvutsrqponmlkjihgfedcbaZYXWVUTSRQPONMLKJIHGFEDCBA
gift from Dr. J. Fetzer of Chevron Oil, This sample was redissolved in dichloromethane and filteredbefore use in
LC
experiments. A complex mixture of PACs from coal tar, standard reference material (SRM) 1597, and a standard solution of 16 priority pollutant PAHs in acetonitrile, SRM 1647, were purchased from the US. NIST (Gaithersburg, MD). A solution containing 21 perdeuterated PACs, DPAG1, developed7 by the Marine Analytical Chemistry Standards Program (MACSP) of the National Research Council (NRC) of Canada, was used as an internal standard solution for quantification experiments.For purposes of quantitication using internal standards, the DPAC-1 standard solution was spiked at four different levels into
(5) Quilliam, M. A,; Sim, P.
zyxwvutsrqponmlkjihgfedcbaZYXWVUTSRQPONMLKJIHGFEDCBA
G./. Chromatogr. Sci. 1988, 26, 160-167.zyxwvutsrqponmlkjihgfedcbaZYXWVUTSRQPONMLKJIHGFEDCBA
(6) Perreault, H.; Ramaley, L.; Sim, P. G.; Benoit, F. M. Rapid Commun. Mass
Spectrom. 1991, 5, 604-610.
(7) Quilliam, M. A; Hardstaff, W. R; Anacleto, J. F.; LeBlanc, M. D.; Ster- giopoulos, V.; Dick, K. L.; Bowser, M. T.; Curtis, J. M.; Embree, D. J.; Sim,
P. G.; Boyd, R. K. Fresenius]. Anal. Chem. 1994, 350, 109-118.
the NIST SRM 1647 PAH mixture, in ratios of 1:1, 1:5, l:lO, and
1:15 (v/v). The
zyxwvutsrqponmlkjihgfedcbaZYXWVUTSRQPONMLKJIHGFEDCBA
exact amounts of the two solutions mixed were determined by weighings using a 5-place digital balance. TheDPAGl solution was designed to have ratios of analyte concentra- tions similar to those found in environmental samples: but all 16 analytes in the SRM 1647 solution are at roughly the same concentration. The four spike ratios were therefore chosen to ensure that the concentration ratio of each native and perdeuter- ated PAH pair was approximately 1:l in at least one of the mixed solutions. The DPAC-1 internal standard solution was also spiked into the NIST SRM 1597 coal tar mixture in a ratio of 3:l (v/v). This spike ratio ensured that most of the analyte/internal standard concentration ratios fell within the ranges covered by the DPAC- l/SRM 1647 solutions.
Safety. Since many polycyclic aromatic compounds are mutagenic and carcinogenic, they must be handled with care. Acetonitrile and dichloromethane are toxic, volatile solvents that should be handled in a fume hood.
AU
of these substances are harmful if swallowed, inhaled, or absorbed through the skin.Liquid Chromatography /Mass Spectrometry. All analyses were performed using a 25 cm x 2.1 mm i.d. column packed with 5 pm Vydac 201TP octadecylsilica (Separations Group, Hesperia, CA) and an HP 1090M chromatograph (Hewlett-Packard, Palo Alto, CA) equipped with a variable volume injector/autosampler, a DR5 ternary solvent delivery system, a built-in diode array detector, and an HP7994A data system.
A mobile phase flow rate of 0.2 mL min-' was used. Separa- tions were performed with three different gradient programs: (A)
Starting with 100% acetonitrile and held for 15 min, and then linearly programmed to 100% dichloromethane over 40 min and held for a further 15 min. This binary gradient was used in early work on the MB interface; it sacrificed chromatographic resolution of the early-eluting PACs but provided good resolution of the higher molecular weight components without excessive retention times and avoided the use of water, which proved troublesome for the routine use of the MB interface using gradient elution.
(B) Starting with 4060 water/acetonitrile, linearly programmed to 100% acetonitrile over 30 min, held 5 min, and then linearly programmed over 40 min to 100% dichloromethane, with a subsequent 25 min hold prior to recycling the column. This ternary gradient was used for the analysis of the carbon black
extract using the PB and HNP interfaces. (C) Starting with 40:
zyxwvutsrqponmlkjihgfedcbaZYXWVUTSRQPONMLKJIHGFEDCBA
60 water/acetonitrile, linearly programmed to 100% acetonitrile over 30 min, held for an additional 30 min before being pro- grammed back to the initial conditions over 5 min. This binary gradient was used for the coal tar SRM with the PB and HNP interfaces.
The MB interface experiments were conducted using a VG Organic 2@250 quadrupole mass spectrometer (Fisons Instru- ments, Altrincham, U.K) equipped with a VG MB LC/MS interface. A VG spray deposition device was used to deposit the
LC
effluent on to the moving polyimide belt while simultaneously evaporating some of the mobile phase. The belt speed was maintained at 1.6 cm/s, and a post-ion source isopropyl alcohol belt wash was employed to avoid memory effects. The electron ionization source was operated at 250 "C, and the belt heater at the tip of the interface, which protrudes into the ion source, was operated with a supply voltage of 0.8 V (belt surface temperature unknown). By adjustment of the intermediate pumping stages, the instrument could be operated at an indicated pressure readingof 1.5
zyxwvutsrqponmlkjihgfedcbaZYXWVUTSRQPONMLKJIHGFEDCBA
x Torr (read from the ion gauge located on the source housing). This corresponds to pressure conditions inside the E1source such that chemical ionization occurs to only a negligible extent. The nominal electron energy was 70 eV, with a trap
current of 100
zyxwvutsrqponmlkjihgfedcbaZYXWVUTSRQPONMLKJIHGFEDCBA
pk A VG 11-250 data system was used for instrument control and for data acquisition and processing. Massspectra were acquired over a range m/z
zyxwvutsrqponmlkjihgfedcbaZYXWVUTSRQPONMLKJIHGFEDCBA
150-600 with a scan cycle time of 3 s.LC/MS analyses with a PB interface were performed using a Hewlett-Packard instrument comprising a Model 59980A particle beam interface and a Model 5988A quadrupole mass spectrometer. A detailed description of this PB interface can be found else-
here.^,^ Ultrahigh purity helium (Liquid Carbonic, Scarborough, Canada) was used as the nebulizing gas at a flow rate of -1.5 L/min. The temperature of the desolvation chamber was main- tained at 45 "C. E1 spectra were obtained using a nominal electron energy of 70 eV, with a source temperature of 250 "C. Mass spectra were acquired over a range of m/z 100-500, with a scan cycle time of 3 s. Selected ion recording experiments on the NIST- SRM/DPAC-1 quantitation solutions monitored a total of 24 ions in three acquisition periods (8 ions/period, 1 s total cycle time): first retention time period, 0-9.8 min; second period, 9.8-33.5 min; and the last period, 33.5-60 min.
LC/MS analyses with a HPN interface and APCI were performed using an API I11 triple quadrupole mass spectrometer (SCIEX, Concord, Canada) equipped with an atmospheric pressure ionization (API) source. A detailed description of the HPN interface can be found elsewhere.'O The corona discharge electrode current was maintained at 3 and high-purity air was used as the nebulizing gas at a flow rate of 1.2 Wmin. Full scan mass spectra were acquired over a range of m/z 100-500, with total scan cycle times between 2 and 3 s. A Macintosh IIx computer was used for instrument control, data acquisition, and processing. Selected ion recording experiments on the mixed NIST-SRM/DPAC-1 quantitation solutions monitored a total of 48
ions
zyxwvutsrqponmlkjihgfedcbaZYXWVUTSRQPONMLKJIHGFEDCBA
(Mot and MH+) inzyxwvutsrqponmlkjihgfedcbaZYXWVUTSRQPONMLKJIHGFEDCBA
six acquisition periods (8 ions/period, 1s total cycle time): first period, 0-8.8 min; second period, 8.8- 10.5 min; third period, 10.5-18 min; fourth period, 18-33.4 min; f3th period, 33.4-46 min; and the last period, 46-60 min.
RESULTS AND DISCUSSION
Qualitative Analysis. The objective of this part of the work
was to compare the more common LC/MS interfaces with respect to their suitability for analysis of the PACs of higher molecular weight, which are not amenable to GC/MS. Carbon black is a suitable test sample in this context, since it has been shownll that
high molecular weight PACs
zyxwvutsrqponmlkjihgfedcbaZYXWVUTSRQPONMLKJIHGFEDCBA
can be extracted from such materials. In our hands, the thermospray interface provided no usefulinformation on PACs and was not investigated further. The electrospray method has been shown by Van Berkel et al.12J3 to be capable of forming molecular radical cations of PACs, using
(8) Willoughby, R C.; Browner, R F. Anal. Chem. 1984, 56,
zyxwvutsrqponmlkjihgfedcbaZYXWVUTSRQPONMLKJIHGFEDCBA
2626-2631.(9) Winkler, P. C.; Perkins, D. P.; Williams, W. IC; Browner, R F. Anal. Chem.
(10) Anacleto, J. F.; Boyd, R K.; Pleasance, S.; Quilliam, M. A; Howard, J. B.;
Latleur. A L.; Makarovsky, Y. Can. J
zyxwvutsrqponmlkjihgfedcbaZYXWVUTSRQPONMLKJIHGFEDCBA
Chem. 1992, 70, 2558-2568.(11) Peaden, P. A; Lee, M. L.; Hirata, Y.; Novotny, M. Anal. Chem. 1980, 52,
(12) Van Berkel, G. J.; McLuckey, S. A; Glish, G. L. Anal. Chem. 1991, 63,
(13) Van Berkel, G. J.; McLuckey, S. A; Glish, G. L. Anal. Chem. 1992, 64,
1988, 60, 489-493. 2268-2271.
2064-2068.
1586- 1593.
either charge-transfer complex formation with a suitable electron acceptor or electrochemical oxidation. However, success was
strongly dependent on a correct choice of solvent (generally dichloromethane with 0.1% trifluoroacetic acid1*J3), which is
incompatible with gradient elution to achieve efficient
LC
zyxwvutsrqponmlkjihgfedcbaZYXWVUTSRQPONMLKJIHGFEDCBA
separa- tions. Moreover, at least in our hands, as applied to both fullerenederivatives and PACs,14 these electrospray techniques for PACs are neither suf6ciently robust nor sensitive at present to provide a useful quantitative analytical method for environmental samples. Accordingly, only the MB, PB, and HPN interfaces were investi- gated further in the present work.
An early demonstration of LC/MS analysis of a liquefied coal product15 used a MB interface to confirm identities of the LC peaks. A careful study of the effects of operating parameters on both the LC and MS performance16 used PAC standards as the test compounds. Analyte volatility was to have an effect on both the accuracy and the precision of LC/MS determinations of PACs using the MB interface. More recent ~ o r k ~ - ~ from this laboratory has confirmed and extended these earlier findings. In particular, use of the MB interface to provide qualitative profiles of PACs with molecular weights up to 580 was demonstrated.6 The problem of assigning compound identities to chromatographic peaks was faced5 in the LC/MS analysis of a marine sediment for PACs. Even when a standard compound is found to provide a good retention time match, it is often difficult to eliminate the possibility that the unknown compound is another isomer. This is, of course, a problem for all LC/MS experiments, not only those using the MB interface. The examination of UV spectra in
conjunction with MS data (using the MB interface) was found5 to help significantly with the problem of peak identification.
The performance of the MB interface in LC/MS profiling of the carbon black extract was consistent with expectations based on past experience with this interface. The total ion current chromatogram (TIC) matched reasonably well the chromatogram obtained using UV detection at 254 nm b o t shown), except for
the early-eluting (more volatile) components. Because E1 was used, fragment ions from compounds of higher molecular weights, particularly alkylated aromatics, can be confused with molecular ions of lower mass compounds, and the complete mass spectra were essential for resolving this ambiguity. Analysis of such spectra indicated that almost all the peaks in the reconstructed ion chromatograms @ICs) represent signals from molecular ions of the PACs. Examples of such spectra and of the RICs can be found elsewhere.18 However, the performance for relatively involatile and low-abundance compounds of molecular weights up to 424 was gratifying. Note, however, that these LC/MS experi- ments with the MB interface used the simpler acetonitrile/ dichloromethane gradient A (see Experimental Section) since it is more difficult to operate the MB interface routinely with an aqueous gradient (isocratic elution can be handled relatively easily). Also, relatively poor sensitivity for volatile PACs of MW
< 200 Da was observed and ascribed to evaporative losses in the
(14) Anacleto, J. F.; Quilliam, M. A; Boyd, R IC; Howard, J. B.; Lafleur, A L.;
(15) Dark, W. A; McFadden, W. H.; Bradford, D. L.J Chromatogr. Sci. 1977,
(16) Hayes, M. J.; Lankmayer, E. P.; Vouros, P.; Karger, B. L.; McGuire, J. M. (17) Krost, IC J. Anal. Chem. 1985, 57, 763-765.
(18) Anacleto, J. F. Chromatographic-Mass Spectrometric Analysis of Polycyclic Aromatic Compounds. Ph.D. Thesis, Dalhousie University, Halifax, Canada, 1993.
Yadav, T. Rapid Commun. Mass Spectrom. 1993, 7, 229-234.
15, 454-460.
Anal. Chem. 1983, 55, 1745-1752.
250 v
5
200 N 2 +IzyxwvutsrqponmlkjihgfedcbaZYXWVUTSRQPONMLKJIHGFEDCBA
150 ;5: x loozyxwvutsrqponmlkjihgfedcbaZYXWVUTSRQPONMLKJIHGFEDCBA
1
50 m 5 2 0 1 1 1 / I 1 1 1 1 , I I 0 4 1 1 I I , 1, 111. O $.
0 20 40zyxwvutsrqponmlkjihgfedcbaZYXWVUTSRQPONMLKJIHGFEDCBA
60 80 100 Time (min)Figure 1. LC analyses of a carbon black extract, using the ternary
gradient B (see Experimental Section). (a) UV detection, 236-500 nm; (b) LC/MS total ion chromatogram obtained using the PB interface with El; (c) LC/MS total ion chromatogram obtained using the HPN interface with APCI. Mass spectrometer scanning parameters are described in the Experimental Section.
interface. Another problem for the MB interface at lower
zyxwvutsrqponmlkjihgfedcbaZYXWVUTSRQPONMLKJIHGFEDCBA
m/z values is the background signal derived from the polyimide belt.The most intense peaks in this background, at m/z
zyxwvutsrqponmlkjihgfedcbaZYXWVUTSRQPONMLKJIHGFEDCBA
values of 113, 149, and 167, are readily removed by background subtraction anddo not interfere with analyses of common PACs.
The performance of the PB and HPN interfaces in analysis of the same carbon black extract was evaluated using the aqueous acetonitrile/dichloromethane gradient B described in the Experi- mental Section. Figure l a presents the LCIUV chromatogram
obtained using a diode array detector with a broad bandwidth
setting (368
zyxwvutsrqponmlkjihgfedcbaZYXWVUTSRQPONMLKJIHGFEDCBA
f 132 nm) detect all PACs. Figure lb,c shows the TICS resulting from the LC/MS analyses using the PB and HPNinterfaces, respectively. Even at this level of comparison, the HPN
interface appears to provide superior performance in that the TIC obtained using this interface (Figure IC) closely matches the
LC/
UV chromatogram (Figure la), whereas the TIC from the PI3 interface (Figure lb) provides good response only for the middle- range PACs. The nature of this disappointing performance of the PB interface is made more clear in Figure 2, which shows selected
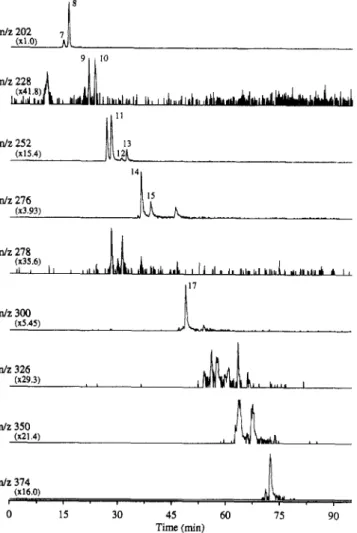
RICs from this LC/MS analysis. No useful data were obtained below m/z 200 or above m/z 374. The poor performance of the PB interface for the more volatile PACs resembles that of the MB interface, while the difference in performance of these two interfaces for the larger PACs is probably due to the low volatility of these compounds. Thus, samples forming a thin layer on a moving belt are more readily volatilized as a consequence of the
1"
14 m/z 276 (X3.93)J\
dz 374 0 15 30 45 60 75 90 Time (min)Figure 2. Reconstructed ion chromatograms for Me+ ions of PACs,
from the same LC/MS analysis of the carbon black extract using the PB interface which was reported as a TIC in Figure l b . Peak annotations correspond to numbering of analytes in Table 1.
benefits of flash heating (by the nose heater in this case), as described by Beuhler et al.19 and by Daves.2O The PB interface, on the other hand, requires that small particles of analyte in the beam must strike the back surface of the ion source and be heated quickly enough to vaporize before the next-eluting analyte physi- cally covers the first. Attempts to improve the heat transfer rate, by raising the PB ion source temperature to 300 from 250 "C,
resulted in only modest gains in sensitivity.
However, in those cases for which a good response was obtained, the E1 mass spectra obtained using the PB interface (e.g., Figure 3a,b) showed much less low-mass background (m/z
< 150) than did the corresponding spectra obtained using the
MB interface.I8 These relatively simple spectra can be readily matched with those contained in mass spectral libraries, although this is of questionable benefit for positive confirmations because most sets of PAC isomers produce identical E1 mass ~ p e c t r a . ~ In addition, most alkylated PACs undergo fragmentation under E1 conditions. PACs with longer alkyl chains (> C3) usually produce
low-intensity molecular ions. In such cases, the E1 fragmentation pattern will indicate that the compound is alkylated, but the molecular weight may not be easily determined.
Positive ion APCI spectra of PACs are dominated by singly ionized molecules with no fragmentation and have a high
(19) Beuhler. R J.; Flanigan, E.: Greene, L. J.; Friedman, L. j . Am. Chem. SOC.
(20) Daves, G. D., Jr. Acc. Chem. Res. 1979, 12, 359-365.
1974, 96, 3990-3999.
loo
zyxwvutsrqponmlkjihgfedcbaZYXWVUTSRQPONMLKJIHGFEDCBA
1
a)zyxwvutsrqponmlkjihgfedcbaZYXWVUTSRQPONMLKJIHGFEDCBA
EI 252zyxwvutsrqponmlkjihgfedcbaZYXWVUTSRQPONMLKJIHGFEDCBA
M+.I
508
25zyxwvutsrqponmlkjihgfedcbaZYXWVUTSRQPONMLKJIHGFEDCBA
0 .- B O 508
25 0 .- B O Y .23
15zyxwvutsrqponmlkjihgfedcbaZYXWVUTSRQPONMLKJIHGFEDCBA
50$
100d
218 M+' 25 0 100 150 250 300 253 MH* 2 0 0 d Z M+' 75 rJ 3.$
1
d) APCI 5 15 cr; 25501
219 MH+ M+' \I
0 4 Ill, ., I , 100 150 250 300Figure 3. Background subtracted El (a, b, PB interface) and APCI
(c, d, HPN interface) mass spectra of benzo[a]pyrene (a, c) and dibenz[a,h]anthracene (b, d). Mass spectrometer conditions are described in the Experimental Section.
" d Z
background at m/z < 250, which is, however, of constant or slowly varying intensity and can readily be accounted for by background subtraction. The details of the spectra depend upon the composi- tion of the atmosphere in the ion source. The competing ionization mechanismsz1 are proton transfer from protonated water
clusters and electron transfer to species such as Nft,
zyxwvutsrqponmlkjihgfedcbaZYXWVUTSRQPONMLKJIHGFEDCBA
Of+,
and possibly NO+, to form MHt and M t ions, respectively (e.g.,Figure 3c,d). The relative importance of the two mechanisms varies with the partial pressure of water vapor withii the plasma created by the corona discharge and can be controlled by doping the ion source with water or benzene vapor, as demonstratedz2 for PAC analysis by supercritical fluid chromatography using APCI mass spectrometry. In general, ionization by protonation was observed to increasingly dominate the electron transfer mecha- nism as the size of the PACs increased. These trends were contimed in the LC/MS work reported here, but since ion source doping did not appear to offer any significant advantage, it was not used further in the present work. Some preliminary experi- men@ on negative ion APCI of PAC standards yielded complex mass spectra (not shown) dominated by (M
+
15)- and (M+
31)- ions, with other higher mass species formed by ion-molecule
(21) French, J. B.; Davidson, W. R; Reid, N. M.; Buckley, J. A. In Tandem Mass
zyxwvutsrqponmlkjihgfedcbaZYXWVUTSRQPONMLKJIHGFEDCBA
Spectrometty; McLafferty, F. W., Ed.; Wiley-Interscience: New York, NY,
(22) Anacleto, J. F.; Ramaley, L.; Boyd, R K ; Pleasance, S.; Quilliam, M. A;
Sim, P. G.; Benoit, F. M. Rapid Commun. Mass Spectrom. 1991, 5, 149- 155. 1983; pp 353-370. m/z 253 (~1.36) I,,
h"
1
1"
ndz 301 (x1.46) mlz 321 (~1.63) mlz 375 Ib
dz451 (~42.5) 20 40zyxwvutsrqponmlkjihgfedcbaZYXWVUTSRQPONMLKJIHGFEDCBA
60 80 I 0 0 Time (min)Figure 4. Reconstructed ion chromatograms, from the LClMS
analysis of the carbon black extract using the HPN interface reported as a TIC in Figure 1 c. The m/'values labeling the RlCs are those for the MH+ ions, since these dominate the M'+ ions for these larger PACs. Peak annotations correspond to numbering of analytes in Table 1.
reactions with the oxide and superoxide anions, which are the main negatively charged constituents of the APCI plasma.2l These spectra were not very reproducible, in accord with general conclusions about negative ion chemical ionization in the presence of water and oxygen,23 and this approach was not pursued further. The performance of the HPN interface in LC/MS analysis of the higher molecular weight PACs in carbon black is illustrated in Figure 4 (the performance of this interface for the smaller PACs is described in the following section). Excellent signal-to-noise ratios are observed for all components observable in the LC/W
chromatogram out to 100 min retention time (Figure la). That Figure 4 does not represent an upper limit to the capabilities of the HPN interface, in analysis of large PACs, is suggested by the results of a similar analysis of carbon clusters extracted from a commercial fullerene so0t.2~ Compounds up to Clog (MW 1296) were clearly and, while fullerenes are not expected to behave in a fashion entirely identical to that of PACs, this evidence suggests that the upper mass limit evident in Figure 4 reflects the composition of the carbon black extract rather than limitations of the HPN interface. This conclusion is also supported by a comparison of Figure 1 parts a and c, which suggests that all components of the carbon black extract which responded to the W detector were also detected by the mass spectrometer when the HPN interface was used.
(23) StGckl, D.; Budzikiewicz, H. Org. M a s Spectrom. 1982, 17, 470-474.
(24) Anacleto, J. F.; Boyd, R IC; Quilliam, M. A. J. High Resolut. Chromatog?. 1993, 16, 85-89.
It is important to understand the physicochemical origins of this remarkable performance of a device in which the gas
temperature reaches no more than 120 “C or
zyxwvutsrqponmlkjihgfedcbaZYXWVUTSRQPONMLKJIHGFEDCBA
so. It seems likely that the key phenomenon is the well-known increase of vaporpressure P over the bulk value
Po
zyxwvutsrqponmlkjihgfedcbaZYXWVUTSRQPONMLKJIHGFEDCBA
as the sample size is decreased below micrometer dimensions. The quantitative expression of thisphenomenon is given by the Kelvin
ln(P/Po) = XMy/rdRT
zyxwvutsrqponmlkjihgfedcbaZYXWVUTSRQPONMLKJIHGFEDCBA
where
zyxwvutsrqponmlkjihgfedcbaZYXWVUTSRQPONMLKJIHGFEDCBA
M is the molar mass,zyxwvutsrqponmlkjihgfedcbaZYXWVUTSRQPONMLKJIHGFEDCBA
y the surface energy per unit area,zyxwvutsrqponmlkjihgfedcbaZYXWVUTSRQPONMLKJIHGFEDCBA
Ythe droplet radius, and d the density. For liquids, the effect is not appreciable until r falls below about cm. However, if the
initial nebulization of the
zyxwvutsrqponmlkjihgfedcbaZYXWVUTSRQPONMLKJIHGFEDCBA
LC
eluate produces droplets of microme- ter dimensions (W4zyxwvutsrqponmlkjihgfedcbaZYXWVUTSRQPONMLKJIHGFEDCBA
cm), subsequent evaporation of solvent will leave dry particles of radius no larger than cm for initialconcentrations typical of LC/MS experiments. Moreover, the surface energies of solids are appreciably larger than those of liquids, so the ratio
P/P,
can be considerably greater than unity. Although the Kelvin equation deals with an equilibrium situation, while evaporation rates are likely important in the HPN interface, it seems likely that the same parameters controlling the thermo- dynamics will also control the rate. This explanation can account, at least qualitatively, for the ability of the HPN interface to facilitate acquisition of APCI mass spectra of (sometimes labile) compounds which do not vaporize from the bulk solid.28The present comparison of the three LC/MS interfaces for qualitative profiling of PACs of higher molecular weights has confirmed the utility of the MB interface in this regard, although with notable restrictions on compatible
LC
mobile phases. The PB interface has no such mobile phase restrictions and provides a better MS background, but it provides very poor response forPACs larger than about 380 Da and less than
zyxwvutsrqponmlkjihgfedcbaZYXWVUTSRQPONMLKJIHGFEDCBA
200 Da. The HPN interface provided the best performance with respect to bothLC
compatibility and mass spectrometric response to the full range of PACs present in the carbon black extract. The APCI mass spectra provided by the HPN interface contain only ions derived from intact molecules, while the E1 spectra from the MB and PB interfaces contain more information and are suitable for compari- sons with library spectra. However, as discussed above, this advantage is of limited practical importance for PAC analysis.
Quantitative Analysis: Standard Calibrations. In previous work from this laboratory, the MB interface was used for the quantitative analysis by LC/MS of PACs in marine sediment^.^^^
For most of the target PACs (300 Da or less), the precision obtained using the MB interface was comparable to that obtained by GC/MS for both external calibration and internal standardiza-
tion techniques. However, the precision for naphthalene using
the MB interface was -50% relative standard deviation: thus clearly illustrating the dficulty in analyzing volatile compounds when using this interface.
In view of both the previous do~umentation~~~ of LC/MS quantification of PACs using the MB interface and also of the mobile phase compatibility limitations of this interface, which in
(25) Thomson, W. Phil. Mag. 1871, 42, 448.
(26) Moore, W. J. Physical Chemistry, 4th Ed; Prentice Hall: Englewood Cliffs, (27) Wilemski, G. J. Chem. Phys. 1995, 103, 1119.
(28) Burlingame, A. L.; Boyd, R
zyxwvutsrqponmlkjihgfedcbaZYXWVUTSRQPONMLKJIHGFEDCBA
IC; Gaskell. S. J. Anal. Chem. l 9 9 4 , 6 6 , 6 3 4 R -NJ, 1972; pp 481-482. 683R.
turn limit the isomer separation selectivity (which is one of the major advantages of LC/MS for PAC analysis), only a few confirmatory experiments were conducted in the present work. For example, the performance for coronene (m/z 300) using single ion monitoring (SIM) was excellent, with respect to both instru- mental limits of quantification (25 pg) and linear range (2.5 orders of magnitude demonstrated, but probably larger), and was typical of most of the larger PACs studied. The performance for carbazole (dibenzopyrrole), on the other hand, was much worse, with a SIM limit of quantification of 2 ng and a linear range up to about 300 ng with a marked fall-off from linearity above this value. The much lower sensitivity and deviation from linearity at higher sample loadings probably arise from less efficient desorption of the more polar carbazole molecules from the surface of the belt.
The use of the PB interface for quantitative analyses has been seriously hampered because of the nonlinear calibration curves it often produces. Several groups have reported quadratic responses, with slopes increasing with increasing concentration, for a number of analyte~.*~-~l It has been suggested30 that this nonlinear behavior is related to the amount of analyte in a particle and its transmission through the interface. Analyte transport efficiencies are generally less than 10% for most compounds in the particle beam interface.32 Losses occur primarily in the momentum separator because of particle sedimentation, turbu- lence, and misalignment of nozzles and skimmer cones.g Sedi- mentation and turbulence losses are directly related to the size of analyte particles, which in turn is a function of analyte concentrationg and the diameter of the nebulizer tip.32 Thus, the nonlinear curves are a result of small particles, produced at low analyte concentrations, which are more prone to turbulent losses. More efficient mass transport occurs at higher concentrations as the particle size increases.
The calibration curves obtained for two PAC standards, shown in Figure 5a,b, can be fitted to quadratic equations. Recent r e p o r t ~ ~ ~ , ~ ~ have claimed that, with the exception of benz[al- anthracene and chrysene, several PAC standards exhibited linear response behavior over the range of 20-1000 ng. The expansion of the low-mass regions of the two curves (insets, Figure 5a,b) clearly shows that the curve for benzo[a]pyrene is nonlinear throughout the entire concentration range, although that for dibenz[a,h] anthracene reveals acceptably linear behavior (dashed line) below 300 ng injected on-column. Above this level, the calibration curve exhibits the convex downward appearance characteristic of the PB interface. Although nonlinear response does not preclude the use of an instrumental method in quantita- tive analysis, it does increase the calibration requirements and necessitates interpolation from multipoint calibration curves. As an alternative in the case of the PB interface, the linearization of calibration curves through the use of the “carrier effect” (Le.,, use of mobile phase additives) has been ~uggested.3~ Subsequent
~~
(29) Brown, F. R; Draper, W. M. Biol. Mass Spectrom. 1991, 20, 515-521. (30) Ho, J. S.; Behymer, T. D.; Budde, W. L.; Bellar. T. A. J. Am. SOC. Mass (31) Doerge, D. R; Burger, M. W.; Bajic, S. Anal. Chem. 1992,64,1212-1216. (32) Browner, R. F.; Winkler, P. C.; Perkins, D. D.; Abbey, L. E. Microchem. j.
(33) Roby, M. R; Pace, C. M.; Betowski, L. D.; Marsden, P. J. Proceedings ofthe 38th ASMS Conference on Mass Spectrometlty and Allied Topics; Tucson,
AZ, June 3-8, 1990; pp 625-626. Spectrom. 1992, 3, 662-671. 1986, 34, 15-24.
(34) Pace, C. M.; Betowski, L. D. J. Am. SOC. Mass Spectrom. 1995, 6, 597. (35) Bellar, T. A; Behymer, T. D.; Budde, W. L.I. Am. SOC. M u s Spectrom. 1990,
1. 92-98.
0.00
zyxwvutsrqponmlkjihgfedcbaZYXWVUTSRQPONMLKJIHGFEDCBA
c
0
zyxwvutsrqponmlkjihgfedcbaZYXWVUTSRQPONMLKJIHGFEDCBA
100zyxwvutsrqponmlkjihgfedcbaZYXWVUTSRQPONMLKJIHGFEDCBA
200zyxwvutsrqponmlkjihgfedcbaZYXWVUTSRQPONMLKJIHGFEDCBA
300 400 500 600zyxwvutsrqponmlkjihgfedcbaZYXWVUTSRQPONMLKJIHGFEDCBA
700 800 900Amount Injected
zyxwvutsrqponmlkjihgfedcbaZYXWVUTSRQPONMLKJIHGFEDCBA
(ng)P
/ '
4.0
4
0 10 20 30/
0
zyxwvutsrqponmlkjihgfedcbaZYXWVUTSRQPONMLKJIHGFEDCBA
50 100 150zyxwvutsrqponmlkjihgfedcbaZYXWVUTSRQPONMLKJIHGFEDCBA
200 250 300Amount Injected (ng)
Figure 5. LC/MS calibration curves obtained for benzo[a]pyrene (a, c) and dibenz[a,h]anthracene (b, d) using the particle beam (a, b) and heated pneumatic nebulizer (c, d) interfaces.
measurements, however, indicated that this technique is limited to very few compounds and that nonlinear behavior was still prevalent30 The presence of unexpected coeluting substances in real-world samples can also cause calibration errors and analytical bias. The detector signal given by target analytes has been shown to increase with coeluting matrix ~onstituents.2~ Presumably, particle size discrimination in the momentum separator, with its influence on transport efficiency, is also the basis of this phenom- enon.
Instrumental detection limits for the PB interface, determined on the basis of the smallest sample size which yielded a signal- to-noise ratio of at least 3:1, were 3-4 ng injected oncolumn for
benzo[alpyrene and dibenz[a,hlanthracene. Previous ~ t u d i e s ~ ~ q ~ ~ of PAC standards using a PB interface also reported detection limits in the low nanogram range. These limits are by no means universal for all PACs; however, the more volatile low molecular weight PACs are more susceptible to losses in the PB interface, thus giving rise to much higher limits of detection and of quantification. This point will be further illustrated below.
The calibration curves obtained for the same two PAH standards using the HPN interface with APCI by monitoring MH+ ions, are shown in Figure 5c,d. The insets show that the curves are linear down to the lowest concentrations analyzed. Such
curves are typical of all the PACs examined thus
zyxwvutsrqponmlkjihgfedcbaZYXWVUTSRQPONMLKJIHGFEDCBA
far using the HPN interface. The dynamic ranges found here are similar tothose commonly reported in the l i t e r a t u ~ - e , ~ ~ ~ ~ ~ i.e., at most three decades (103). There are several possible explanations for this narrow linear dynamic range. The most likely involves a depletion of APCI reagent ions when high levels of analyte are present, i.e., saturation of the APCI ionizing power. Other possible explana- tions involve saturation of the pulsecounting ion detection system incorporated in the instrument used for the HPN work.
Instrumental detection limits for the HPN interface, determined on the basis of the smallest amount of analyte which yielded a signal-to-noise ratio of at least 3:1, were 275 and 85 pg for benzo- [alpyrene and dibenz[a,hlanthracene, respectively. These detec- tion limits are considerably lower than those of the particle beam interface (between 1 and 4 ng). The difference of a factor of 3 between the values obtained for these two compounds is dficult to explain in terms of gaseous ion properties, since the two ionization energies are very close38 (7.12 & 0.01 and 7.38
*
0.04 eV, respectively) and, using the correlations of M e ~ t - N e r , ~ ~ the corresponding proton affinities are estimated to be 900 and 870kJ
mol-'. These values are sufficiently close that it seems reasonable that the ratios of intensities of M + and MH+ ions should be about the same for these two PAHs, as was observed in Figure 3c,d. It is also difficult to account for this difference in sensitivities in terms of information on the vapor pressures of the two solid PAHS.~O-~~Quantitative Analysis of the NIST Certified Reference Material SRM 1597. The NIST reference material SRM 1597 is a natural complex mixture of PACs isolated from coal tar, certified for concentrations of 12 PAHs ranging from naphthalene (128 Da) to benzolghilperylene (276 Da). The preparation and certification of this reference material have been described by Wise et a1.43 Information values for a further 18 PACs (including some PAHs) are also supplied in the NIST certiiication docu- ment,& and more recently an information value for the concentra- tion of dibenzIa,h]anthracene was published.45 This well- characterized material was chosen as a suitable test case for LC/ MS analyses.
The present experiments, designed to obtain calibration curves for quantification by external standardization exemplied by Figure 5, indicated that use of internal standards would be mandatory for the PB interface. Particle beam MS has also been shown to be susceptible to tremendous fluctuations in absolute response during intra- and interday For example, instru- ment response factors for chlorinated phenoxy acid standards varied as much as 2-fold over a 24 h period.47 This presents another signscant obstacle when using an external calibration.
(36) Gilbert, J. D.; Hand, E. L.; Yuan, A. S.; Olah, T. V.; Covey, T. R. Bid. Mass
(37) Fouda, H.; Nocerini, M.; Schneider, R; Gedutis, C.J. Am. SOC. Mass Spectrom.
(38) Lias, S. G.; Bartmess, J. E.; Liebman, J. F.; Holmes, J. L; Levin, R D.; Mallard,
W. G. Gas Phase Ion and Neutral Thermochemistry. J. Phys. Chem. Rej
Data 1988, 17, Suppl. 1.
Spectrom. 1992, 21, 63-68.
1991,2, 164-167.
(39) Meot-Ner, M. J Phys. Chem. 1980, 84, 2716-2723.
(40) Wakayama, N.; Inokuchi. H. Bull. Chem. Sot. Jpn. 1967, 40, 2267-2271. (41) Murray, J. J.; Pottie, R F.; Pupp, C. Can. /. Chem. 1974, 52, 557-563.
(42) White, C. M. J. Chem. Eng. Data 1986, 31. 198-203.
(43) Wise, S. A; Benner, B. A; Byrd, G. D.; Chesler, S. N.; Rebbert, R E.; Schantz. (44) US. National Institute of Standards and Technology, SRM 1597 Certificate (45) Wise, S. A; Deissler, A; Sander, L. C . Polycyclic Aromat. Compd. 1993,3,
(46) Brown, M. A; Stephens, R D.; Kim, I. S. Trends Anal. Chem. 1991, 10, M. M. Anal. Chem. 1988, 60,887-894.
of Analysis, 1987. 169-184. 330-336.
The obvious solution is through use of internal standards, especially isotopically labeled internal standards, which exhibit chemical behavior almost identical to that of the native substances but are readily differentiated by their mass spectra. If internal standards are chromatographically resolved from the target analytes (which is true for perdeuterated PACs), different matrix effects can still cause calibration errors through coelution of a matrix constituent with either the internal standard or the anal~te.~g The only reliable means to guarantee no selective enhancement of either the internal standard or the analyte, when using the PB interface, is through the use of coeluting isotopically labeled standards, e.g., I3C-labeled standards which are, however, of limited availability and are expensive.
Experiments were conducted to determine whether perdeu- terated PAC internal standards (chromatographically resolved from their native perprotonated counterparts) can be used to quantify PACs in a complex sample. A mixture of perdeuterated PAH standards @PAC-I) was spiked at four different levels into both a certified NIST PAH standard mixture (SRM 1647) and a
complex mixture of PACs from coal tar (SRM 1597).
zyxwvutsrqponmlkjihgfedcbaZYXWVUTSRQPONMLKJIHGFEDCBA
A total of24
zyxwvutsrqponmlkjihgfedcbaZYXWVUTSRQPONMLKJIHGFEDCBA
m/z values were monitored (17 PAHs including several setsof isomers, and appropriate perdeuterated PAHs) using LC/MS with the PB interface. A typical analysis of a SRM 1647/DPAC-l mixture (1O:l volume ratio) is shown as Figure 6. Only seven of the 17 target PAHs were detected (Figure 6, second acquisition period) and subsequently quantified. The lower molecular weight
PAHs
zyxwvutsrqponmlkjihgfedcbaZYXWVUTSRQPONMLKJIHGFEDCBA
(m/z 178 and lower), which were present in much higher concentrations than the other components (see Table l), wereamong the PAHs that were not detected (Figure 6, first acquisition period). These compounds were too volatile to be efficiently transported through the PB interface. The higher molecular weight PAHs (m/z 276 and higher), which were present in concentrations similar to those of the PAHs that were successfully quantified (see Table l), were also not detected (Figure 6, third acquisition period). These compounds are apparently insuf- ficiently volatile to vaporize efficiently in the hot ion source. These discrimination effects, which were also noted in the qualitative analysis of the carbon black extract (Figure 2), represent a severe
disadvantage of the PB interface.
Analysis of the same SRM 1647/DPAGl mixture (101 volume ratio), by LC/MS using the HPN interface with APCI, is shown in Figure 7. A total of 48 m/z values were monitored (both M + and MH+ ions of 17 PAHs, including several sets of isomers, and their perdeuterated counterparts). In contrast to the results obtained using the PB interface, all 16 of the target PAHs (and also coronene) were easily detected with excellent signal-to-noise
ratios and were subsequently quantified. The
LC
zyxwvutsrqponmlkjihgfedcbaZYXWVUTSRQPONMLKJIHGFEDCBA
peak observed in the SIM trace for m/z 302 (Figure 7) probably representsinterference from the
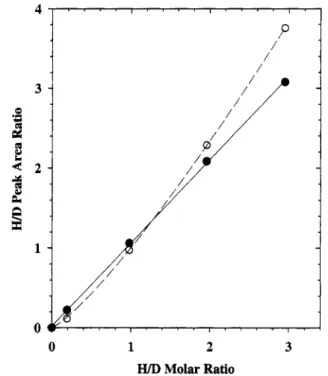
Calibration curves were generated using the data from the four mixed SRM 1647/DPAC-l solutions (raw data for only one mixture are shown in Figures 6 and 7). Plots of the protonated to deuterated PAH peak area ratios versus the known molar ratios (measured as SRM 1647/DPAC-l weight ratios) for benzo[b]- fluoranthene (BbF) are shown in Figure 8 for the PB and HPN interfaces. For all those PAHs that were detected with reasonable sensitivity using the PB interface (Figure 6), the calibration plots resembled that shown in Figure 8, in that they could be described
isotopomers of the coronene ions.
(47) Kim, I.
zyxwvutsrqponmlkjihgfedcbaZYXWVUTSRQPONMLKJIHGFEDCBA
S.; Sasinos, F. I.; Stephens, R.zyxwvutsrqponmlkjihgfedcbaZYXWVUTSRQPONMLKJIHGFEDCBA
D.; Wang, J.; Brown, M. A Anal.Chem. 1991, 63, 819-823.
zyxwvutsrqponmlkjihgfedcbaZYXWVUTSRQPONMLKJIHGFEDCBA
288I"
152 160 16 1 212 , w w A J 3 I , l \ 2 4 o - - - J u - 300 312 I l l 166 176 252 264 302 316 . . , . , . , . , . , . 0 10 20 30 40 50Flgure 6. Analysis of a SRM 1647/DPAC-l mixture (1O:l v/v) using particle beam LC/MS and ternary gradient C (see Experimental Section). A total of 24 m/zvalues were monitored in three acquisition
periods: period 1 (0-9.8 min), m/z 128, 136, 152, 160, 154, 164, 166, 176; period 2 (9.8-33.5 min), m/z178, 188,202,212,228, 240,
252,264; period 3 (33.5-60 min), m/z276,
zyxwvutsrqponmlkjihgfedcbaZYXWVUTSRQPONMLKJIHGFEDCBA
288, 278,292, 300, 312,302, 316. These d z values represent
zyxwvutsrqponmlkjihgfedcbaZYXWVUTSRQPONMLKJIHGFEDCBA
M'+ ions of PAHs and theirperdeuterated versions (peaks marked with an asterisk represent the perdeuterated PAH internal standards). See Table 1 for compound identities. The SIM chromatograms are labeled with their respective m/z values and are shown offset from one another vertically for the sake of clarity of presentation.
Time (min)
either as linear with non-zero intercepts or as quadratic curves including the origin. In either case, the nonideality can be interpreted in terms of lower transmission efficiencies for the native analyte than for its perdeuterated counterpart. Negative gintercepts for forced linear fits, such as that observed in Figure
8 for the PB interface, are usually interpreted in terms of
irreversible losses of analyte somewhere in the analytical In this instance, analyte losses are known to occur in the PB interface, but the dependence of these losses on total sample loading makes difficult any detailed interpretation.
The calibration curve obtained for BbF using the HPN LC/
MS interface with APCI in the analyses of the NIST 1647/DPAC-l mixtures is also shown in Figure 8. The linear regression curves for this, and for all the other target PAHs,~ did include the origin to within experimental error. Regression coefficients were mostly r0.99, although a few were not as high. For the best precision
_ _ _ _ _ ~ ~ (48) Boyd, R. K. Rapid Commun. Mass Spectrom. 1993, 7, 257-271.
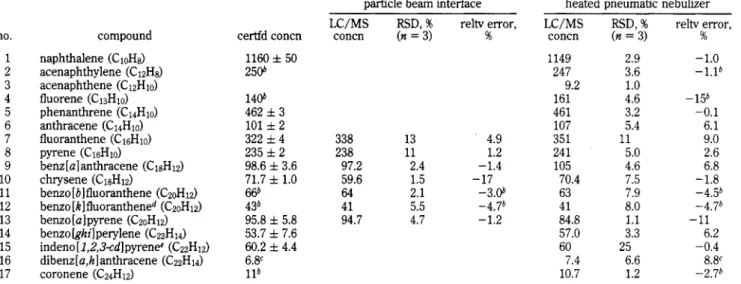
Table 1. Results of LCMS Analyses of a Coal Tar Reference Material (NIST SRM 1597) Compared wlth Certified and Information Values.
particle beam interface heated pneumatic nebulizer
no. 1 2 10 11 12 13 14 15 16 17 compound naphthalene (&Ha) acenaphthylene (C 12Hs) acenaphthene (C12Hlo) fluorene (C13H10) phenanthrene (C14H10) anthracene (C14H10) fluoranthene (C16H10) pyrene (C16H10) benz[alanthracene (ClgH12) chrysene (ClaH12) benzo[blfluoranthene (CzoHd
benzo[kl fluoranthened (C2oH12)
benzo[al~yrene (CzoHd benzo[ghilperyIene (C22H14) indeno [1,2,3-cdlpyrenee (C22H12) dibenz[a,h]anthracene (C22H14) coronene (C24H12) certfd concn 1160 f
zyxwvutsrqponmlkjihgfedcbaZYXWVUTSRQPONMLKJIHGFEDCBA
50 2506 1406 462 f 3 101 f 2 322 f 4 235 f 2 98.6 f 3.6 71.7 f 1.0 66‘ 436 95.8 f 5.8 53.7 f 7.6 60.2 f 4.4 6 8 116LC/MS RSD,
zyxwvutsrqponmlkjihgfedcbaZYXWVUTSRQPONMLKJIHGFEDCBA
% reltv error,concn (n = 3) % 338 13 4.9 238 11 1.2 97.2 2.4 -1.4 59.6 1.5 -17 64 2.1 -3.P 41 5.5 -4.7’ 94.7 4.7 -1.2 LC/MS concn 1149 247 161 461 107 351 241 105 70.4 63 41 84.8 57.0 60 7.4 10.7 9.2 RSD, % (n = 3) 2.9 3.6 1.0 4.6 3.2 5.4 5.0 4.6 7.5 7.9 8.0 1.1 3.3 6.6 1.2 11 25 reltv error, % -1.0 - 1 . l b -15’ -0.1 6.1 9.0 2.6 6.8 -1.8 -4.5b -4.7’ 6.2 -0.4 8AC -2.7’ -11
Concentrations in
zyxwvutsrqponmlkjihgfedcbaZYXWVUTSRQPONMLKJIHGFEDCBA
pg/g. Internal standards were the perdeuterated compounds (DPAC-17) except where noted. Values not certified by NIST;Value not certified by NIST; information value obtained by HPLC by Perdeuteriobenzo- information values reported by
[blfluoranthene was used as internal standard. e
zyxwvutsrqponmlkjihgfedcbaZYXWVUTSRQPONMLKJIHGFEDCBA
Perdeuteriobenzo[ghi]perylene was used as internal standard. and accuracy in quantitative analyses of this kind, multipointcalibrations and 1:1 concentration ratios (target analyte/intemal standard) should be used, but the highly linear calibration curves obtained using the HPN interface reduce the stringency of this requirement.
Calibration curves such as those illustrated in Figure 8 were used to determine PAH concentrations in the NIST
SRM
1597 coal tar extract, spiked with the DPAC-1 standard solution. Most of the values obtained using the HPN interface were reported previou~ly,~ though with less experimental detail, and are included here for comparison with the results obtained using the PB interface. Both sets of values, together with the NIST certifiedconcentration^^^ or information values, 44,45 are listed in Table 1
for those 15 compounds whose perdeuterated analogs are included in the DPAC-1 solution or for which closely eluting perdeuterated compounds in DPAC-1 can reasonably be used as internal standards. In addition, the concentration obtained for acenaph- thene (not covered by the NIST w0rk4~9~~) is included for information.
Except for fluoranthene and chrysene, the accuracies of the concentration values obtained using the PB interface are within acceptable limits. The low concentration obtained for chrysene appears to be a result of matrix components coeluting with its perdeuterated internal standard. A full-scan analysis of the coal
tar extract revealed the presence of components at m/z
zyxwvutsrqponmlkjihgfedcbaZYXWVUTSRQPONMLKJIHGFEDCBA
216 (either a benzofluorene or a methylpyrene isomer) and 226 (probablycyclopenta[cdlpyrene) whose retention times matched those of chrysene and its perdeuterated counterpart- The chromatographic peaks of the other PAHs which were quantified were also thoroughly examined, and except for perdeuteriobenzo [b] fluo- ranthene, they all appeared free from coeluting components. The perdeuteriobenzo [blfluoranthene peak was not completely re- solved from another PAH of molecular mass 252 Da (probably perylene), but not to an extent sufficient to significantly affect the result listed in Table 1. In the case of fluoranthene, another PAH isomer of molecular mass 202 Da appeared to coelute, as indicated by the observation that the front baseline of the
LC
peak wasslightly but significantly broadened. The NIST SRM 1597 certificate of analysisM does indicate the presence of a third isomer (acephenanthrylene) at a concentration (uncertified) of -60 pg/
g. An assumption that the present experiments measured the
sum of concentrations of fluoranthene plus this isomer, together with the probable PB transmission enhancement from the matrix effect, could account for the high fluoranthene concentration reported in Table 1.
The deviations of the concentrations measured by LC/MS using the HPN interface, from the certified values, were <7.0%, with the exception of those for fluorene, fluoranthene, and benzo-
[alpyrene, as discussed previou~ly.~ The partial coelution of another PAH isomer of molecular mass 202 Da (probably4 acephenanthrylene) with fluoranthene, and of an isomer of fluorene ( m h 166) in the coal tar solution, is believed to be the reason for the high values determined in the present work (Table 1). However, the
LC
peaks for both benzo[alpyrene and its perdeuterated analog were completely resolved from any interfer- ences. At this time, no explanation for this low measured concentration (Table 1) can be given.CONCLUSIONS
The present findings concerning the relative merits of the MB, PB, and HPN interfaces for LC/MS analyses of PACs appear to reflect some of the more general impressions of these three devices. The MB interface is mechanically awkward, does not permit routine use of gradient elution with aqueous mobile phases due to related variations in pumping and heating requirements in the solvent removal stages, shows poor transmission efficiencies for the more volatile PACs, and provides a significant mass spectrometric background. On the other hand, the MB interface provides good quality
E1
spectra for high molecular weight PACsnot amenable to GC/MS analysis and can also readily be used with chemical ionization, though this was not demonstrated here. Previous work from this laborat0ry49~ has demonstrated that, with some effort, acceptable quantification of the less volatile PACs in complex mixtures can be achieved using the MB interface.
11
i3
P
/ mi2 128+129 136+137 14. I 17 276+277+"
-
,[,"i
288+289 3ooC301 312+313 292+293 LJ 302+303 3 l6+3 I7 I 0 IO 20 30 40 50 60 Time (min)Figure 7. Analysis of a SRM 1647/DPAC-l mixture (1O:l v/v) using
the HPN LC/MS interface with APCI and ternary gradient C (see Experimental Section). A total of 48 ions (both M'+ and MH+ ions of target PAHs and their perdeuterated versions) were monitored in six
acquisition periods: period 1 (0-8.8 min),
zyxwvutsrqponmlkjihgfedcbaZYXWVUTSRQPONMLKJIHGFEDCBA
m/z 128+
129, 136+
137, 152
+
153, 160+
161; period 2 (8.8-10.5 min), m/z 154+
155, 164+
165, 166+
167, 176+
177; period 3 (10.5-18 min), m/z 178+
179, 188+
189, 202+
203, 212+
213; period 4 (18-33.4min),
zyxwvutsrqponmlkjihgfedcbaZYXWVUTSRQPONMLKJIHGFEDCBA
m/z 228+
229, 240+
241, 252+
253, 264+
265; period 5(33.4-46 min), m/z 276
+
277, 288+
289, 278+
279, 292+
293; period 6 (46-60 min), m/z300+
301, 312+
313, 302+
303, 316+
317. See Table 1 for compound identities. Peaks marked with an asterisk represent the perdeuterated PAH internal standards. For the sake of clarity of presentation, the SIM chromatograms are shown offset from one another vertically.The PB interface is compatible with aqueous mobile phases and provides E1 spectra with appreciably less background than does the MB interface. However, the PB interface exhibits poor transmission efficiencies for PACs of both low (<200) and high ('380) molecular weights. The highly nonlinear calibration curves and poor detection limits obtained using the PB interface, together with the marked carrier effects due to coeluting com- pounds, make the PB interface difticult to use reliably in quantita- tive PAC analyses, even when perdeuterated PAC internal standards are employed.
The HPN interface with APCI provided the best overall performance in the present work. This LC/MS interface is compatible with a wide range of mobile phase compositions, exhibits excellent transmission efficiencies and detection limits for both low and high molecular weight PACs, and provides excellent linearity of response. The main disadvantages of the HPN interface encountered in the present work were the lack of fragment ions and thus of structural information (though this feature is of limited importance for PACs, and in general,
3
1
//d
" 1 ' " ' " " ' I '
0 1 2 3
W D
Molar RatioFigure 8. Calibration curves for the analysis of benzo[b]fluoranthene
(BbF) using the PB (0) and HPN
zyxwvutsrqponmlkjihgfedcbaZYXWVUTSRQPONMLKJIHGFEDCBA
( 0 ) LC/MS interfaces and usingperdeuterio-BbF as an internal standard. Solutions were prepared by mixing varying proportions of SRM 1647 and DPAC-1 standard solutions. Each point represents the mean of triplicate measurements of the ratios of peak areas for the M'+ ions of perprotio- and perdeuterio-BbF. The dashed curve (PB interface) represents a least- squares fit to an assumed form ( y = axb), with a = 1.006, b = 1.218, and P = 0.998. The full curve (HPN interface) represents a fit to the
linear form ( y = cx
+
4, where c = 1.042,zyxwvutsrqponmlkjihgfedcbaZYXWVUTSRQPONMLKJIHGFEDCBA
d = 0.0361, and P =0.990.
concentration of ion current in ionized molecular species is an advantage for SIM experiments) and the limited dynamic range (about W), although it is possible that the latter may reflect the
pulsecounting detection system of the APCI instrument used in the present work. The mass spectrometric background at low
m/z values, while significant, varies slowly during the
LC
zyxwvutsrqponmlkjihgfedcbaZYXWVUTSRQPONMLKJIHGFEDCBA
elution and thus provides a constant baseline for quantitication by selectedion monitoring or can be corrected for by background subtraction for full mass spectral acquisition.
ACKNOWLEDGMENT
The authors are indebted to Ruth Bailey and David North of Health Protection Branch, Health Canada, for generously allowing access to their LC/MS instrument with PB interface, and to John Fetzer of Chevron Oil Corp. for the gift of the carbon black extract. J.F.A. thanks the Natural Sciences and Engineering Research Council (Canada) and Dalhousie University for graduate scholar- ships. Funding of this work was provided in part by the Panel on Energy Research and Development (Canada) under OERD Project No. 57217. This publication is NRCC No. 38108.
Received for review June 19, 1995. Accepted August 29,
1995.B
AC950616K
Abstract published in Advance ACS Abstracts, October 1, 1995.
![Figure 3. Background subtracted El (a, b, PB interface) and APCI (c, d, HPN interface) mass spectra of benzo[a]pyrene (a, c) and dibenz[a,h]anthracene (b, d)](https://thumb-eu.123doks.com/thumbv2/123doknet/14226348.484686/6.933.484.827.54.540/figure-background-subtracted-interface-interface-spectra-pyrene-anthracene.webp)