HAL Id: hal-02625647
https://hal.archives-ouvertes.fr/hal-02625647
Submitted on 26 May 2020
HAL is a multi-disciplinary open access
archive for the deposit and dissemination of sci-entific research documents, whether they are pub-lished or not. The documents may come from teaching and research institutions in France or abroad, or from public or private research centers.
L’archive ouverte pluridisciplinaire HAL, est destinée au dépôt et à la diffusion de documents scientifiques de niveau recherche, publiés ou non, émanant des établissements d’enseignement et de recherche français ou étrangers, des laboratoires publics ou privés.
Modelling of compacted graphite cast iron solidification
-Discussion of microstructure parameters
Jacques Lacaze, Urko de la Torre, Jon Sertucha, Anna Regordosa
To cite this version:
Jacques Lacaze, Urko de la Torre, Jon Sertucha, Anna Regordosa. Modelling of compacted graphite cast iron solidification -Discussion of microstructure parameters. China Foundry, 2020. �hal-02625647�
1 Modelling of compacted graphite cast iron solidification - Discussion of microstructure parameters
Jacques Lacaze1*, Urko de la Torre2, Jon Sertucha2, Anna Regordosa2
1. Centre Inter-universitaire de Recherche et d’Ingénierie des Matériaux (CIRIMAT), Université de Toulouse, Toulouse, France
2. Fundación AZTERLAN, Durango, Spain
Abstract: A melt maintained for hours in a press pour unit allowed following the change with time
from spheroidal graphite to compacted graphite iron by casting thermal cups at regular time intervals. This provided extensive experimental information for checking the possibility of simulating solidification of compacted graphite irons by means of a microstructure modelling approach. During solidification, compacted graphite develops very much as lamellar graphite but with much less branching. On this basis, a simulation of the thermal analysis records was developed which considers solidification proceeds in a pseudo binary Fe-C system. The simulated curves were compared with the experimental ones obtained from three representative alloys that cover the whole microstructure change during holding of the melt. The most relevant result is that the parameter describing branching capability of graphite is the most important for reproducing the minimum eutectic temperature and the recalescence which are so characteristics of the solidification of compacted graphite cast irons.
Key words: compacted graphite irons; thermal analysis; stable eutectic; metastable eutectic;
simulation
Introduction
During a long period of time, what is called now compacted graphite was described as being worm-like. However, detailed 2D metallographic examinations of deep-etched samples [1, 2], as well as tomographic studies [3,4], have shown that graphite in a compacted graphite iron (CGI) mainly consists of a few spheroids and in inter-connected lamellae with some round bumps. Accordingly, most of the solidification of CGI must consist of the growth of eutectic cells quite alike lamellar graphite cells. However, it has already been noticed that, at given casting conditions, compacted graphite is much coarser than flake graphite, and it was suggested this is related to a much lower capability of the former to branch during growth as compared to the latter [5,6]. On this basis, solidification of compacted graphite iron could be simulated as it has been done for lamellar graphite iron [7], though adjusting the parameter related to graphite branching. This contribution compares experimental and calculated cooling curves of hyper-eutectic uninoculated CGI and discusses the few
2 parameters needed to simulate their solidification, namely those parameters describing graphite nucleation, growth of compacted graphite cells and growth of the metastable eutectic.
1 Experimental approach
The samples analyzed in this work were produced from a melt maintained in an 8 t in capacity nitrogen pressurized pouring unit (press-pour) for several hours as described previously [8]. The initial amount of magnesium in the melt was 0.030-0.040 wt.% so as to give spheroidal graphite castings. During holding, the magnesium content slowly decreased leading eventually to castings with compacted graphite. Every 20 minutes or so, a medal for chemical analysis and two thermal analysis (TA) cups were cast. One of the TA cups was empty before pouring the melt while the other one contained a commercial inoculant. 19 castings were thus successively performed which were identified with a letter from A to S and a subscript “uninoc” and “inoc” for uninoculated and
inoculated alloys, respectively. It was found that the thermal records of the uninoculated alloys were much more diverse and thus contained much more information than those with inoculation.
Accordingly, three of the 19 uninoculated alloys were selected, being the most representative of the microstructure evolution with holding time.
Table 1 lists the composition of alloys C, E and Q which were the three alloys selected in the present work. It is seen that the contents of Mg, Ce and La decrease significantly and that the contents of C and Si diminish slightly as well, while the amount of all other elements does not change. In addition, Table 1 lists the carbon equivalent (CE)
and the calculated stable (T
EUT) and metastable (T
EW)
eutectic temperatures (°C) [9].
Table 1: Composition and carbon equivalent CE of the alloys C, E and Q (wt.%), and calculated stable (TEUT) and metastable (TEW) eutectic temperatures (°C)
alloy C Si Mn Cr Ni Cu Mg Ce La CE TEUT
T
EWC 3.75 2.45 0.63 0.049 0.028 0.85 0.038 0.0120 0.0037 4.52 1165.1 1119.4
E 3.72 2.42 0.63 0.048 0.030 0.84 0.035 0.0100 0.0027 4.48 1165.3 1119.8
Q 3.66 2.40 0.62 0.049 0.028 0.83 0.013 0.0023 0.0007 4.41 1165.2 1120.0
The graphite distribution was quantified for each sample as well as the amount of carbides (fcarbides).
3
2 Experimental results
The three cooling curves in Fig. 1 show the same features characterized by a two-step solidification as follows:
(1) A short arrest at a temperature which increases with holding time between 1140°C and 1150°C; (2) A main arrest which starts at a minimum temperature TE,min before recalescence that is seen to
decrease with holding time, from Alloy C to Alloy Q.
This figure also plots the average temperature for the stable, TEUT, and metastable,
T
EW, eutectics to support the discussion below. As the alloys are hypereutectic, the first arrest may be associated with the formation of austenite when the solidification path during primary precipitation of graphite reaches the metastable extrapolation of the austenite liquidus. It is noticeable that the temperature of this arrest, denoted here TEN, is far below TEUT. The shape of the cooling curves between TEN andTE,min is seen to be somehow the same for all the three curves meaning that the overall kinetics of
solidification is nearly the same. For samples Cuninoc and Euninoc, the thermal arrest during bulk eutectic
solidification has the same appearance and is characterized by a significant recalescence. This suggests that it proceeded in the same way for both alloys. On the contrary, bulk eutectic
solidification of sample Quninoc proceeds below
T
EW and is characterized by a very limited change in temperature with however an abrupt small recalescence (open arrow in Fig. 1).In Fig. 1, the micrographs before etching show that the number of graphite particles decreases with holding time, and those after etching show the amount of carbides increases. It is noticed that carbides must have appeared in sample Cuninoc at the end of solidification as the main eutectic plateau
is located above
T
EW. The similarity of the cooling curves of samples Cuninoc and Euninoc suggests thatcementite also appears in this latter alloy after the main plateau. On the contrary, carbides in sample Quninoc may have appeared at any time during bulk eutectic solidification which proceeded totally
below
T
EW, but this precipitation could well be related to the recalescence mentioned above and will be discussed later.4 Fig. 1: Experimental cooling curves of the three selected samples (Cuninoc, Euninoc and Quninoc) and
related optical micrographs before and after nital etching. The scale of the micrographs is the same for all and is shown in the upper left one
2 Modelling bases
The model shortly described below considers solidification proceeds in a pseudo-binary Fe-C system which accounts for the effects of Si, Mn and Cu contents on the temperature and composition defining the lines of the phase diagram. Solidification of cast irons is quantitatively described by writing the appropriate mass balances following the work by Lesoult et al. [10] on spheroidal graphite cast irons. For describing the eutectic reaction in the present study, spheroidal graphite eutectic cells are replaced by compacted graphite cells of radius R whose growth law is written according to Jones and Kurz [7]:
b a 1 T dt dR 2 2 (1)where t is time, T is the undercooling with respect to the equilibrium eutectic temperature, TEUT, a
and b are constants evaluated by Jones and Kurz, a=2.3 µm·K and b=0.080 K·s·µm-2, and characterizes the capability of the faceted graphite phase to branch.
200 µm
alloy C
alloy E
allo
y
Q
1050 1100 1150 1200 1250 0 50 100 150 200 250 alloy C alloy E alloy Q Temp e ra tu re (° C) Time (s) T EUT T EWT
E,minT
EN5 For an ideal regular eutectic between two non-faceted phases, should be 1, while it has been proposed to be 2.5 for Fe-C graphite/austenite eutectic [11]. Jones and Kurz [7] could reproduce their experimental results of directional solidified lamellar graphite iron with set to 3.9, while Zou Jie [12] found a value of 6.5 for equiaxed solidification of an Fe-C-Si alloy. Zou Jie [12] suggested that part of the difference with directional solidification is due to the expanding nature of the eutectic cells during equiaxed solidification. In the case of compacted graphite cells, the protuberances formed on the primary graphite precipitates then develop without much branching. Thus, the distance between them increases as the size of the compacted graphite cells increases. This suggested writing =0+R/RGE, where RGE is the initial size of the cell, and to limit the change of
from the initial value of 0=2.5to some maximum value, max, equal to or lower than 10 at which
branching of graphite lamellae is anyway expected because of the high undercooling developed between the lamellas [11].
In the case of hyper-eutectic alloys, the solidification path during primary deposition was calculated assuming spheroidal graphite precipitates following a nucleation law given as NV=A1·(TLG), where NV
is the volume number of cells, A1 is the nucleation constant and TLG is the undercooling with respect
to the graphite liquidus [10]. When the extrapolation of the austenite liquidus is reached, the number of graphite particles is set constant at the value which has been reached. An equivalent diameter of the graphite particles is calculated which is then used as the initial size for the compacted graphite cells, RGE. Solidification proceeds further by growth of eutectic cells and
off-eutectic austenite which may also dissolve in order for the solidification path to stick to the extrapolation of the austenite liquidus [10].
As seen above, cooling of uninoculated alloys in TA cups shows metastable solidification competes with stable solidification. Growth of ledeburite is to be described as spherical cells of radius RW using
the data from Hillert and Subba Rao [13], which is very close to the value later found by Jones and Kurz [7]:
2 EW W T 30 dt dR (2)where RW is in µm and
T
EW is the undercooling with respect toT
EW. The number of metastable eutectic cells was in all cases set to 0.5 mm-3.6 The solidification process of the thermal cups was described assuming their temperature is homogeneous at any time during the cooling process. For each time step of calculation, the calculated change of the solid fraction, VS, was thus introduced in the following heat balance:
0
0.5 S p T T t dt dV H dt dT C A / V (3)Where and Cp are, respectively, the density and the heat capacity of the metal at temperature T,
H is the latent heat of fusion of the metal, is a quantity characteristic of the mould and T0 is the ambient temperature. V is the volume of metal having an outer surface area A, and V/A is the so-called casting modulus. The same equation is used without the second term in the left hand side for describing liquid and solid cooling. All data used in the present calculations are listed in Table 2. During solidification, the specific heat Cp and the density were calculated as a weighted average of
the solid and liquid values. Impingement of eutectic cells was accounted for using the correction factor (1-VS)2.
Table 2: Values of the parameters used for calculations V/A [m]
[J·m-2·K-1·s-0.5] liquid pC
[J·K-1·kg-1] solid pC
[J·K-1·kg-1] liquid [kg·m-3] austenite [kg·m-3] graphite [kg·m-3] 0.009 728 before solidification 1215 after solidification 920 750 6,800 7,000 2,200 3 Simulation resultsAccording to preliminary calculations, the start temperature of the metal at the time of pouring, Tpour,
was set to the first recorded temperature plus 30°C. The A1 value used to describe primary graphite
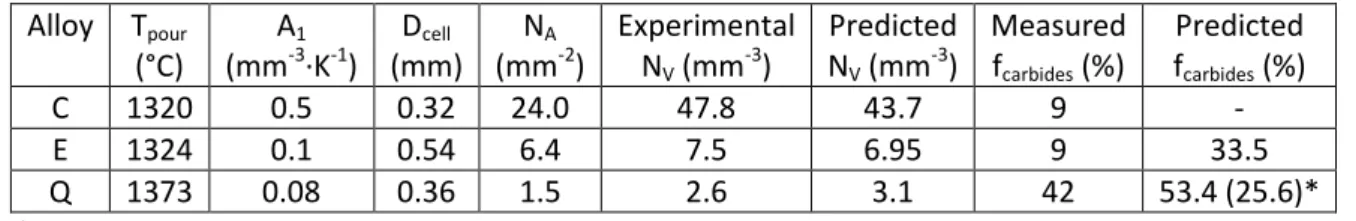
nucleation was determined so as to give close fit to the experimental cell number. Table 3 lists the values of Tpour and A1 used in the calculations for each alloy, the measured values of DCell and NA, and
the experimental values of NV which were calculated by
Cell A V D N 2 N
[14]. Table 3 also lists the
experimental values of fcarbides, and the predicted values of NV and fcarbides. Unless specified, all
calculations were made with max=10.
Table 3 – Values used for calculations for each three alloys and predicted NV and fcarbides values.
Alloy Tpour (°C) A1 (mm-3·K-1) Dcell (mm) NA (mm-2) Experimental NV (mm-3) Predicted NV (mm-3) Measured fcarbides (%) Predicted fcarbides (%) C 1320 0.5 0.32 24.0 47.8 43.7 9 - E 1324 0.1 0.54 6.4 7.5 6.95 9 33.5 Q 1373 0.08 0.36 1.5 2.6 3.1 42 53.4 (25.6)*
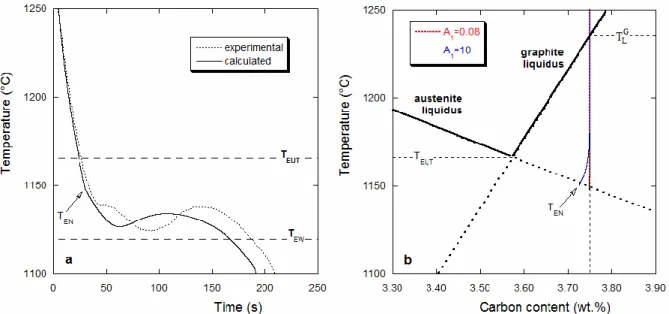
7 Figure 2 (a) compares the experimental cooling curve for the uninoculated Alloy C to the calculated one without considering the possibility for formation of metastable eutectic. It is seen that the main eutectic peak is quite well reproduced but that the beginning of the curves differs significantly. As a matter of fact, austenite is predicted to appear at TEN=1147.7°C (open arrow) leading afterwards to a
constant slope indicative of a regular growth of solid. In contradistinction, the experimental curve shows a thermal arrest starting at about 1140°C with a marked but short plateau.
Fig. 2: Comparison of calculated and experimental cooling curves for the uninoculated Alloy C (a), and effect of A1 value on the solidification path during primary graphite precipitation (b). The open
arrow in (a) indicates the slope change associated with appearance of austenite at the calculated TEN
temperature; similarly, TEN in (b) indicates the corresponding end of primary graphite precipitation
when austenite is predicted to appear.
It was first thought that the discrepancy at the beginning of solidification could originate in the description of the primary deposition of graphite which controls the temperature at which is reached the metastable extrapolation of the austenite liquidus. Accordingly, A1 was changed from 0.08 to 10
mm-3·K-1 leading to a change in NV from 3 to 760 mm-3 which covers the full range of the measured
values. Figure 2 (b) shows the calculated primary solidification path plotted on the isopleth Fe-C section of the phase diagram, i.e., corresponding to the alloy content in Si, Mn and Cu. For A1=0.08
mm-3·K-1, the volume fraction of graphite precipitated during primary deposition is so low that the carbon content in the liquid remains nearly unchanged and equal to the alloy nominal value (vertical red dotted line). The austenite liquidus is thus reached at a temperature of 1147.7 °C. By increasing A1 to 10 mm-3·K-1, it is seen that precipitation of graphite starts curving the solidification path
towards the graphite liquidus only by the end of primary deposition (blue solid curve). Accordingly, the calculated TEN value at 1150.1°C is not much higher than that for lower A1 value. To make the
8 liquid composition to follow more closely the graphite liquidus, much higher values of A1 would be
required which would correspond to highly inoculated alloys. It thus appears that the discrepancy between calculated and experimental TEN values must be due to an undercooling of the austenite
phase which is well-known experimentally [15]. This can be related to the time needed for austenite dendrites nucleated at the surface of the TA cup to reach the centre. Note that the increase of the experimental value of TEN between alloys C and Q shown in Fig. 1 relates to the decrease in the alloy
carbon content with holding time and thus to a move to the left of the solidification path in Fig. 2 (b).
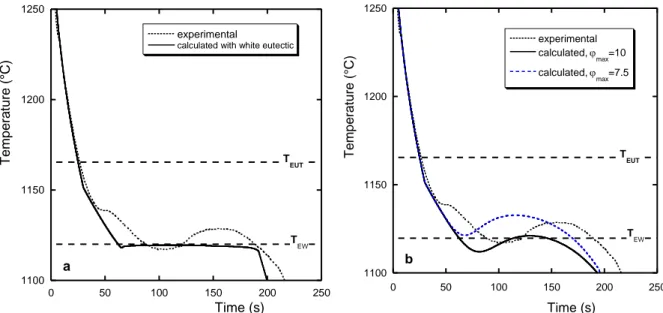
Figure 3 (a) compares the experimental cooling curve for the uninoculated Alloy E to the calculated one when ledeburite is considered. It is seen that the main eutectic plateau of the calculated curve is at a nearly constant temperature apart from a very small and short recalescence at the beginning. This must be related to rapid growth of ledeburite which totally overtakes the solidification in the stable system. Owing to the fact that such a plateau does not appear in the experimental curve, calculations were performed again without considering precipitation of ledeburite. The result is shown in Fig. 3 (b) where it is seen that the predicted shape is as the experimental one, but with a lower TE,min and recalescence values than observed. The calculations were performed again with a
smaller max value of 7.5, and the curve is also shown in Fig. 3 (b). It is seen that decreasing max
significantly increases TE,min and marginally increases the recalescence value. In the present case, an
intermediate value of max would give a perfect fit between predicted and observed TE,min and
recalescence values.
Fig. 3: Comparison of calculated and experimental cooling curves for the uninoculated Alloy E: (a) calculation performed accounting for ledeburite formation; (b) calculations performed for two values of max and without ledeburite precipitation
1100 1150 1200 1250 0 50 100 150 200 250 experimental
calculated with white eutectic
T empe ra tur e (° C) Time (s) T EUT T EW a 1100 1150 1200 1250 0 50 100 150 200 250 experimental calculated, max=10 calculated, max=7.5 T e mpe rature (° C ) Time (s) T EUT T EW b
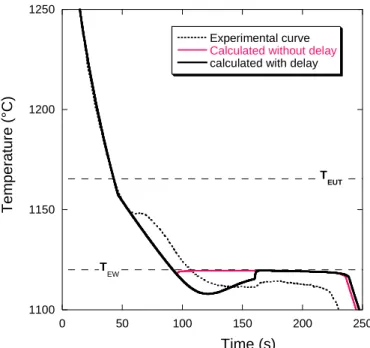
9 Finally, Fig. 4 compares the predicted and experimental cooling curves for the uninoculated Alloy Q. The first calculation was carried out with ledeburite appearing as soon as the temperature felt below
T
EW and this leads to the thin red solid line which shows a long and flat eutectic plateau that does not resemble the experimental one. This made evident that the small but abrupt recalescence seen at about 160 s on the experimental curve certainly represents the appearance of ledeburite. Accordingly, formation of ledeburite was delayed in a second calculation which is shown with the thick black solid line. It is then seen that the smooth evolution of the cooling curve beforerecalescence as well as the amplitude of recalescence are quite well reproduced even though the growth law used for ledeburite may give too high growth rates. It may be postulated that the delay which has been introduced relates to the time needed for ledeburite to nucleate close to the thermocouple junction.
Fig. 4: Comparison of experimental and calculated cooling curves for the uninoculated Alloy Q. Ledeburite appearance was calculated either without (thin red solid line) or with (thick black solid line) a time delay
4 Conclusion
It is shown that the solidification characteristics of CGI as observed with cooling curves may be represented by using a modelling approach derived from that used for lamellar graphite irons. The parameter describing the branching capability of graphite lamellae in eutectic cells appears to be the most sensitive parameter to describe the maximum undercooling and the recalescence of the bulk
1100 1150 1200 1250 0 50 100 150 200 250 Experimental curve Calculated without delay calculated with delay
T e mperature (° C) Time (s) T EUT T EW
10 eutectic reaction of CGI. Dedicated experiments would be needed to explore the effect of residual magnesium content on this parameter. Some marginal improvements to the present approach could be made concerning the description of austenite formation and growth of ledeburite.
References
[1] C.R. Loper, R.C. Voigt, J.R. Yang, et al. Use of the scanning electron microscope in studying growth mechanisms in cast irons. AFS Trans., 1982, 89: 549-552.
[2] Den Xijun, Zhu Peiyue, Liu Qifu. Structure and formation of vermicular graphite. Mat. Res. Soc. Symp. Proc., 1985, 34: 141-150.
[3] C. Chuang, D. Singh, P. Kenesei, et al. 3D quantitative analysis of graphite morphology in high strength cast iron by high-energy X-ray tomography. Scripta Mater., 2015, 106: 5-8.
[4] K. Salomonsson, A.E.W. Jarfors. Three-Dimensional Microstructural Characterization of Cast Iron Alloys for Numerical Analyses. In: Proc. SPCI-XI, edited by A. Diószegi, V.L. Diaconu and A.E.W. Jarfors, Trans. Tech. Pub., Zurich, 2018, 925: 427-435.
[5] J. Lacaze, J. Sertucha. Some paradoxical observations about spheroidal graphite degeneracy, China Foundry, 2018, 15: 457-463.
[6] J. Lacaze, D. Connétable, M.J. Castro de Roman.Effects of impurities on graphite shape during solidification of spheroidal graphite cast ions. Materialia, 2019, 8: 100471,
DOI: 10.1016/j.mtla.2019.100471.
[7] H. Jones, W. Kurz. Relation of interphase spacing and growth temperature to growth velocity in Fe-C and Fe-Fe3C eutectic alloys. Z. Metallknde, 1981, 72: 792-797.
[8] A. Regordosa, U. de la Torre, A. Loizaga, et al. Microstructure changes during solidification of cast irons - Effect of chemical composition and inoculation on competitive spheroidal and compacted graphite growth. Int. J. Metalcasting, DOI : 10.1007/s40962-019-00389-y.
[9] M. Castro, M. Herrera, M.M. Cisneros, et al. Simulation of thermal analysis applied to the description of the solidification of hypereutectic SG cast irons. Int. J. Cast Met. Res., 1999, 11: 369-374.
[10] G. Lesoult, M. Castro, J. Lacaze. Solidification of spheroidal graphite cast irons – I. Physical modelling. Acta Mater., 1998, 46: 983-995.
[11] Trivedi R and Kurz W. Microstructure selection in eutectic binary systems, in: Solidification
Processing of Eutectic alloys, Ed. D.M. Stefanescu, G.J. Abbaschian and R.J. Bayuzick, The
Metallurgical Society, USA, 1988: 3-34.
[12] Zou Jie. Simulation of eutectic solidification, Ph.D thesis #774, 1989, Ecole Polytechnique Fédérale de Lausanne, Switzerland.
11 [13] M. Hillert, V.V. Subba Rao. Grey and white solidification of cast iron. Pub. 110, The Institute of Metals, 1969: 204-211.
[14] M. Coster, J.L. Chermant, Handbook of Image Analysis (in French), Presses du CNRS, 1989. [15] R.W. Heine. Austenite liquidus, carbide eutectic and undercooling in process control of ductile base iron. AFS. Trans., 1995, 1.3: 199-206.