HAL Id: hal-02544980
https://hal.archives-ouvertes.fr/hal-02544980
Submitted on 16 Apr 2020
HAL is a multi-disciplinary open access
archive for the deposit and dissemination of
sci-entific research documents, whether they are
pub-lished or not. The documents may come from
teaching and research institutions in France or
abroad, or from public or private research centers.
L’archive ouverte pluridisciplinaire HAL, est
destinée au dépôt et à la diffusion de documents
scientifiques de niveau recherche, publiés ou non,
émanant des établissements d’enseignement et de
recherche français ou étrangers, des laboratoires
publics ou privés.
Anatomo-functional correlates of auditory development
in infancy
Parvaneh Adibpour, Jessica Lebenberg, Claire Kabdebon, Ghislaine
Dehaene-Lambertz, Jessica Dubois
To cite this version:
Parvaneh Adibpour, Jessica Lebenberg, Claire Kabdebon, Ghislaine Dehaene-Lambertz, Jessica
Dubois. Anatomo-functional correlates of auditory development in infancy. Developmental Cognitive
Neuroscience, Elsevier, 2020, 42, pp.100752. �10.1016/j.dcn.2019.100752�. �hal-02544980�
Developmental Cognitive Neuroscience 42 (2020) 100752
Available online 2 January 2020
1878-9293/© 2020 The Authors. Published by Elsevier Ltd. This is an open access article under the CC BY-NC-ND license (http://creativecommons.org/licenses/by-nc-nd/4.0/).
Anatomo-functional correlates of auditory development in infancy
Parvaneh Adibpour
a,*
, Jessica Lebenberg
a,b, Claire Kabdebon
a, Ghislaine Dehaene-Lambertz
a,
Jessica Dubois
a,caCognitive Neuroimaging Unit U992, NeuroSpin Center, Gif/Yvette, France bUNATI, CEA DRF Institut Joliot, Gif/Yvette, France
cUniversit�e de Paris, NeuroDiderot, Inserm, F-75019 Paris, France
A R T I C L E I N F O Keywords: Auditory development MRI DTI EEG
Auditory evoked potentials Corpus callosum
Inter-hemispheric connectivity Perisylvian cortical regions Language network Speech lateralization Brain asymmetries Microstructure Tractography A B S T R A C T
Infant brain development incorporates several intermingled mechanisms leading to intense and asynchronous maturation across cerebral networks and functional modalities. Combining electroencephalography (EEG) and diffusion magnetic resonance imaging (MRI), previous studies in the visual modality showed that the functional maturation of the event-related potentials (ERP) during the first postnatal semester relates to structural changes in the corresponding white matter pathways. Here investigated similar issues in the auditory modality. We measured ERPs to syllables in 1- to 6-month-old infants and related them to the maturational properties of underlying neural substrates measured with diffusion tensor imaging (DTI). We first observed a decrease in the latency of the auditory P2, and in the diffusivities in the auditory tracts and perisylvian regions with age. Sec-ondly, we highlighted some of the early functional and structural substrates of lateralization. Contralateral re-sponses to monoaural syllables were stronger and faster than ipsilateral rere-sponses, particularly in the left hemisphere. Besides, the acoustic radiations, arcuate fasciculus, middle temporal and angular gyri showed DTI asymmetries with a more complex and advanced microstructure in the left hemisphere, whereas the reverse was observed for the inferior frontal and superior temporal gyri. Finally, after accounting for the age-related variance, we correlated the inter-individual variability in P2 responses and in the microstructural properties of callosal fibers and inferior frontal regions. This study combining dedicated EEG and MRI approaches in infants highlights the complex relation between the functional responses to auditory stimuli and the maturational properties of the corresponding neural network.
1. Introduction
The development of the human brain is characterized by a period of fast changes during the first two years after birth followed by a slower but persistent progression until early adulthood. This protracted matu-ration enables children to acquire sensorimotor capacities and cognitive skills in connection with their environment. The multiple neural changes occurring during childhood are still incompletely understood, but two major phenomena supporting behavioral changes have been highlighted since the beginning of the 20th century by post-mortem examinations (Flechsig, 1920; Yakovlev and Lecours, 1967b): synaptogenesis-pruning cycles in the gray matter, mostly in the cortex, and the myelination of white matter fibers. Although these early studies remained limited by the small sample size, brain anomalies and the impossible matching with infants’ functional development, they underscored the heterogeneity of the maturational patterns, with different timelines across regions,
networks and functional systems.
With the rise of neuroimaging, it is now possible to examine brain development in healthy infants and over larger groups. Particularly structural Magnetic Resonance Imaging (MRI) studies have started to extend the former post-mortem studies, confirming the lengthy and het-erogeneous changes occurring in the human brain in terms of cortical thickness (Li et al., 2015; Sowell et al., 2003), surface (Yakovlev and Lecours, 1967a) and microstructure (Leroy et al., 2011), as well as white matter maturation (Dubois et al., 2014a). In the cortical gray matter, indirect markers of the growth of dendritic arborization and synapto-genesis (Huttenlocher and Dabholkar, 1997) and of the myelination of intra-cortical fibers (Thomas et al., 2000) can be measured through relaxometry MRI (Leroy et al., 2011), diffusion MRI (Ball et al., 2013;
Batalle et al., 2019) or both (Lebenberg et al., 2019b). In particular, an asynchrony in microstructural maturation between primary and non-primary auditory regions has been observed during the preterm
* Corresponding author.
E-mail address: [email protected] (P. Adibpour).
Contents lists available at ScienceDirect
Developmental Cognitive Neuroscience
journal homepage: www.elsevier.com/locate/dcn
https://doi.org/10.1016/j.dcn.2019.100752
period, based on parameters of diffusion tensor imaging (DTI) (Monson et al., 2018). In the white matter, the progressive axons ensheathment by myelin, the increasing lipid content and the fiber compactness constrain the diffusion of water molecules, leading to decreases in DTI diffusivities and an increase in fractional anisotropy in most tracts throughout infancy (Dubois et al., 2006; Huppi et al., 1998).
These structural changes have functional consequences that can be assessed in infants with electro- or magneto-encephalography (EEG, MEG) (Dubois et al., 2016a). The topography and latencies of event-related potentials (ERPs) are changing, especially during the first postnatal year. For instance, in the visual system, the latency of the vi-sual P1 (the first positive component following the presentation of a visual stimulus) decreases from ~300 ms at birth to ~100 120 ms (close to the adults’ values) about 3 months later (McCulloch et al., 1999). Since myelination accelerates the conduction of neural trans-missions, we expected that DTI parameters reflecting the maturation of white matter fibers would correlate with the speed derived from the latencies of ERP components. We confirmed this hypothesis in two successive studies in infants showing that the speed of the visual P1 was correlated with the transverse diffusivity measured in the optic radia-tions, and the speed of inter-hemispheric visual transfer with that of the splenial callosal fibers (Adibpour et al., 2018a; Dubois et al., 2008).
Here, our goal was to investigate whether these results can be generalized to another sensory modality -the auditory system, and to further add another measure of maturation: the microstructural changes in the cortical gray matter where neural computations are performed, and which might be relevant to explain some variability across infants. The auditory system has a different developmental timeline compared with the visual system. Because of the noisy womb environment, the auditory cortex is already stimulated before birth, whereas visual stimulations are largely different in- and ex-utero. From the seminal work of Yakovlev and Lecours (1967a) on the myelination of white matter tracts, it appears that acoustic radiations start to myelinate shortly after birth and continue slowly throughout the first 3 years, whereas this process occurs much more rapidly over the first postnatal semester for optic radiations. Consisting of a broad positive peak (P2) followed by a broad negative peak (N2), the infant’s auditory ERPs show slower changes than the visual ERPs: from birth to one year of age, latencies decrease from ~300 ms to ~150 ms for the P2, and from ~530 ms to ~300 ms for the N2 (Barnet et al., 1975; Kushnerenko et al., 2002;
Novak et al., 1989; Wunderlich and Cone-Wesson, 2006). Protracted changes are also observed throughout childhood (Shafer et al., 2015), notably with the appearance of earlier peaks (P1, N1) which are barely identifiable before 4–5 years of age (Lipp�e et al., 2009; Ponton et al., 2000).
With regard to structure-function relationships, only one study has investigated this issue in the auditory domain from childhood to adolescence, relating DTI parameters in acoustic radiations and the la-tency of M100 auditory response evaluated with MEG (Roberts et al., 2009). However, the observed relationship did not survive when the children’s age was first entered in the statistical model, contrarily to our reports for the infant’s visual system (Adibpour et al., 2018a; Dubois et al., 2008). This result suggests that the links between the structural and functional properties as we can measure them, might be not as straightforward for the auditory modality as for the visual one. This issue thus needs to be further investigated.
A second important characteristic of the human adult auditory sys-tem is that it is lateralized, some acoustic features being better processed by the left hemisphere, some by the right (Boemio et al., 2005). Signs of functional lateralization are seen early on. Preterms at 6 month of gestation and listening to speech syllables display faster and more sus-tained BOLD responses over the left posterior temporal region than the right, escaping the general pattern of larger right responses measured over the other regions (Mahmoudzadeh et al., 2013). Dehaene-Lambertz et al. (2010) reported larger activations in the left than right planum
temporale for speech, whereas activations were symmetric for piano
music in 2-3-month-old infants (Dehaene-Lambertz et al., 2010). By contrast, Perani et al. (2011) reported larger activations in a right than left sphere defined around Heschl’s gyrus in neonates listening to speech, but the whole-brain analysis showed mainly bilateral activations and even left activations when hummed and flattened speech were compared (Perani et al., 2011). Finally, Shultz et al. (2014) observed an increase with age in the difference of activations for speech and bio-logical non-speech sounds in the left temporal lobes, when all responding voxels were pooled (Shultz et al., 2014). This suggests an increase in the left hemispheric bias for speech perception during in-fancy. Besides, we reported early hemispheric asymmetries of the lan-guage network at the structural level, in terms of sulcation (Dubois et al., 2010; Glasel et al., 2011), cortical maturation (Leroy et al., 2011;
Rolland et al., 2019) and white matter architecture (Dubois et al., 2009,
2016b). Therefore, here we aimed to evaluate the relationships between early functional and anatomical markers of lateralization.
In this study, we used complementary EEG and DTI measures to study the maturation of the auditory network in infants during the first postnatal semester, when changes are intense and when structure- function relationships have already been demonstrated in the visual domain (Adibpour et al., 2018a; Dubois et al., 2008). We considered different functional and structural indices of maturation: latency of the auditory evoked responses as a functional index of neural maturation and transverse and longitudinal diffusivity as microstructural indices of white matter maturation and cortical gray matter maturation respec-tively. After analyzing how each of these indices evolves with infants’ age, we analyzed hemispheric differences and investigated the extent to which these complementary measures of maturation are inter-related in the auditory domain.
2. Material and methods 2.1. Subjects
2.1.1. EEG
We tested a first group of 23 infants in a binaural auditory paradigm (postnatal age between 5 and 21.4 weeks, 10 girls and 13 boys), and a second group of 19 infants in a monaural auditory paradigm (age be-tween 6.7–28.7 weeks, 6 girls and 13 boys).
2.1.2. MRI
Diffusion MRI data were acquired in a group of 22 infants (age be-tween 5.9–22.4 weeks, 9 girls and 13 boys), considered for analyses of white matter pathways. Anatomical MRI data could not be acquired for one infant, so analyses over cortical regions only included 21 infants as detailed below.
Some infants participated to both EEG (monaural paradigm) and MRI exams, in less than 7 days apart: n ¼ 16 with EEG and diffusion MRI data (5 girls and 11 boys); n ¼ 15 with EEG, diffusion and anatomical MRI data (4 girls and 11 boys).
All infants were considered as typical subjects (born full-term, with no reported history of medical problems). The study was approved by the regional ethical committee for biomedical research. All parents were informed about the content and goals of the experiments, and gave written informed consent.
2.2. EEG study
2.2.1. Experimental paradigms
2.2.1.1. Stimuli. Two consonant–vowel syllables (/pa/ and /ta/) with
neutral intonation were produced by two female speakers and matched for intensity and total duration (200 ms).
in the room at a one–meter distance from the infant participant and parent. In each trial, syllables were presented by series of four, with an interval of 600 ms between the stimuli onsets and 2.2 s of silence following the fourth syllable onset and before the onset of the next trial (leading to a total duration of each trial of 4 s). At each trial, the syllable (phoneme /pa/ or /ta/, speaker) was randomly chosen among the four possibilities, and presented three times. The last syllable determined the type of trials: it was either similar to the first three (standard trials), or there was a change of phoneme (deviant phoneme trials) or a change of voice (deviant voice trials). A maximum of 192 trials was presented in 4 blocks of 48 trials (corresponding to 3 types of trials x 2 phonemes x 2 voices x 4 repetitions).
2.2.1.3. Monaural paradigm. Small earphones were placed on the
in-fant’s ears and maintained in place by the EEG net. The paradigm was similar to the binaural paradigm except that the first three syllables were presented in a single ear, and the last syllable was either played in the same or in the other ear. The initial ear side was kept constant during a block. 192 trials were presented in 4 blocks (2 blocks per ear side) of 48 trials (corresponding to 2 ear sides for the last syllable x 3 types of trials x 2 phonemes x 2 voices x 2 repetitions). This has led to similar acqui-sition times for the binaural and monaural paradigms.
2.2.2. EEG data acquisition
An EEG net comprising 128 electrodes (EGI, Eugene, USA) with a reference located on the vertex was placed on infant’s head relative to anatomical markers on the scalp. EEG was continuously digitized at a sampling rate of 250 Hz during the whole experiment (net amp 200 system EGI, Eugene, USA). The infants were sitting on the parent’s laps in a shielded room. They may have fallen asleep or remained awake during the experiment. In the latter case, one experimenter was showing them interesting objects and cartoon images to keep them quiet. The experiment was stopped before the end if infants became restless.
2.2.3. EEG pre-processing
EEG recordings were band-pass filtered between 0.5 and 20 Hz using a zero-phase lag filter, and were further processed using MATLAB toolboxes: EEGLAB (Delorme and Makeig, 2004) and Brainstorm (Tadel et al., 2011). For both paradigms, the signal was segmented into epochs of 3700 ms [-200, þ3500] ms relative to the onset of the first syllable at each trial. Channels contaminated by movement or eye artifacts were automatically rejected on a trial by trial basis, based on amplitude variations inside each epoch: for each channel, an epoch was rejected when the fast average amplitude exceeded 250 μv, or when deviation
between fast and slow running averages exceeded 150 μv. Channels
were rejected if they were marked as bad in more than 70 % of the trials, and trials were rejected if more than 50 % of electrodes were marked as bad. Recordings were then re-referenced by subtracting the average activity of all channels over the brain to obtain average-reference re-cordings, then baseline-corrected by [-200 0] ms time-window before the onset of the first syllable.
We computed auditory-evoked responses by averaging all artifact- free trials in each condition. For the binaural experiment, we kept on average a total of 121 out of 192 trials (63 %). For the monaural experiment, we averaged these trials for each ear side independently and kept on average a total of 56/55 out of 96 trials for the left/right ear respectively (58 %). Here, we focused on brain responses to the first syllable only, for which we had the maximum number of trials allowing to study responses with the highest signal-to-noise ratio. The high number of trials provided the most reliable identification of the ERP components by minimizing the signal variability between infants.
2.2.4. Identification of auditory evoked potentials
To measure the latency of auditory evoked responses, we focused on the positive pole of the auditory response which is extended more
laterally compared to the more medial negative pole (see Fig. 1). We identified two symmetrical clusters of electrodes over the left and right sides on the topography of the grand average performed across each group. For the binaural paradigm, we considered 27 electrodes over each hemisphere, covering the fronto-temporal regions and extending over T1-F7 on the left side (T2-F8 on the right) (Fig. 1. a). For the monaural experiment, we identified two symmetrical clusters of 15 electrodes, around T7/T8 extending anteriorly up to F3/F4, and poste-riorly down to P7/P8 (Fig. 1. b). For each infant, we averaged the ac-tivity over each cluster of electrodes.
These clusters were identified by visual inspection of grand average responses over the infants group, irrespective of the side of stimuli presentation, standard/deviant conditions and the different ages of in-fants, and they were consistent with those previously reported in the infant literature on syllabic perception (Bristow et al., 2009; Dehae-ne-Lambertz, 2000; Wunderlich and Cone-Wesson, 2006) In this study we focused on P2, which is the most prominent auditory response in the first semester after birth (Wunderlich and Cone-Wesson, 2006) and can be more easily identified in each infant even during sleep ( Dehaene--Lambertz and Pena, 2001) We identified P2 component as the first distinguishable positive peak, appearing between 150 450 ms in the time course of auditory evoked potentials. In each infant, we measured P2 latency at the peak, and computed its amplitude over a 50 ms time window centered on the peak. P2 response was identifiable in all awake and sleeping infants. We thus included all infants in our analysis, notably following reports of little or no alterations of P2 latency for different stages of sleep in infants and children (Barnet et al., 1975; Kurtzberg et al., 1984).
2.3. MRI study
2.3.1. MRI acquisition and pre-processing
Acquisitions were performed during spontaneous sleep in a 3 T MRI scanner (Tim Trio, Siemens Healthcare, Erlangen, Germany), equipped with a whole-body gradient (40 m T/m, 200 T/m/s) and a 32-channel head coil. To minimize specific absorption rate (SAR) and noise expo-sure, we used radio-frequency (RF) impulsions with “no SAR”, and “whisper” gradient mode when possible. Infants’ ears were protected from the noise using headphones placed over their ears during the acquisition.
Anatomical T2-weighted (T2w) images were also acquired in infants using a 2D turbo spin echo sequence (spatial resolution ¼ 1 � 1 � 1.1mm3), providing the best grey / white matter contrast at these ages (Dubois et al., 2014a,b). For DTI and tractography purposes, a diffusion-weighted (DW) spin-echo single-shot EPI sequence was used, with parallel imaging (GRAPPA reduction factor 2), partial Fourier sampling (factor 6/8) and monopolar gradients to minimize mechanical and acoustic vibrations. After the acquisition of the b ¼ 0 volume, diffusion gradients were applied along 30 orientations with b ¼ 700 s. mm-2. Fifty interleaved axial slices covering the whole brain were ac-quired with a 1.8 mm isotropic spatial resolution (field of view ¼ 230 � 230 mm2, matrix ¼ 128 � 128, slice thickness ¼ 1.8 mm, TE ¼72 ms, TR
¼ 10 s), leading to a total acquisition time of 5min40 s which was reasonably short for unsedated infants. Motion artifacts were corrected on DW images using PTK/Connectomist software (Dubois et al., 2014b;
Duclap et al., 2012).
2.3.2. Identification of white matter tracts and microstructure characterization
Probabilistic tractography was based on a 2-crossing-fiber diffusion model using FSL software (Behrens et al., 2007) over individual brain masks. Using individual seed regions, the following fiber tracts were identified from the auditory network: 1. left and right acoustic radia-tions (AR) (by locating seeds at the level of medial geniculate nucleus in thalamus, and temporal regions around Heschl’s gyrus); 2. auditory fi-bers of the corpus callosum (ACC) (by locating the seeds in the left and
right auditory regions) 3. left and right arcuate fascicles (AF) (by locating seeds at the superior parietal part of the tract, and at parieto-temporal junction at the level of the arcuate loop).
Following the estimation of the diffusion tensor, DTI parameters were quantified in each voxel of each infant brain. For each tract, averaged parameter X was calculated over the tract voxels by taking into account fiber density on the tract density map (Hua et al., 2008):
X ¼ Pi di�Xi Pi di ;
where i denotes the tract voxels, di is the fiber density at voxel i, and Xi is
the value of the DTI parameter at voxel i. In this study, we focused on transverse diffusivity (λ?) as it was shown to be the best DTI marker of
white matter myelination according to previous studies in animal models of demyelination (Song et al., 2003, 2005) and infant studies of white matter maturation (Dubois et al., 2014a). Moreover, we previ-ously showed that a higher speed of visual responses is related to a lower transverse diffusivity in the corresponding tracts (Adibpour et al., 2018a; Dubois et al., 2008).
2.3.3. Identification of cortical regions and microstructure characterization
In each infant, anatomical images were used to extract the cortical surface through a semi-automatic procedure (Dubois et al., 2019). An individual atlas of cortical parcels defined on a 10-weeks-old infant (Kabdebon et al., 2014) was projected on individual surfaces using a reliable inter-individual registration based on cortical sulci and ribbons (Lebenberg et al., 2019a). Here we focused on the auditory-related perisylvian regions: Heschl’s gyrus (HG), Planum Temporale (PT), supe-rior and medial temporal gyrus (STG, MTG), infesupe-rior frontal gyrus (IFG),
and angular gyrus (AG).
We mapped DTI parameters over the cortical ribbon in each infant using a precise intra-individual registration correcting for geometric distortions (Lebenberg et al., 2019b, 2015). To specifically identify cortical measures, we took advantage of the fact that longitudinal diffusivity (λ//) displays minimal values in the cortex compared with
surrounding tissues regardless of the maturational stage (Lebenberg et al., 2019b). We computed median DTI parameters over each cortical region. We focused on λ// to characterize the cortical microstructure
because it reliably decreases with increasing maturation over this developmental period (Lebenberg et al., 2019b; Rolland et al., 2019).
2.4. Statistical analyses
2.4.1. Dependencies related to age, hemisphere, side and region
We first evaluated the factors that might modulate the ERPs func-tional characteristics. We performed analyses of covariance (ANCOVA) on the P2 amplitudes and latencies for the binaural (n ¼ 23) and monaural (n ¼ 19) paradigms independently, with age as between- subjects covariate and hemisphere (left/right) as a within-subject fac-tor. For the monaural paradigm, we entered a supplementary within- subject factor for the response side (contralateral/ipsilateral side rela-tively to the ear of syllable presentation).
Second, we assessed similar dependencies for DTI structural pa-rameters (transverse diffusivity for each white matter tract: n ¼ 22, longitudinal diffusivity for each cortical region: n ¼ 21). With the diffusivity as dependent variable, we performed ANCOVA with age as between-subjects covariate, tract/region and hemisphere (left/right) as within-subject factors.
In all these analyses, hemispheric asymmetries were tested through
Fig. 1. Time course of auditory evoked responses and age-related decrease in P2 latency.
Left panels: Grand average ERPs over the groups in response to the first syllable presented either binaurally (a: n ¼ 23), or monaurally in the left and right ears (b: n ¼ 19). The grand-averages computed over the highlighted clusters of electrodes are displayed (red ¼ left side, blue ¼ right side). The voltage topography at P2 peak is presented next to the time course plot. For monaural syllables, topographies are presented at the time of the contralateral and ipsilateral P2 peaks. Time zero marks the syllable onset.
Right panels: In each infant, the peak of P2 response was identified over the left (red) and right (blue) clusters for syllables presented binaurally, or monaurally. In b. darker colors correspond to the contralateral responses, and light colors to the ipsilateral ones. The latency of each P2 response decreases with age.
the factor “hemisphere”. When the tract/region x hemisphere interac-tion was significant, post hoc analyses were performed using paired t- tests. To limit the number of comparisons, we focused on the most relevant pairs (i.e. across different tracts/regions within each hemi-sphere, and across homologous tracts/regions of the two hemispheres). For the post hoc analyses, p-values were corrected for the number of comparisons using FDR approach.
2.4.2. Relationships between the functional markers of maturation
We tested whether asymmetry indices (defined as (L – R)/(L þ R) with left L and right R values for amplitude or latency) were related between contralateral and ipsilateral responses using Pearson correla-tions (these measures did not depend on the infants’ age, so partial correlations were not necessary). P-values were corrected for the num-ber of comparisons using FDR approach.
2.4.3. Relationships between the structural markers of maturation
As we considered auditory white matter tracts and perisylvian cortical regions that all belong to the same functional network, we further investigated whether these different neural substrates have related DTI microstructural changes over this developmental period, while controlling for common dependencies on infants’ age. As previ-ously, we evaluated relationships for the most relevant comparisons, i.e. across i) pairs of tracts/regions in each hemisphere (n ¼ 22/21), ii) homologous tracts/regions of left and right hemispheres (n ¼ 22/21), and iii) pairs of tracts and regions in each hemisphere (n ¼ 21). For each paired comparison, we used partial correlations over the group, con-trolling for age. P-values were corrected for the number of comparisons in each hemisphere condition (e.g. all pairs of tracts in the left hemi-sphere) using FDR approach.
We also tested whether asymmetry indices in diffusivity parameters were related to each other across tracts/regions using Pearson correla-tions (these measures did not depend on the infants’ age). Although no asymmetry index can be computed for callosal fibers, we included this tract as it is since it might interplay with other asymmetries for the development of lateralization.
2.4.4. Relationships between the structural and functional markers of maturation
Finally, we aimed to examine the relationships between functional and structural markers of maturation in infants who had both EEG (monaural paradigm) and DTI datasets. In the following analyses, we considered left and right measures independently when hemispheric asymmetry was observed based on previous analyses. Otherwise, the averaged value was used in order to limit the number of comparisons.
Following our studies of the visual modality (Dubois et al., 2008;
Adibpour et al., 2018a), we first compared the maturational properties of auditory-evoked responses and of white matter tracts (n ¼ 16). As latencies are assumed to depend both on the fibers myelination and on the distance the neural signal travels, we considered a marker of speed, defined as the ratio between the fiber length and latency. We approxi-mated the length of auditory pathways by the distance between the two ears measured on MRI images for each infant. We then analyzed whether the speed of P2 responses (averaged contralateral, left and right ipsi-lateral) was related to the transverse diffusivity in tracts that might contribute to neural propagation in this network (left and right acoustic radiations, arcuate fascicles, and auditory callosal fibers). We performed partial correlations over the group, controlling for the infants’ age, and corrected for multiple comparisons in each tested condition using FDR approach. Note that contrarily to our visual study (Adibpour et al., 2018a), we could not directly measure the inter-hemispheric transfer of responses in the auditory modality, because responses to monaural stimuli originate from both contralateral and ipsilateral pathways and are observed quite simultaneously in both hemispheres (Adibpour et al., 2018b).
Since the microstructure of cortical regions might also contribute to
the properties of P2 responses during infancy, we performed similar analyses considering longitudinal diffusivity in the different perisylvian regions (n ¼ 15). Following a recent study comparing the visual and auditory modalities in the aging population (Price et al., 2017), we primarily considered relationships with P2 latencies (results for P2 speeds are reported in supplementary information). As previously, we performed partial correlations over the group, controlling for the in-fants’ age, and we corrected for multiple comparisons in each tested condition using FDR approach.
Furthermore, we investigated whether the asymmetry indices in functional and structural markers were related using Pearson correla-tions, and considering i) P2 speeds vs white matter tracts (n ¼ 16) and ii) P2 latencies vs cortical regions (n ¼ 15).
3. Results
3.1. Development and asymmetry of P2 functional responses
Fig. 1 presents the ERP topographies in each experimental task. The positive pole of the P2 component extended more over the frontal midline areas in the case of binaural compared with monaural stimu-lation. While we observed brain responses on both brain sides following monaural stimulation, the contralateral responses were larger and more extended than the ipsilateral ones, whatever the side of stimulation.
3.1.1. P2 amplitude
When stimulation was binaural (Table 1a), ANCOVA revealed a weak non-significant trend of hemispheric difference with larger amplitude in the left than right hemisphere, but no effect of age nor interaction between age and hemisphere. Regarding monaural stimu-lation (Table 1b), only a weak non-significant trend of response side difference was observed due to larger amplitude in the contralateral than ipsilateral side. Asymmetry indices for contralateral and ipsilateral amplitudes (Fig. 2a) were not related to each other (r ¼ 0.06, p ¼ 0.786).
3.1.2. P2 latency
ANCOVA (Table 1a) showed a main effect of age (latency decreased with age: Fig. 1a), but no difference between hemispheres, nor inter-action between age and hemisphere when stimulation was binaural. For monaural stimulation (Table 1b), we also observed a main effect of age (latency decreased with age: Fig. 1b), as well as a main effect of response side, with an interaction between side and hemisphere. Post hoc ana-lyses (Table 1b) revealed that i) P2 latency was longer on the ipsilateral than contralateral side whatever the hemisphere, and ii) ipsilateral re-sponses had longer latency in the left than right hemisphere, whereas no hemispheric difference was seen for contralateral responses. Asymmetry indices in contralateral and ipsilateral latencies (Fig. 2b) were not related to each other (r ¼ 0.19, p ¼ 0.445).
3.2. Development and asymmetry of auditory structural substrates 3.2.1. White matter
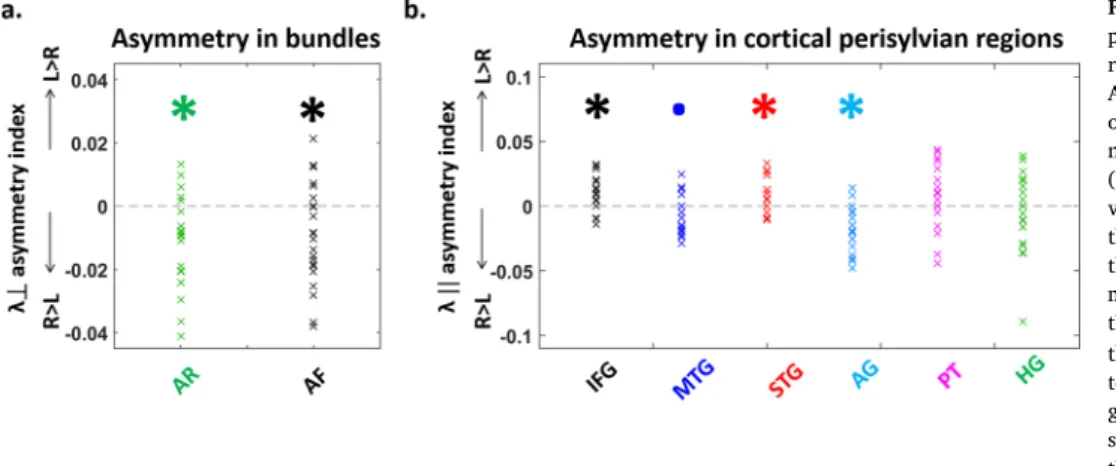
Tracts were precisely reconstructed in each infant with tractography (Fig. 3a). A first ANCOVA on transverse diffusivity averaged over left and right acoustic radiations, arcuate and auditory fibers of the corpus callosum (Table 2a) revealed a main effect of age (diffusivity decreased with age: Fig. 3a), as well as a main effect of tract but no interaction age x tract. A second ANCOVA separating the left and right AR and AF (Table 2a) confirmed these effects and showed a main effect of hemi-sphere, but no interaction of age with the other factors (2-way and 3- way interactions were not significant). In other words, the degree of tract asymmetries was not changing with age during this period. Then, we performed selected post hoc tests to compare the different tracts within each hemisphere, as well as left vs. right homologous tracts (Table 2a). Within a hemisphere, tracts demonstrated significant microstructural differences following a gradient of λ? values (from
higher to lower ones: AF > AR > ACC, Fig. 3a). Across hemispheres, λ?
was higher in the right AR and AF relatively to their left homologs (Fig. 4a). Partial correlations of λ? values controlling for age
de-pendences revealed that despite their microstructural differences, several tracts shared common maturational patterns (Sup Table 1a):
homologous tracts, AR and AF within each hemisphere, and bilateral AF with ACC. This suggested that most pathways are maturing in synchrony despite being at different maturational stages. Yet, the AR and AF asymmetry indices were not related to each other, nor with the ACC microstructure (in all the 3 comparisons: r<0.20, p > 0.89 after correction for multiple comparisons).
3.2.2. Grey matter
Perisylvian cortical regions were identified in each infant based on individual parcellation (Fig. 3b). ANCOVA on longitudinal diffusivity (Table 2b) revealed a main effect of age (diffusivity decreased with age in all regions: Fig. 3b), of region but no effect of hemisphere. The interaction region x hemisphere was significant, while the others were not. Selected post hoc analyses detailed the microstructural differences across regions, within each hemisphere and across hemispheres for ho-mologous regions (Table 2b). They revealed a gradient of λ// values
(from higher to lower ones: in the left hemisphere IFG > MTG > STG > AG > PT > HG; in the right hemisphere MTG ~/> AG ~ IFG > STG > PT ~ HG, Fig. 3b). Regarding hemispheric asymmetries, higher diffusivity values were observed in the right AG and MTG relative to the left ho-mologues, and in the reverse direction (L > R) for IFG and STG (Fig. 4b). Despite these microstructural differences, partial correlations of λ//
values controlling for age dependences revealed common maturational patterns across regions (Sup Table 1b). Except for PT and HG for which results were less clear-cut, homologous (left and right) regions were related, as well as each pair of regions (IFG, AG, STG and MTG) within each hemisphere. Besides the asymmetry indices across regions were not related to each other (in all the 15 comparisons: r<0.37, p > 0.54 after correction for multiple comparisons).
We also evaluated the links between the different structural sub-strates composing the auditory network. Partial correlations between pairs of white matter tracts (considering λ?) and cortical regions
(considering λ//) revealed reduced common maturational patterns
beyond the age effects (Sup Table 2). The most significant ones regarded the right hemisphere, particularly right AR with right IFG; right AF with right IFG/STG/AG; ACC with right AG. Besides, the asymmetry indices across pairs of tract and region were not related to each other (in the 3 groups of 6 comparisons r<0.40, p > 0.42).
3.3. Relationships between the structural and functional markers of maturation
To reduce the number of comparisons, we took into account the re-sults of hemispheric asymmetries to further analyze the relationships between latencies, speeds and the microstructural properties of tracts and regions. When no asymmetry was observed, we considered averaged values (i.e. for contralateral P2 response, PT and HG). In the other cases
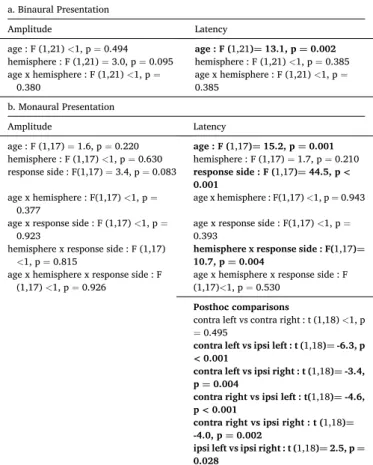
Table 1
Summary of ANCOVA results for the amplitude and latency of P2 responses to binaural (a) monaural (b) syllables.
a. Binaural Presentation Amplitude Latency age : F (1,21) <1, p ¼ 0.494 age : F (1,21)¼ 13.1, p ¼ 0.002 hemisphere : F (1,21) ¼ 3.0, p ¼ 0.095 hemisphere : F (1,21) <1, p ¼ 0.385 age x hemisphere : F (1,21) <1, p ¼ 0.380 age x hemisphere : F (1,21) <1, p ¼0.385 b. Monaural Presentation Amplitude Latency age : F (1,17) ¼ 1.6, p ¼ 0.220 age : F (1,17)¼ 15.2, p ¼ 0.001 hemisphere : F (1,17) <1, p ¼ 0.630 hemisphere : F (1,17) ¼ 1.7, p ¼ 0.210 response side : F(1,17) ¼ 3.4, p ¼ 0.083 response side : F (1,17)¼ 44.5, p <
0.001
age x hemisphere : F(1,17) <1, p ¼
0.377 age x hemisphere : F(1,17) <1, p ¼ 0.943 age x response side : F (1,17) <1, p ¼
0.923 age x response side : F(1,17) <1, p ¼0.393 hemisphere x response side : F (1,17)
<1, p ¼ 0.815
hemisphere x response side : F(1,17)¼ 10.7, p ¼ 0.004
age x hemisphere x response side : F
(1,17) <1, p ¼ 0.926 age x hemisphere x response side : F (1,17)<1, p ¼ 0.530
Posthoc comparisons
contra left vs contra right : t (1,18) <1, p ¼0.495
contra left vs ipsi left : t (1,18)¼ -6.3, p < 0.001
contra left vs ipsi right : t (1,18)¼ -3.4, p ¼ 0.004
contra right vs ipsi left : t(1,18)¼ -4.6, p < 0.001
contra right vs ipsi right : t (1,18)¼ -4.0, p ¼ 0.002
ipsi left vs ipsi right : t (1,18)¼ 2.5, p ¼ 0.028
Amplitudes and latencies were considered as the dependent variable in separate ANCOVA models with age, hemisphere (left/right) and response side (contra-lateral/ipsilateral in the case of monaural syllables) entered as independent variables (1 covariate and 2 within-subject factors).
For responses to monaural syllables, further post hoc analyses were performed to compare pairs of P2 latencies using paired t-test comparisons (p-values were corrected for the number of comparisons using FDR approach: c ¼ 6). Significant (p < 0.05) comparisons are indicated in bold.
Fig. 2. Hemispheric differences in the amplitude and latency of P2 peaks.
Asymmetry indices (Left-Right)/(Left þ Right) for P2 amplitude (a) and latency (b) in the different paradigms: binaural (n ¼ 23) and monaural syllables (n ¼ 19: contralateral and ipsilateral responses). The latency of ipsilateral responses to monaural syllables was significantly slower over the left than right cluster, in other words the ipsilateral response for a left ear syllable was slower than for a right ear syllable (*: p < 0.05). Statistical analyses are detailed in Table 1.
(i.e. for measures showing asymmetries), we analyzed left and right values independently (i.e. for ipsilateral P2 responses, AR and AF tracts, IFG, MTG, STG and AG regions).
Similarly to our visual studies (Dubois et al., 2008; Adibpour et al., 2018a), we first evaluated the relationships between the microstructure of auditory tracts (λ?) and the conduction speed of P2 responses. Partial
correlations controlling for age effects (Table 3a) were non-significant for the acoustic radiations and arcuate fascicles but showed a trend for the auditory callosal fibers and the left ipsilateral P2 response (Fig. 5a). Although this result did not survive correction for multiple comparisons, it might suggest that the ipsilateral P2 response in the left hemisphere is modulated by the arrival of information from the right hemisphere through the callosal fibers, consistently with a previous independent study comparing infants with corpus callosum agenesis and typical in-fants (Adibpour et al., 2018b). Besides the asymmetry indices in P2 speeds and tracts microstructure were not related to each other (in the 2 groups of 3 comparisons r<0.42, p > 0.32).
Regarding the relationships between the microstructure of cortical regions (λ//) and P2 characteristics, we only observed links for the
averaged latency of contralateral P2 responses with the left and right IFG (Table 3b, Fig. 5b, c). When P2 speed was considered rather than la-tency, results were similar but less significant (Sup Table 3). Finally, the asymmetry indices in P2 latencies and regions microstructure were not related to each other (in the 2 groups of 6 comparisons: r<0.50, p > 0.35).
4. Discussion
In this study, we explored the maturation of the auditory system during the first postnatal semester both from a functional and a struc-tural perspective. We showed that the auditory P2 response tends to be
of higher amplitude in the left than right hemisphere following binaural stimulations, and in the contra- than ipsilateral hemisphere following monaural ones. We also observed longer latency for ipsi- than contra-lateral responses particularly in the left hemisphere, which might reflect an asymmetric inter-hemispheric transfer of responses. We further highlighted a number of microstructural asymmetries in acoustic radi-ations and arcuate fascicles for white matter, and in inferior frontal, angular, medial and superior temporal gyri for the cortex. Besides, we demonstrated intense developmental changes in P2 latencies, auditory tracts and perisylvian regions during this period. When evaluating the links between the functional and structural indices of maturation, we showed limited relationships between the response speeds and the microstructure of underlying white matter pathways: some trend was only observed between callosal fibers and left ipsilateral responses, consistently with a previous study (Adibpour et al., 2018b). Finally, the latency of contralateral P2 responses was related to the microstructural properties of the inferior frontal gyri.
4.1. Early markers of functional lateralization
Firstly, we studied the lateralization of P2 responses in two different auditory stimulation tasks in two groups of infants. Regarding P2 amplitude, we observed a weak lateralization in favor of the left hemi-sphere following the binaural presentation of syllables, suggesting a left dominance in processing consonant-vowel syllables. This is relatively coherent with previous functional MRI (fMRI) studies of young infants, in which activations to speech stimuli were reported to be larger in the left than right planum temporale or in the left temporal lobe in general, notably relative to non-linguistic stimuli (Dehaene-Lambertz et al., 2002, 2010; Shultz et al., 2014).
In the monaural paradigm, we did not find any left-right difference
Fig. 3. Maturation of the linguistic pathways and perisylvian regions quantified with diffu-sion MRI.
a: Left panel: Example of tract reconstructions in a 12-week-old infant superposed on the map of DTI anisotropy: acoustic radiations (AR), auditory fibers of the corpus callosum (ACC) and arcuate fasciculus (AF). Right panel: Transverse diffusivity (λ?) plotted as a function
of infants’ age in each tract (left and right values are averaged). Major age-related de-creases are observed (n ¼ 22).
b: Left panel: 3D parcellation atlas of a 10- week-old infant showing the studied regions: Heschl’s gyrus (HG), planum temporale (PT), superior and middle temporal gyri (STG, MTG), angular and inferior frontal gyri (AG, IFG). Right panel: Longitudinal diffusivity (λjj)
plotted as a function of infants’ age in each region (left and right values are averaged). Major age-related decreases are observed (n ¼ 21).
for P2 amplitude, perhaps because this was alleviated by the strong contra-laterality effect that we observed whatever the ear of stimulation. We also suspect that P2 responses and their lateralization might have been modulated by the orientation of attention to the sides of the auditory space. Indeed, the side of syllable presentation remained con-stant within each block of trials, allowing infants to direct their attention towards one ear or the other. In dichotic listening tasks where subjects are asked to report the perceived syllable, reports from the right ear are generally more accurate than the left ear (this is known as the right ear advantage). However, in these tasks, overt attention to a given side al-ters perceptual performances such that the right ear advantage is increased when the right ear is attended, and decreased or even reversed when the left ear is attended (Hugdahl and Westerhausen, 2016). Therefore, responses in the context of the binaural paradigm (when spatial attention was not solicited) might better represent the intrinsic lateralization in our infant studies.
Regarding P2 latency, we observed a delay in ipsilateral compared to contralateral responses when syllables were presented monaurally, whereas in a previous study (Adibpour et al., 2018b), such a delay was observed only when the stimulus (“babble noise” corresponding to overlaid segments of speech) was presented in the left ear. This differ-ence might be explained by experimental variations: in the latter study, the side of presentation was randomly chosen at each trial while here, the side of the presentation alternated across blocks of 48 trials, prob-ably leading to sensory priming within blocks.
Finally, we observed a delay in the left ipsilateral responses compared to the right equivalent. It is consistent with our previous study showing a similar asymmetric pattern of responses in another group of typical infants of the same age (Adibpour et al., 2018b). However, because this delay was not seen in infants with corpus callosum agenesis, we attributed it to an inter-hemispheric transfer of information via the callosal connections. The spatial resolution of EEG cannot disentangle the direct ipsilateral and transcallosal responses, which progressively merge and thus might delay the P2 peak that we measured. Because this delay is seen only for the left ipsilateral response and not the right, it suggests an asymmetric transfer of information, prominent from the right to the left hemisphere. A recent study in adults also described asymmetry in the auditory inter-hemispheric connectivity: TMS applied over the right (but not the left) auditory regions changes the functional connectivity between these regions during resting-state, in proportion with the volume of auditory callosal fibers (Andoh et al., 2015). Simi-larly, some studies have reported broader inter-hemispheric functional connectivity for the regions of the right hemisphere, but stronger intra-hemispheric connectivity for the left hemisphere, especially for linguistic areas (Gotts et al., 2013). Our two studies in infants thus suggest that the asymmetric pattern of inter-hemispheric connectivity is already observed in early development.
4.2. Early structural asymmetries between hemispheres
Acoustic radiations and arcuate fascicles showed lower diffusivities in the left than right tracts, suggesting more complex, denser or more mature patterns of microstructure in the left than right tracts. Acoustic radiations have not been studied in infants so far, but leftward DTI asymmetries have already been reported for the arcuate fasciculus during the first postnatal semester, both in its structure and its faster left maturation (Dubois et al., 2009, 2016b). In adults, previous post-mortem findings have reported more myelinated axons in the left than in the right posterior superior temporal lobe, an area posterior to acoustic radiations (Anderson et al., 1999). Nevertheless, our results should be
Table 2
Summary of ANCOVA results for DTI parameters in white matter tracts (a) and perisylvian cortical regions (b).
Structural maturation a. White matter tracts
ANCOVA with all tracts averaged over hemispheres age : F (1,20)¼ 62.6, p < 0.001
tract : F (2,40)¼ 64.5, p < 0.001
age x tract : F (2,40) < 1, p ¼ 0.734
ANCOVA with only AR and AF age : F (1,20)¼ 47.6, p < 0.001 tract : F (1,20)¼ 59.2, p < 0.001 hemisphere : (1,20)¼ 14.8, p ¼ 0.001 age x tract : F (1,20) <1, p ¼ 0.457 age x hemisphere : F (1,20) <1, p ¼ 0.914 tract x hemisphere : F (1,20) <1, p ¼ 0.673 age x tract x hemisphere : F (1,20) <1, p ¼ 0.796
Posthoc comparisons Left Hemisphere AF vs. AR, t(1,21)¼ 7.9, p < 0.001 AF vs. ACC, t(1,21)¼ 9.4, p < 0.001 AR vs. ACC, t(1,21) ¼ 1.7, p ¼ 0.096 Right Hemisphere AF vs. AR, t(1,21)¼ 5.6, p < 0.001 AF vs. ACC, t(1,21)¼ 15.9, p < 0.001 AR vs. ACC, t(1,21)¼ 4.5, p < 0.001 Left vs Right tracts
AF, t(1,21)¼ -2.7, p ¼ 0.014 AR, t(1,21)¼ -3.7, p ¼ 0.002 b. Perisylvian regions age : F (1,19)¼ 51.5, p < 0.001 region : F (5,95)¼ 101.5, p < 0.001 age x hemisphere : F (1,19) <1, p ¼ 0.379 region x hemisphere : F (5,95)¼ 7.5, p < 0.001
age x region x hemisphere : F (5,95) ¼ 1.4, p ¼ 0.233
Posthoc comparisons Left Hemisphere IFG vs. MTG, t(1,20)¼ 2.3, p ¼ 0.031 MTG vs. STG, t(1,20)¼ 3.6, p ¼ 0.002 STG vs. AG, t(1,20)¼ 2.3, p ¼ 0.033 AG vs. PT, t(1,20)¼ 3.7, p ¼ 0.002 PT vs. HG, t(1,20)¼ 3.2, p ¼ 0.005 Right Hemisphere MTG vs. IFG, t(1,20)¼ 2.2, p ¼ 0.050 MTG vs. AG, t(1,20) ¼ 1.5, p ¼ 0.182 AG vs. IFG, t(1,20) ¼ 1.2, p ¼ 0.265 IFG vs. STG, t(1,20)¼ 3.7, p ¼ 0.002 AG vs. STG, t(1,20)¼ 6.0, p < 0.001 STG vs. PT, t(1,20)¼ 7.0, p < 0.001 STG vs. HG, t(1,20)¼ 6.6, p < 0.001 PT vs. HG, t(1,20) <1, p ¼ 0.668
Left vs Right regions IFG, t(1,20)¼ 3.9, p ¼ 0.004 MTG, t(1,20)¼ -2.1, p ¼ 0.067 STG, t(1,20)¼ 2.5, p ¼ 0.044 AG, t(1,20)¼ -4.6, p < 0.001 PT, t(1,20) ¼ 1.3, p ¼ 0.252 HG, t(1,20) <1, p ¼ 0.461
Transverse and parallel diffusivities were considered as the dependent variables in the ANCOVA models, with age, tract/region, hemisphere (left/right) entered as independent variables (1 covariate and 2 within-subject factors for the models of bilateral tracts and perisylvian regions). An additional ANCOVA is presented for combined left and right tracts (i.e. averaged transverse diffusivity over left and right acoustic radiations AR and arcuate fascicles AF) to include auditory fibers of the corpus callosum ACC without the hemisphere factor.
We further selected post hoc analyses and performed comparisons between selected pairs of tracts/regions using paired t-tests: within each hemisphere (c ¼ 3 for tracts, c ¼ 15 for regions), and across hemispheres for homologous tracts/ regions (c ¼ 2 for tracts, c ¼ 6 for regions). Abbreviations used for the tracts/ regions names are identical to those of Fig. 3. P-values were corrected using FDR approach for the number of comparisons within each hemisphere condition. For the sake of simplicity, we present only the pairs of regions with the least sig-nificant results (all the other comparisons show more significance and can be derived from these pairs). Significant (p < 0.05) comparisons after FDR
correction are marked in bold, while those significant comparisons before correction that did not reach the significance threshold of p < 0.05 after correction, are highlighted in italic bold. For the comparisons within each hemisphere, the pairs of tracts/regions were ordered to highlight the gradient of λ?/ λ// values (from higher to lower ones).
interpreted with caution because the acoustic radiations are quite short in length, and they partially cross the optic radiations in their path be-tween the thalamus and the auditory cortex. Although their recon-struction with probabilistic tractography (Behrens et al., 2007) was feasible despite infants’ immature fibers, it was still challenging because of the limited spatial resolution relatively to infant brain size. Thus, our DTI parameters might be prone to partial volume effects with other tracts. Further work is needed to confirm the presence of this acoustic radiation asymmetry in infants and investigate how it relates to other regional asymmetries.
Asymmetries in the perisylvian cortical areas were observed in favor of both hemispheres, with more advanced maturation (lower longitu-dinal diffusivity) relatively to their homologues, in the right hemisphere for inferior frontal and superior temporal gyri, and in the left
hemisphere for angular and middle temporal gyri. These observations are partly in agreement with previous findings based on T2w intensity, in which we showed rightward STS asymmetry (Leroy et al., 2011). This latter study was limited to the sulci whereas here, parameters were averaged across relatively large parcels covering the gyri. These DTI asymmetries might be explained by two possible factors. On one hand, homologous tissues might have differences in cells and organelles den-sity from birth on, due to genetic or epigenetic factors, and this would extend throughout lifespan. For example, the columns are wider and with more neuropil space in the left than right planum temporale in the adult brain (Buxhoeveden et al., 2001), which certainly impacts DTI parameters. On the other hand, these differences might be due to tran-sient asynchronies in left-right maturation engendering a different development of dendritic arborization and intra-cortical myelination (i.
Fig. 4. Hemispheric differences in the DTI properties of white matter tracts and cortical regions.
Asymmetry indices (Left-Right)/(Left þ Right) of DTI parameters in the white matter tracts (a, n ¼ 22) and in the cortical perisylvian regions (b, n ¼ 21). a. Lower transverse diffusivity (λ?)
values in the left acoustic radiations (AR) and the left arcuate fasciculus (AF) compared to their right counterparts suggest a more mature microstructure in the left tracts. b. Similarly, the lower longitudinal diffusivity (λjj) in the left
than right angular gyrus (AG) and middle temporal gyrus (MTG) to a lesser extent, sug-gests more mature regions in the left hemi-sphere. The reverse pattern was observed for the inferior frontal (IFG) and superior temporal (STG) gyri, suggesting a more mature micro-structure in the right hemisphere for these re-gions (statistical analyses are detailed in
Table 2 ; asterisks represent significant differ-ences from zero at p < 0.05, and dots a marginally significant trend at p < 0.1). Table 3
Relationships between the structural and functional markers of maturation.
a
Left AR Right AR Left AF Right AF ACC average P2 contra r ¼ 0.15, p ¼ 0.991 r < 0.01, p ¼ 0.991 r ¼ 0.14, p ¼ 0.991 r <0.01, p ¼ 0.991 r ¼ -0.05, p ¼ 0.991 Left P2 ipsi r ¼ -0.08, p ¼ 0.763 r ¼ -0.25, p ¼ 0.598 r ¼ -0.16, p ¼ 0.702 r ¼ -0.36, p ¼ 0.475 r ¼ -0.52, p ¼ 0.243 Right P2 ipsi r ¼ 0.26, p ¼ 0.817 r ¼ 0.06, p ¼ 0.817 r ¼ 0.10, p ¼ 0.817 r ¼ 0.36, p ¼ 0.817 r ¼ 0.14, p ¼ 0.817 b
Left IFG Right IFG Left MTG Right MTG Left STG Right STG Left AG Right AG average PT average HG average P2 contra r ¼ 0.67, p ¼ 0.043 r ¼ 0.70, p ¼ 0.043 r ¼ 0.44, p ¼ 0.478 r ¼ 0.47, p ¼ 0.219 p ¼ 0.393 r ¼ 0.34, r ¼ 0.34, p ¼ 0.393 r ¼ 0.48, p ¼ 0.219 r ¼ 0.29, p ¼ 0.397 r ¼ 0.21, p ¼ 0.478 r ¼ 0.31, p ¼ 0.354 Left P2 ipsi r ¼ 0.15, p ¼ 0.782 r ¼ 0.14, p ¼ 0.782 r ¼ 0.37, p ¼ 0.540 r ¼ 0.06, p ¼ 0.876 p ¼ 0.782 r ¼ 0.22, r ¼ 0.18, p ¼ 0.782 r ¼ 0.04, p ¼ 0.876 r ¼ 0.46, p ¼ 0.480 r ¼ 0.546, p ¼ 0.430 r ¼ 0.35, p ¼ 0.540 Right P2 ipsi r ¼ 0.11, p ¼ 0.994 r ¼ -0.02, p ¼ 0.994 r ¼ -0.26, p ¼ 0.994 r < 0.01, p ¼ 0.994 p ¼ 0.994 r < 0.01, r ¼ -0.51, p ¼ 0.530 r ¼ 0.45, p ¼ 0.530 r ¼ -0.13, p ¼ 0.994 r ¼ -0.11, p ¼ 0.994 r ¼ -0.33, p ¼ 0.825
a: Correlation analyses between P2 speeds (contralateral responses averaged over both hemispheres; left and right ipsilateral responses) and the microstructure of auditory tracts (transverse diffusivity λ?for left and right AR, AF and ACC), based on partial correlations taking into account the age effects (n ¼ 16). P-values were
corrected for the number of comparisons made for each P2 response (c ¼ 5) using FDR approach. The only observed effect was a trend for the speed of left ipsilateral response that correlated with the auditory callosal fibers (uncorrected p ¼ 0.049, corrected p ¼ 0.243 highlighted italic bold, Fig. 5a) but it did not survive the correction for multiple comparisons.
b: Correlation analyses between P2 latencies (contralateral responses averaged over both hemispheres, as well as left and right ipsilateral responses) and the microstructure of perisylvian regions (longitudinal diffusivity λjjfor left and right regions when an asymmetry was observed, or averaged over both hemispheres),
based on partial correlations taking into account the age effects (n ¼ 15). P-values were corrected for the number of comparisons made for each P2 latency (c ¼ 10) using FDR approach. Significant (p < 0.05) comparisons after FDR correction are marked in bold, while those significant comparisons before correction that did not reach the significance threshold of p < 0.05 after correction, are highlighted in italic bold. The only significant relationships after correction were between the latency of averaged contralateral response and the left and right inferior frontal gyri (Fig. 5b,c). See Sup Table 3 for similar analyses with P2 speeds.
e. faster maturation in a region of one hemisphere relatively to its counterpart). Distinguishing these two aspects would require studying infants relatively to an adult population, as we have recently done to compare the maturation of dorsal and ventral linguistic pathways throughout infancy (Dubois et al., 2016b). Such an analysis was not possible here. In any case, the difference in hemispheric asymmetries between the superior and middle temporal gyri would need to be further explored as it could be one of the relevant markers distinguishing gen-eral auditory vs. linguistic regions.
4.3. Maturational evolution of functional and structural auditory markers
As expected from the literature (Barnet et al., 1975; Novak et al., 1989; Kushnerenko et al., 2002; for a review see Wunderlich and Cone-Wesson, 2006), P2 latency decreased with the infants’ increasing age in all experimental conditions. This suggests an improvement in functional efficiency over the first postnatal months. As detailed in the last section of the discussion, numerous processes along the auditory pathways probably contribute to this improvement (e.g. maturation of cochlea, brainstem nuclei, auditory cortices and other cortical sources, as well as the myelination of auditory white matter pathways).
In the white matter (acoustic radiations, arcuate fascicles and cal-losal fibers), transverse diffusivity consistently decreased with the in-fants’ age, suggesting intense myelination of the pathways (Dubois et al., 2014a; Yakovlev and Lecours, 1967b). In the grey matter, longitudinal diffusivity also decreased with infants’ age. Various developmental mechanisms involved in grey matter maturation at this age might underly these changes, including the development of dendritic arbori-zation (Ball et al., 2013), the increase in synaptic density, the myeli-nation of intra-cortical fibers (Lebenberg et al., 2019a) or the changes in intracellular organelle density (for a review see (Ouyang et al., 2019)). A recent study using another diffusion-based method (neurite orientation dispersion and density imaging: NODDI) also pointed to the increasing cellular and organelle densities around the term period as sources of developmental changes in diffusion parameters (Batalle et al., 2019). Overall, our results confirmed that tracts and regions were at different microstructural stages, which was consistent with the post-mortem and in
vivo descriptions of maturational progression: associative white matter
pathways lag behind the sensory projection pathways (Yakovlev and Lecours, 1967b), and multi-modal cortices lag behind the primary ones (Brody et al., 1987; Leroy et al., 2011). Nevertheless, as discussed above, these tracts and regions have also different microstructural organization at the mature stage (Dubois et al., 2014a, 2016b; Fukutomi et al., 2018). Thus, interpreting DTI differences in terms of maturation should be done cautiously without pondering over adult measures.
4.4. Relationships between the functional and structural markers of maturation
MRI data were acquired only for the second EEG group of infants, limiting the number of structure-function relationships that we could analyze. Although we might have expected that the functional laterali-zation in auditory responses was dependent on structural asymmetries, we did not observe such a relationship. In particular, the asymmetry in AR microstructure did not translate in P2 latency differences across hemispheres, perhaps because this late component is less sensitive to AR inputs than earlier components. However, such early peaks are difficult to identify in each infant with EEG, and MEG might be a more sensitive technique to be considered in the future for such purposes. So in our cohort and with our technique we could not directly relate asymmetries in cortical microstructure to asymmetries of functional responses. Nevertheless, the microstructural asymmetry of angular gyrus we report might be related to the leftward asymmetry of fMRI activations in the angular gyrus reported previously in 3-months old infants listening to speech (Dehaene-Lambertz et al., 2002).
Regarding developmental changes, we first expected that the mye-lination of auditory pathways would increase P2 speed, in particular for the acoustic radiations since their myelination starts after birth and progresses slowly until 3–4 years of age (Yakovlev and Lecours, 1967b). Nevertheless, we did not observe any direct relationship, contrarily to our findings in the visual system that highlighted some for P1 speed and optic radiations, P1 interhemispheric transfer and visual callosal fibers (Adibpour et al., 2018a; Dubois et al., 2008). Actually, auditory P2 is a relatively late cortical response that probably arises from computations engaging multiple generators varying with the task and maturing in a complex way. In support of this view, EEG modelling approaches of P2 responses evoked by vowels and tones have proposed cortical sources in the superior temporal, supra-marginal and inferior frontal gyri in two-month-old infants (Basirat et al., 2014; Bristow et al., 2009), or in the anterior cingulate and temporal regions for 6-month-olds ( Ortiz--Mantilla et al., 2012). Imada et al. (2006) also reported superior tem-poral and inferior frontal sources using MEG in 6 and 12 month-olds (Imada et al., 2006). These studies hypothesized that inferior frontal regions are involved in syllable perception, which might explain the relationship we observed between the latency of P2 contralateral re-sponses and the IFG microstructure. On the other hand, a recent study of the aging population suggested that structure-function relationships differ between the visual and auditory modalities (Price et al., 2017). For this latter one, cumulative delays in evoked responses were related to differences in the gray matter volume of superior temporal regions, but not in auditory tracts (Price et al., 2017). This highlights the importance
Fig. 5. Relationships between P2 characteristics and the microstructural properties of the language network.
a: The speed of ipsilateral P2 response in the left hemisphere tended to be related to transverse diffusivity (λ?) in the auditory callosal fibers after controlling for age
effects (n ¼ 16, Table 3a).
b/c: The latency of averaged contralateral responses was related to longitudinal diffusivity (λjj) in the left (b) and right IFG (c), after controlling for age effects (n ¼
15, Table 3b).
The plots represent the residuals in each parameter, after regressing out the effect of age. The partial correlation coefficients (r) and the corrected p values are indicated similarly to Table 3, as well as raw (uncorrected) p values.