ARSENIC SPECIATION AND EVALUATION OF AN
ADSORPTION MEDIA IN RUPANDEHI AND
NAWALPARASI DISTRICTS OF NEPAL
by
Tommy Ka Kit Ngai
B.A.Sc. Chemical and Environmental Engineering University of Toronto 2001
Submitted to the Department of Civil and Environmental Engineering in Partial Fulfillment of the Requirements for the Degree of
MASTER OF ENGINEERING IN CIVIL AND ENVIRONMENTAL ENGINEERING at the
MASSACHUSETTS INSTITUTE OF TECHNOLOGY
June 2002
( 2002 Tommy K.K. Ngai. All Rights Reserved.
The author hereby grants to MIT permission to reproduce and to distribute publicly paper and electronic copies of this thesisdocument in whole or in part.
Signature of Author:.
/
j -
fTommy
Ka Kit Ngaiepartm nt of vil and Environmental Engineering
t I May 15, 2002
Certified by:
Susan E. Murcott Lecturer, Department of Civil and Environmental Engineering hesis Supervisor Accepted by:
Oral Buyukozturk
MASSACHUSETTS IN PUTF Chairman, Departmental Committee on Graduate Studies OF TECHNOLOGY
F
JUN
3 2002
BARKERARSENIC SPECIATION AND EVALUATION OF AN
ADSORPTION MEDIA IN RUPANDEHI AND
NAWALPARASI DISTRICTS OF NEPAL
by
Tommy Ka Kit Ngai
Submitted to the Department of Civil and Environmental Engineering on May 15, 2002 in partial fulfillment of the requirements for the degree of
Master of Engineering in Civil and Environmental Engineering
ABSTRACT
A study of arsenic speciation in the drinking water of Nepal and an evaluation of an arsenic adsorption media was conducted as part of the 2001-2002 Massachusetts Institute of Technology Nepal Water Project. Over 40 tubewell water samples were collected in the Nawalparasi and Rupandehi Districts of Nepal where arsenic contamination is known to occur. Arsenic (III) and arsenic (V) in the raw water were separated using Bio-Rad AG1-X8 strong ion exchange resin. Arsenic concentration was analyzed in Nepal using Industrial Test Systems Quick Arsenic Test Kit. Samples were also preserved and brought back to MIT for analysis using Graphite Furnace Atomic Absorption Spectrometry. Results showed that arsenic (III) is the dominant inorganic arsenic species. On average, 79% of all inorganic arsenic is in the (+III) oxidation state, while the rest is in (+V) oxidation state. There is a strong correlation between arsenic
speciation and the oxidation reductive potential (ORP) as measured by a Digi-Sense Digital pH/mV/ORP Meter.
An activated alumina manganese oxide (A/M) adsorption media was tested at 9 locations with total arsenic in the raw water ranging from 147 ptg/L to 863 jig/L. In all 9 runs, the treated water contained arsenic below detection limit (<5 pg/L). Based on these
promising results, further evaluation of the A/M media on its technical, social, and economic aspects is recommended.
Thesis Supervisor: Susan Murcott,
Acknowledgements
I would like to thank my thesis advisor, Ms. Susan Murcott, for coordinating this amazing project. Her genuine counsel reaches far beyond the project scope, to my personal and professional life as well. My work with her for the past year has been very positive and rewarding.
I would also like to thank Dr. Eric Adams and the Department of Civil and Environmental Engineering for making this project possible.
Thanks to the Nepal team, including Jeff Hwang, Barika Poole, Chian Siong Low, Yong Xuan Gao, Luca Morganti, Heather Lukacs, and Hannah Sullivan, for the teamwork in making the trip unforgettable.
Special thanks to the people I met in Nepal, including Ulla and Kari for their hospitality at Butwal, Kalawati for arranging my field work, Umesh and Bhim for their help in
sample collection, Devi and Dhan Bhahadur for their wonderful meals. Also thanks to Roshan and Arinita at ENPHO for organizing my Parasi work, and Upendra for making my stay comfortable. I would like to thank Bhikkhu for an enjoyable Lumbini visit. I would like to thank Professor Harry Hemond for the use of his laboratory GFAAS, and Jenny Jay for her patience in teaching me to properly use the instrument.
Thanks to my friends I met here in Boston for their support throughout the year, including my roommates, brothers and sisters at HKSBS and BCEC, and my fellow classmates. My life has been enriched by them.
Also thanks to my loving family, who are always behind me.
Finally, thank my Lord, Jesus Christ for his perfect guidance through tough times. May His will lead me in my future.
TABLE OF CONTENTS
Abstract ... 2 Table of Contents ... 4 List of Figures ... 8 List of Tables... 10 Chapter 1 Introduction ... 111.1 N epal W ater Project O verview ... 11
1.2 Project M otivation... 12
1.3 Project G oal... 12
Chapter 2 Background ... 14
2.1 Arsenic in the Environm ent... 14
2.2 Arsenic Chem istry... 14
2.2.1 A cid-base Chem istry ... 15
2.2.2 Reduction-Oxidation (redox) Chem istry... 17
2.3 A rsenic Situation in South A sia ... 19
2.4 Arsenic Situation in Nepal ... 21
2.5 Origins of Arsenic ... 22
2.5.1 Pyrite O xidation H ypothesis ... 23
2.5.2 Iron O xyhydroxide Reduction Hypothesis... 23
2.6 A rsenic Treatm ent Technologies ... 24
2.7 A lternative W ater Source ... 25
Chapter 3 H ealth Effects ... 26
3.1 Route of Entry ... 26
3.2 A cute Toxicity of Arsenic (III) and (V )... 26
3.3 Chronic Toxicity of Arsenic (III) and (V )... 27
3.3.1 D erm al... 27
3.3.2 V ascular Effects ... 28
3.3.3 Cancer... 29
Chapter 4 Analytic M ethod... 30
4.1.1 Industrial Test Systems Inc. Arsenic Checks Field Test Kit 481196...31
4.1.2 Graphite Furnace Atomic Adsorption Spectrometry (GFAAS)... 33
4.2 A rsenic Speciation... 34
4.2.1 Bio-Rad Laboratory's AG1-X8 Ion-exchange Resin... 34
4 .3 p H ... 3 6 4.3.1 Cole Parmer Digi-Sense Digital pH/mV/ORP Meter EW-5938-50... 36
4.3.2 Industrial Test Systems pH Test Strips 4800005 ... 37
4.3 Oxidation-Reduction Potential (ORP) ... 38
4.3.1 Cole Parmer Digi-Sense Digital pH/mV/ORP Meter EW-5938-50...38
4.4 T otal A lkalinity ... 38
4.4.1 Industrial Test Systems Total Alkalinity Test Strips ... 39
4.5 Total Hardness as CaCO3... ... .. ... ... . . 39
4.5.1 WaterWorksTM Total Hardness (as calcium carbonate) Test Strips...40
4.6 T otal Soluble Iron... 40
4.6.1 CHEMetsm Iron Kit K-6010... 40
4 .7 M anganese... . 4 1 4.7.1 CHEMetsm Manganese Kit K-6502 ... 41
Chapter 5 Arsenic Removal Technology ... 43
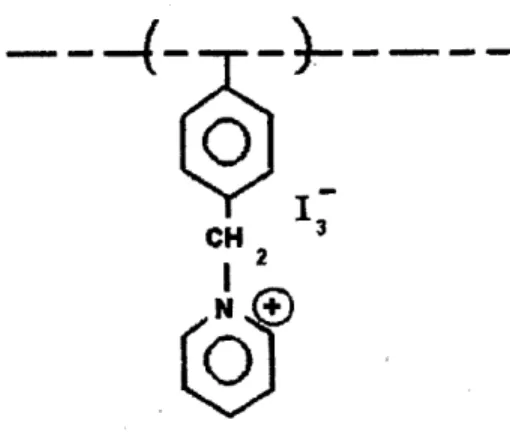
5.1 Poly-Benzyl Pyridinium Tri-Iodide (BP/I3)... 43
5.2 Activated Alumina Manganese Oxide (A/M)... 47
5.3 A pparatus Setup ... 49
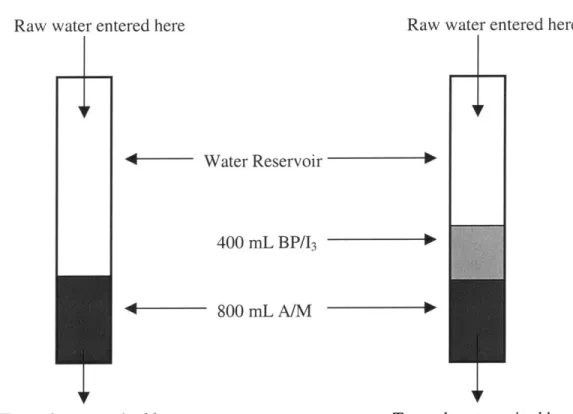
5.3.1 A /M O nly System ... 49
5.3.2 BP/13 & A/M System... 49
Chapter 6 Experiment Setup and Procedures... 52
6.1 Arsenic Removal Technology Evaluation... 52
6.1.1 A pparatus Setup ... 52
6.1.2 Field E xperim ent... 52
6.2 Arsenic Speciation of Tubewell Water ... 55
6.2.1 A pparatus Setup ... 55
6.2.2 Field E xperim ent ... 56
6.3 Arsenic Oxidation Kinetics ... 58
6.3.1 Apparatus Setup ... 58
6.3.2 Field Experiment ... 58
Chapter 7 Results and Discussions ... 60
7.1 Arsenic Removal Technology Evalution ... 60
7.1.1 Arsenic Removal Results ... 60
7 .1.2 p H R esu lts ... 64
7.1.3 Oxidation-Reduction Potential (ORP) Results...66
7.1.4 Total Alkalinity Results ... 68
7.1.5 Hardness Results ... 70
7.1.6 Total Soluble Iron Results... 71
7.1.7 M anganese Results ... 73
7.1.8 Flow Rate Results... 73
7.1.9 Summary of Important Results on the Arsenic Removal Technology...75
7.2 Arsenic Speciation in Tubewell W ater...77
7.2.1 Total Arsenic and Arsenic Speciation...77
7.2.2 Correlation with pH...83
7.2.3 Correlation with ORP...84
7.2.4 Correlation with W ell Depth ... 86
7.2.5 Correlation with Number of Users ... 90
7.2.6 Correlation with Number of Households Sharing the W ell ... 91
7.2.7 Summary of Important Results on Arsenic Speciation in Tubewell...93
7.3 Arsenic Oxidation Kinetics ... 95
7.3.1 Total arsenic and speciation results... 95
7.3.1 pH and ORP results ... 98
7.3.2 Summary of Important Results on Arsenic Oxidation Kinetics...101
Chapter 8 Conclusions and Recommendations... 102
8.1 Arsenic Removal Technology Evaluation... 102
8.2 Arsenic Speciation in Tubewell W ater...103
Appendix A Aquatic Treatment Systems, Inc. ... 105 A .1 C om p an y P rofile ... 10 5 A .2 M S D S ... 1 1 6
A .2 M SD S...117
Appendix B Parasi Survival G uide... 121
Appendix C Trip Schedule and Expense ... 124
C .1 Schedule ... 124
C.2 Project Related Expense... 125
Appendix D Contacts in Nepal ... 126
Appendix E GFA A S Results ... 128
E.1 Calibration Curves... 128
E.2 Interpolated Results... 158
Appendix F Arsenic Rem oval Technology Data ... 168
Appendix G D ID C W ell D ata M aster List ... 173
G .1 Basic W ell Inform ation ... 173
G .2 Arsenic Inform ation ... 189
A ppendix H Tubewell Speciation D ata ... 205
H .1 Basic W ell Inform ation ... 205
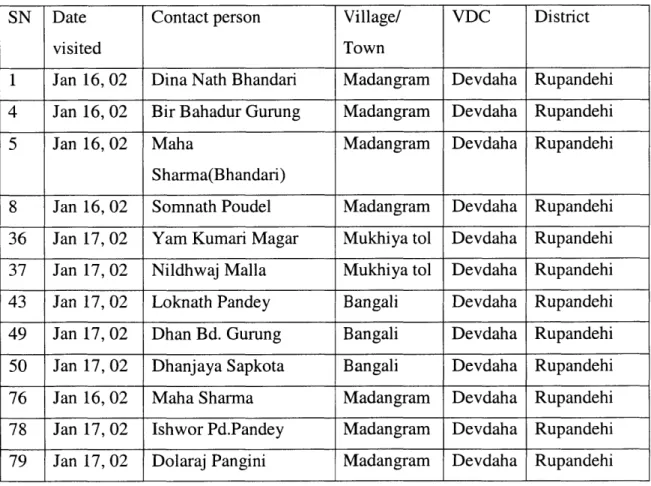
H .2 Site V isit Inform ation... 207
H .3 Total Arsenic Correlations ... 209
A ppendix I Oxidation Kinetics D ata... 217
References ... 218
LIST OF FIGURES
Figure 1 A Typical Lift Tubew ell ... 13
Figure 2 A Typical Suction Tubewell... 13
Figure 3 Protonation Forms of Arsenic (III) at Various pH... 16
Figure 4 Protonation Forms of Arsenic (V) at Various pH... 16
Figure 5 Eh-pH Diagram of Aqueous Arsenic Species in the System As-02-H20 at 25"C and 1 bar Total Pressure ... 18
Figure 6 Relative Location of Nepal, Bangladesh and West Bengal...21
Figure 7 A K eratosis V ictim ... 28
Figure 8 Industrial Test Systems Arsenic Check Field Test Kit 481196... 31
Figure 9 The Chemical Structure of Poly-Benzyl Pyridinium Tri-Iodide ... 44
Figure 10 Oxidizing and Adsorption Capacity of A/M Media ... 48
Figure 11 Schematic Diagram Showing the Setup of the A/M Only and the BP/13 & A /M T reatm ent System s...50
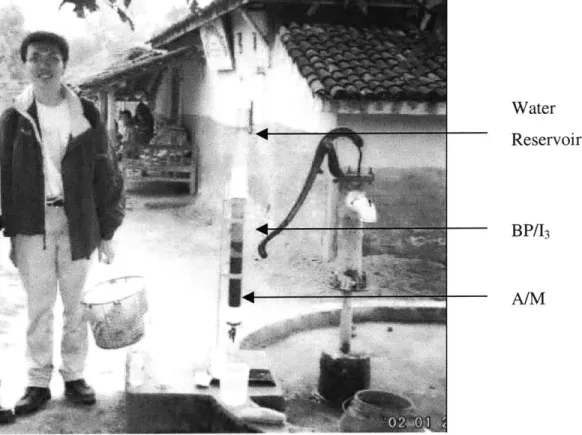
Figure 12 The Actual Column Used in this Arsenic Study... 51
Figure 13 M ap of Nepal Showing all Districts ... 53
Figure 14 Fluctuation in 8 Calibration Curves obtained on March 12, 2002...64
Figure 15 Results for Total Arsenic for the 37 Wells in Various Villages...79
Figure 16 Arsenic (III) as % of Total Arsenic for the 37 Wells in Various Villages. ... 80
Figure 17 Correlation Between Total Arsenic and % Arsenic (III)...81
Figure 18 Correlation Between pH and Arsenic Speciation ... 83
Figure 19 Correlation Between ORP and Arsenic Speciation ... 85
Figure 20 Correlation Between Well Depth and Arsenic Speciation...87
Figure 21 Correlation Between Well Depth and ORP ... 88
Figure 22 Correlation Between Number of Users and Arsenic Speciation...90
Figure 23 Correlation Between Number of Households and Arsenic Speciation...92
Figure 24 Correlation Between the Number of Households and Users ... 93
Figure 25 Change in Total Arsenic and Arsenic (III) with Time... 95
Figure 26 Change in % Arsenic (III) with Time ... 96
Figure 28 Change in ORP with Time... 100
Figure 29 Correlation Between pH and ORP... 101
Figure 30 Schematic Map of Parasi Town Centre and Well Locations... 121
Figure 31 Street Scene of Parasi ... 123
Figure 32 Backyard W ell ... 123
LIST
OF TABLES
Table 1 Summary of Arsenic Removal Technology Test Dates and Locations ... 55
Table 2 Summary of Arsenic Speciation of Tubewell Tests Dates and Location...56
Table 3 Summary of Oxidation Kinetics Tests Dates and Time...58
Table 4 Summary of Arsenic Removal Results ... 61
Table 5 Sum m ary of pH Results ... 64
Table 6 Sum m ary of O RP Results ... 67
Table 7 Summary of Total Alkalinity Results ... 69
Table 8 Summary of Total Hardness Results...70
Table 9 Summary of Total Soluble Iron Results...71
Table 10 Summary of Manganese Results ... 73
Table 11 Summary of Flow Rate Results... 74
Table 12 Results for Total Arsenic for the 37 Wells in Rupandehi and Nawalparasi D istric ts ... 7 7 Table 13 Comparion of test kit and GFAAS arsenic results ... 82
CHAPTER
1
INTRODUCTION
1.1
Nepal Water Project Overview
The Massachusetts Institute of Technology (MIT) Nepal Water Project 2001-2002 is a program intended to increase the awareness of water quality problems in the country of Nepal, and to provide assistance in solving these problems. Since 1999, 20 Master of Engineering students at the MIT Civil and Environmental Engineering Department traveled to Nepal to study various water quality and household/community level water treatment issues. This year's project is a collective effort of eight students: Heather Lukas, Chian Siong Low, Hannah Sullivan, Yong Xuan Gao, Luca Morganti, Barika Poole, Jeff Hwang, and Tommy Ngai.
Starting in September 2001, these eight students conducted background research into the water issues in Nepal. They traveled with Susan Murcott, their project advisor, to Nepal for three weeks in Jan 2002 to carry out their field studies. While in Nepal, these
students worked closely with local agencies including Environment and Public Health Organization (ENPHO) in Kathmandu and in Parasi, International Buddist Society (IBS) in Lumbini, and the Finnish Department of International Development Co-operation (DIDC), formerly called the Finnish International Development Agency (FINNIDA), in Butwal.
The MIT Nepal Water Project is completed as part of the degree requirements for the Master of Engineering program in the Civil and Environmental Engineering Department of MIT. Each student writes an independent thesis and the team produces a group report. This thesis is one of those independent theses.
1.2
Project Motivation
Nepal is a developing country in south central Asia landlocked between China to the north and India to the south. The land area is 140 000 km2 and the year 2000 population is 23 millions, of which 20 millions is rural'. Nepal is one of the world's poorest and least developed countries. The average annual income per capita is $210 US2. About 42% of the people live below the national poverty line3. Due to the poor economic
conditions and ineffective institutional programs, proper water and sanitation services are inadequate, resulting in serious health concerns. The severity of the water problems is even more prominent in the rural remote villages. The infant mortality rate is very high
at 74/1000 live births, compared with 5/1000 in the U.S. The under five mortality is even higher at 105/1000 birth4. 54% of the children suffers moderate to severe stunting on
account of water borne diseases5. Diarrheal diseases kill 44000 children annually. The
average life expectancy is only 58, compared with 77 in the U.S.6. Their serious health concern is the main motivation for this project
1.3
Project Goal
The MIT Nepal Water Project 2001-2002 is a continuation and expansion of the two previous Nepal Water Projects. As in past years, the aim of the project is to improve the
health situation in Nepal through improvement in water supply quality. For this year, there are three main goals. The first goal is to continue to monitor microbial and arsenic contamination in Nepal. The second goal is to study the appropriateness of various point-of-use household water treatment systems based on technical performance, social
acceptability, and affordability. Technologies investigated include filtration, and arsenic removal. The last goal is to evaluate past pilot studies and/or implement new projects, including the Lumbini pilot study, a tubewell maintanence program, and a chlorine generation micro-enterprise project.
Arsenic is a toxin that causes serious health effects such as cancer. The evaluation of an arsenic removal technology, as well as arsenic speciation in tubewell water are the focus
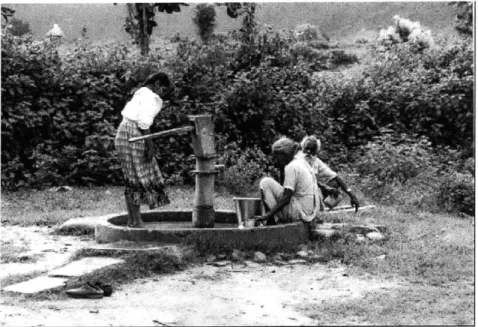
of this thesis. Figure 1 and Figure 2 show two very common types of tubewells, a lift tubewell and a suction tubewell, for which arsenic contaminated groundwater has been sampled and tested.
Figure 1 A Typical Lift Tubewell
Figure 2 A Typical Suction Tubewell
CHAPTER
2
BACKGROUND
2.1
Arsenic in the Environment
Arsenic is a naturally occurring element widely distributed in the earth's crust. It is the 51 st most abundant element on earth, with an average level of 1.8 mg/kg in the earth's crust. Normal background concentration are 0.2-15 mg/kg in the lithosphere, less than 15 mg/kg in soils, 0.02-2.8 ng/m3 in the atmosphere, and less than 1 pg/L in aquatic
7
environment .
Arsenic can be released into the environment by either natural or anthropogenic
processes. Dominant natural processes are volcanic activities and weathering of arsenic bearing rocks, including realgar (AsS), orpiment (As2S3), arsenopyrite (FeAsS), and
lollingite (FeAs2)8'9. Anthropogenic sources of arsenic are numerous. They include the
application of arsenical pesticides on land, incineration of arsenic containing substances, industrial wastewater discharge, mine tailing/landfill leaching, and manufacturing of arsenic compounds' 11,12
Since arsenic is an element, it is indestructible. It can only change from one form to
13
another, and be transported from one medium to another . Arsenic in air will settle to the ground or be washed out by rain. Arsenic in water may precipitate out of the solution, or adsorbed onto rocks and soils. Arsenic-containing rocks and soils may
14
release arsenic into the water by dissolution or desorption . Of the above media, aqueous arsenic is of most concern because high levels arsenic have found in drinking water in various places around the world, and are known to cause serious adverse health effects. Therefore aqueous arsenic will be the main focus in this report.
2.2
Arsenic Chemistry
Arsenic is a group V element with an atomic mass of 74.9 g/mo115. Contrary to popular belief, arsenic is not a metal, but a metalloid. Arsenic forms a number of inorganic and
organic compounds. Naturally occurring inorganic arsenic is stable in oxidation states of -III as in arsine gas (AsH3), 0 as in crystalline arsenic, +111 as in arsenite, and +V as in
16
arsenatel . Organic arsenic species include monomethylarsonic acid (MMAA), and dimethylarsonic acid (DMAA)1 7. They may be produced by biological activity, mostly in
surface waters, but are rarely quantitatively important. Organic forms may, however, occur where waters are significantly impacted by industrial pollution'8. In the relatively pristine natural ground water environment, arsenic (III) and arsenic (V) are typically the dominant forms of arsenic.
2.2.1 Acid-base Chemistry
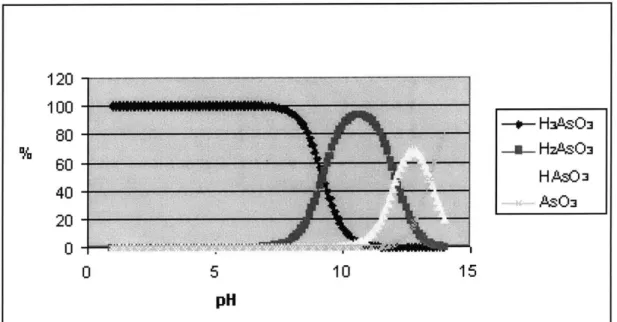
Depending on pH, different forms of arsenic (III) are H3AsO3, H2AsO3~, HAsO32~, and
AsO33-whereas different forms of arsenic (V) are H3AsO4, H2AsO4-, HAsO4 2
-, and AsO4 3-. Refer to Figure 3 and Figure 4 for the protonation forms of arsenic (III) and arsenic (V) at various pH. These diagrams are generated by the following equilibrium
19
relationships.
For arsenic (III),
H3AsO3 - H2AsO3- + H pKai = 9.22 (1)
H2AsO3~ 4 HAsO3
2-+ H+ pKa2 12.13 (2)
Has0 32-
+
AsO33- + H+ pKa3 =13.40 (3)For arsenic (V),
H3AsO4
+
H2AsO4- + H+ pKai = 2.20 (4)H2AsO4-
+
HAsO4 2- + H+ pKa2= 6.97 (5)HAsO42- 4 AsO43- + H+ pKa3 =11.53 (6)
120 100 - --MI II 1 1. 1 ---80 60 40 20 20 0 5 pH 10 15
Figure 3 Protonation Forms of Arsenic (III) at Various pH
Figure 4 Protonation Forms of Arsenic (V) at Various pH
o- HAsO3 ---- HZAsO H ASO3 AsO3 120 100 80 60 40 20 0 -*- H 1sO. -n- HasO4 H AsO -AsO& 10 15 0 5 pH
The amount of protonation of both arsenic (III) and arsenic (V) is an important factor governing the mobility of these chemical species. For example, the pH of groundwater is often between 6 to 8. Within this range, arsenic (III) is uncharged while arsenic (V) is negatively charged. As a result, arsenic (III) is more mobile than arsenic (V). The movement of arsenic (V) is retarded by electrostatic attraction to positively charged
20
particles, such as iron hydroxides . This information is also useful in designing effective arsenic removal technologies and in determining the arsenic speciation by ion exchange separation technique.
2.2.2 Reduction-Oxidation (redox) Chemistry
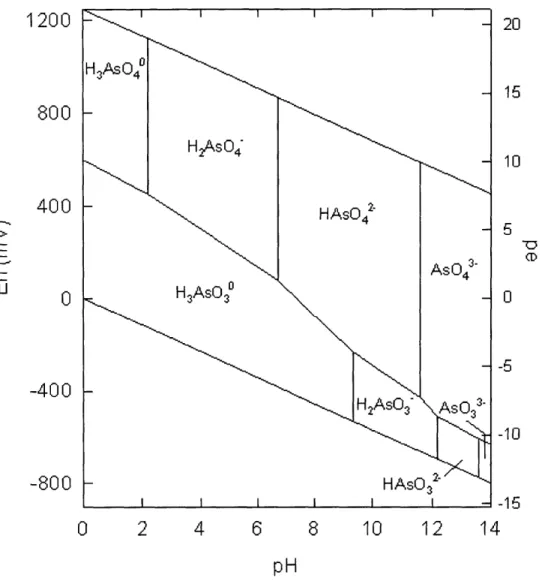
Given the acid-base chemistry, combined with Gibb's free energy change of the oxidation/reduction reactions between arsenic (III) and arsenic (V), an Eh-pH diagram (Pourbaix diagram) can be constructed . Refer to Figure 5 for an Eh-pH diagram of arsenic.
The Eh-pH diagram shows the exact arsenic speciation and oxidation states at a particular pH and redox potential23. The diagram also shows the expected change in arsenic state when environmental conditions differ. For example, anoxic groundwater usually has a low redox potential. When the water is pumped to the ground surface and exposed to the atmosphere, the presence of dissolved oxygen increases the redox potential. As a result, arsenic (III) will naturally oxidize to arsenic (V).
This information is very useful because different oxidation states of arsenic also have different toxicities. Studies show arsenic (III) can be a degree of magnitude more toxic than arsenic (V)2' 2. Refer to Chapter 3 Health Effects, for more information on
toxicology. Refer to Chapter 7 Results and Discussions, for more information on the kinetics of arsenic (III) oxidation.
1200
800
400
ELU
0-400
-800
20 I- -H3AsO40 H2AsO4 HAsO4 AsO H3AsO3 -H2AsO3- As 03 3. HAsO3 2-SI I I I I -0 -10 -150
2
4
6
8
10
12
14
pH
Figure 5 Eh-pH Diagram of Aqueous Arsenic Species in the System As-02-H20 at
25'C and 1 bar Total Pressure26
10
2.3
Arsenic Situation in South Asia
In the early 1970s, most of the rural population of Nepal and the neighboring countries of Bangladesh and India received their drinking water from surface sources, including lakes, rivers, and ponds. Because this water became increasingly polluted, water-borne diseases were prevalent. Nearly a quarter of a million children died each year from these
diseases . Throughout the late 1970s and the 1980s, there was a worldwide push to improve the general health condition of the people in developing nations. Infant mortality was one of the target health indicators. It was well understood that access to clean drinking water source could reduce infant mortality2 8. As a result, many
international aid agencies such as the World Bank, and the United Nations International Children's and Educational Fund (UNICEF) became involved in funding the installation of tubewells for domestic water supply. Since groundwater contains relatively less microbial contamination than surface water, groundwater was believed to be a better
source of drinking water supply29. Tubewell construction was simple and cheap. In addition, tubewells could be installed close to people's home, saving time for them to travel to surface water sources. Furthermore, tubewells provided rural villagers with a
year round source of water to irrigate their fields, greatly contributing to the green revolution of food self-sufficiency. Millions of wells were built during the period of the
30,31
late 1970s to 1980s . In Bangladesh, the tubewell construction programs by various foreign aid agencies were successful in improving coverage of "safe" drinking water to
over 97%32. Partly due to the results of various successful tubewell installation
programs, infant mortality in Bangladesh dropped significantly from 151/1000 live births in 1960 to 83/1000 live births in 199633
At the time, however, the standard water quality testing procedures did not include tests for arsenic. Starting in 1983, cases of arsenic-induced skin diseases began to appear in West Bengal, India34. However, the issue remained unnoticed. In 1993, the Bangladesh
Department of Public Health Engineering (DPHE) identified their first arsenic-affected patient. Well testing was conducted in the western districts of Bangladesh in September of the same year. Of the 33 tubewell samples tested, 13 had arsenic level more than WHO guideline of 10 p.g/L. A committee consisting of representatives from DPHE,
National Institute of Preventive and Social Medicine (NIPSOM), Atomic Energy Commission, Geological Survey of Bangladesh, UNICEF, and other concerned
organization was formed in 1994 to review the situation of arsenic in drinking water in Bangladesh. Further well survey was recommended. The Government of Bangladesh was contacted as well, but the government remained silent. The arsenic situation again remained unnoticed. In June 1996, a non-profit NGO called the Dhaka Community Hospital (DCH) received several patients showing signs of arsenical skin lesions35. DCH promptly tested tubewells in the area, and found high arsenic content in the water. DCH informed the local officials and made newspaper reports. Arsenic contamination concern began to surface in Bangladesh. Finally in 1997, the Bangladesh Government officially confirmed that its country's drinking water supply is seriously contaminated with arsenic.
36
Arsenic in Bangladesh made headlines around the world
Bangladesh currently faces the world's most serious arsenic crisis. It is estimated between 20-60 million people of the country's total population of 125 million are at risk of exposure to arsenic in their drinking water over the Bangladesh standard of 50
pg/L37,3 8. At least 100 000 cases of debilitating skin lesions are believed to have already
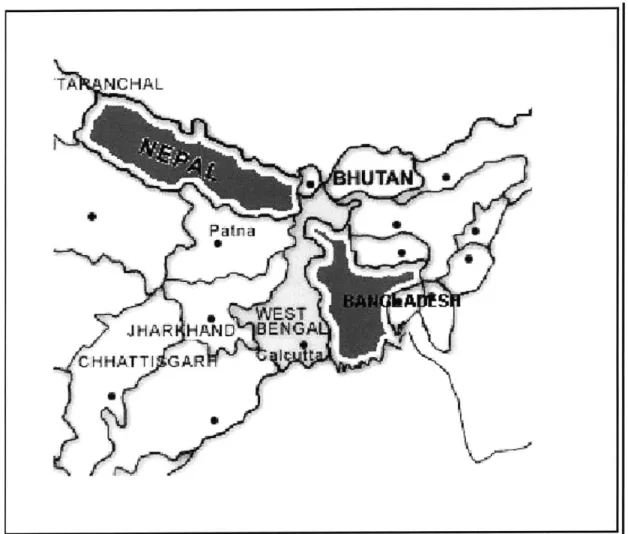
occurred 39. Another 4-7 million people are at risk in neighboring West Bengal.4 Figure 6 shows the relative locations of Nepal, Bangladesh, and West Bengal (India).
S
RHUT
TA. NCHAL Fa Pu JHAR 1HAND E CHHATTI 'GAR I -jFigure 6 Relative Location of Nepal, Bangladesh and West Bengal
2.4 Arsenic Situation in Nepal
The Nepal Terai is the flat plain region in the southern part of the country, a part of the Gangetic watershed. Due to its proximity to Bangladesh and West Bengal, various groups became concerned that arsenic can be a problem in Nepali drinking water. In 1999, the Department of Water Supply and Sewerage (DWSS) received financial support of World Health Organization (WHO) and UNICEF to initiate various arsenic monitoring programmes41. These programmes were conducted on the groundwater of southern Nepal by a number of national and international organizations. In the 1999 study by DWSS in
21 S 6 I 'Is 'I, 1~
the districts of Jhapa, Morang, and Sunsari in eastern Nepal, it was found that 9% of the 268 tube well water samples contained arsenic above the WHO guideline of 10 pg/L. The highest concentration was found to be 75 ptg/L42. In January 2000, a study by Halsey
of the MIT Nepal Water Project 1999-2000 showed that 18% of the 172 tested tube wells of the Terai region were contaminated with arsenic level above the WHO guideline43. In the same year, in study by the Nepal Red Cross Society (NRCS) in the three districts of eastern Terai namely Jhapa, Saptari and Sarlahi, it was found that 5.1% of the tube wells has arsenic contamination above the WHO guideline. The highest level detected was 56 pg/L 44. The NRCS also conducted a study in 2001 in eight other districts of the Terai region including Rautahat, Bara, Parsa, Nawalparasi, Rupandehi, Kapilvastu, Banke, and Bardiya. It was found that 22% of the total investigated tube wells have arsenic level exceeding the WHO guideline, and the maximum level of contamination was found to be 165 tg/L 45. Also in 2001, the Rural Water Supply and Sanitation Support Program (RWSSSP) in collaboration with the Finnish International Development Co-operation (DIDC), formerly called the Finnish International Development Agency (FINNIDA) showed that 9.8% of 1508 samples in the districts of Rupandehi, Nawalparasi, and Palpa have over 10 pg/L of arsenic 46. The highest was measured in the village development
community (VDC) of Devdaha of Rupandhi district where two wells have over 2000 ptg/L of arsenic47. From these studies, it is clear that arsenic is a problem in the
groundwater of the Nepal Terai region. It can potentially escalate into a serious health issue if the problem is not addressed properly.
2.5
Origins of Arsenic
Due to the low level of industrial activities in Nepal and Bangladesh, it is generally agreed that natural processes, as opposed to anthropogenic activities, are the dominant source of arsenic in these regions. Several hypotheses have been put forward as to the source and release mechanisms of arsenic in groundwater. The two most popular
48
2.5.1 Pyrite Oxidation Hypothesis
The pyrite oxidation hypothesis was proposed by Dr. Dipankar Chakraborti and his group 9. Studies have shown that there is a high level of arsenopyrites in the alluvial regions of Bangladesh5 0. After tubewells were installed, the water table was lowered due
to increased pumping. As a result, atmospheric oxygen invaded the aquifer by diffusing into the pore spaces of the soil and into the groundwater. The oxygen interacts with the arsenopyrite, turns the mineral into water-soluble form, thus releaseing arsenic into the groundwater 1' 52, 53
However, this hypothesis was not consistent with the observation that shallow, oxic wells generally contained much lower level of arsenic than deeper, anoxic wells54. In addition,
if pyrite was oxidized, the aquifer should be rich in sulfate, but it was not5 5. Recent
works by Harvey et al found sulfate levels were lower at locations with higher arsenic concentration 6. In the conference on arsenic mitigation in Dhaka on January 14th -16th 2002, there was a widespread feeling that the oxidation theory was not reasonable.
2.5.2 Iron Oxyhydroxide Reduction Hypothesis
According to the iron oxyhydroxide reduction hypothesis, the source of arsenic was from the Ganges source region upstream of Bangladesh, where arsenic-rich sulfide minerals were weathered during the late Pleistocene-Recent times. As these weathered minerals traveled down the Ganges, arsenic was adsorbed to iron oxyhydroxide (FeOOH). The
arsenic-rich iron oxyhydroxide were deposited at the Gangetic delta, and formed an alluvial aquifer. Due to a wide variety of processes, such as agriculture or groundwater pumping, organic carbon was introduced into the aquifer. The mineralization of organic
carbon caused anoxic condition in the aquifer, and lowered the redox potential. The reducing environment caused the breakdown of iron oxyhydroxide, and released the
previously adsorbed arsenic58'59.
One of the arguments supporting this hypothesis was that studies showed arsenic correlated well with iron and dissolved bicarbonate6 0. Arsenic concentration also
increased with depth61. These observations suggested that arsenic was released when arsenic-rich iron oxyhydroxides were reduced in the anoxic condition, a process that
62
mobilized iron and its absorbed load, and increased bicarbonate concentration
Recent works by Harvey et a163 further supports this hypothesis by showing strong
correlations between arsenic and several key chemical species, including calcium, ammonium, organic carbon, sulfate, and iron in groundwater at various depth. For example, arsenic and sulfate shows a strong negative correlation, meaning that arsenic concentrations are high when sulfate concentrations are low. One explanation for low sulfate concentration at a particular depth is that sulfate reduction is taking place. According to the ecological redox sequence, sulfate reduction should occur after iron
64
reduction, because sulfate reduction is less energetically favorable then iron reduction Therefore, at depths with low sulfate, iron reduction should have already occurred. The reduction of iron released arsenic into the groundwater. As a result, arsenic
concentrations are high when sulfate concentrations are low.
2.6 Arsenic Treatment Technologies
Since the discovery of arsenic in Bangladesh and West Bengal, many researchers worldwide have focused their efforts on developing appropriate arsenic removal
technologies to treat the arsenic contaminated groundwater. These technologies can be broadly categorized according to their dominant removal process. They include
oxidation, coagulation/precipitation, filtration, adsorption, ion exchange, membrane processes, and biological processes65. Although many of these technologies are
theoretically sound and work well in a controlled laboratory environment, many of them have not been field tested for their performance and appropriateness. In the MIT Nepal Water Project 2000-2001, Hurd evaluated the performance and appropriateness of three promising technologies: Three-Gagri System, Jerry Can System, and Arsenic Treatment Unit (ATU)6 . The Three-Gagri System was found to be both effective and appropriate, but clogging and possible microbial growth were potentially the main problems. The Jerry Can System was found to be ineffective and inappropriate with its current design.
The ATU was quite effective, but too expensive for mass implementation in South Asian contexts.
2.7
Alternative Water Source
Besides removing arsenic from groundwater, alternative water sources such as rainwater harvesting, dugwell, and deep wells may provide arsenic-free drinking water to the Nepali people. Rainwater harvesting is under studied by DIDC and the preliminary results are encouraging67. The town of Parasi in the Nawalparasi district currently taps into a deep aquifer to provide drinking water of low arsenic concentration to the townspeople. However, construction of deep wells requires more sophisticated equipment and is thus more expensive, at about US$500 per well6 8.
CHAPTER
3
HEALTH EFFECTS
Arsenic has been long known as a poison. Even at low concentration, it can produce devastating human health effects 69. The toxic character of arsenic species mainly depends upon their chemical form. The most toxic form is arsine gas, followed by inorganic trivalent compounds, organic trivalent compounds, inorganic pentavalent
compounds, organic pentavalent compounds and elemental arsenic70'71 . Both the WHO and EPA have classified inorganic arsenic as a toxin and carcinogen72
3.1
Route of Entry
Given that arsenic can be found in different environmental media, possible routes of entry include inhalation of arsenic contaminated air, ingestion of arsenic containing food and water, and skin contact73 . Air borne arsenic concentration is usually between 0.02 and 4 ng/m3. This concentration is too low to induce any noticeable health effects by
inhalation74. As for skin contact, arsenic does not readily absorb into skin upon contact. Therefore, inhalation and skin contact are negligible source of entry for arsenic. The ingestion of arsenic containing food and/or water is the most important route of entry. Of the many food categories, fish and shellfish contain the highest level of arsenic75. Up to 40 tg of arsenic per gram of dry weight fish can be found. Fortunately, over 90% of the arsenic is in organic form, which is only very mildly toxic76. In contrast, for arsenic contaminated drinking water, most of the arsenic is in the more toxic inorganic form. Arsenic levels in groundwater typically average around 1 to 2 ptg/L. However, in areas with volcanic rock and sulphide mineral deposits, arsenic levels in excess of 3000 ug/L have been measured77. Therefore, arsenic in drinking water is of the most concern.
3.2
Acute Toxicity of Arsenic (III) and (V)
Ingestion of large doses of arsenic usually results in symptoms within 30 to 60 minutes, but may be delayed when taken with food. Acute arsenic poisoning usually starts with a metallic or garlic-like taste, burning lips and dysphagia. Then, violent vomiting and
hematemesis may occur7 8. These gastrointestinal symptoms are a result of intestinal
injury caused by dilatation of splanchnic vessels leading to mucosal vesiculation. After the initial gastrointestinal problems, multi-organ failures may occur, followed by death. Survivors of acute arsenic poisoning commonly incur damage to their peripheral nervous
79
system
Arsenic (III) and (V) behaves differently in acute poisoning. Arsenic (III) binds and inactivates sulfhydryl-containing enzymes necessary for proper body functions. On the other hand, arsenic (V) elicits toxicity by mimicking phosphate and interfering with ATP
80
production in the mitochondria
Acute poisoning has a mortality rate of 50-75% and death usually occurs within 48 hours. A lethal does will vary with the arsenic form, but 0.2-0.3 g of arsenic trioxide is usually fatal for adult humans81. Reported arsenic (V) LD50 values in rats are 110 mg/kg, while
the LD50 values in rats for arsenic (III) varies from 15 mg/kg to 110 mg/kg. Therefore,
arsenic (III) is a magnitude more acutely toxic than arsenic (V)82. However, in the context of drinking water supply, acute poisoning is less common than chronic exposure.
3.3
Chronic Toxicity of Arsenic (I1) and (V)
Chronic exposure to low level of arsenic has long since been linked to adverse health effects in human. There are contradictory beliefs on the relative chronic toxicity of arsenic (III) and (V). On one hand, arsenic (III) should be more toxic than (V), as an extension of acute toxicity data. On the other hand, some believe that chronic toxicity at low arsenic levels, as found in most groundwater, is influenced only by total arsenic concentration, not speciation 83. No matter which hypothesis is correct, long-term
84
exposure to arsenic has proven to cause dermal, vascular, and cancer effects
3.3.1 Dermal
Initially, chronic exposure to arsenic causes skin changes such as hyperpigmentation and keratosis. Hyperpigmentation is an alteration in color resulting in spots on the skin and
keratosis is a hardening of skin bulges, usually found in palms and soles. Following hyperkeratosis and hyperpigmentation, cancer may occur. After 10 years of exposure, cancer of the skin may develop5 . Figure 2 shows a keratosis victim. Recent studies from West Bengal, India and Bangladesh in populations showed that that the age-adjusted prevalence of keratosis rose from zero in the lowest exposure level (< 50 [tg/L) to 8.3 per 100 women drinking water containing > 800 pg/L86. For men, the age-adjusted prevalence rates rose from 0.2 per 100 in the lowest exposure category to 10.7 per 100 in the high exposure group 7. For hyperpigmentation prevalence, similar results were reported". Figure 7 shows a victim of keratosis.
_
II
Figure 7 A Keratosis Victim
3.3.2 Vascular Effects
Exposure to arsenic has been linked to various vascular diseases affecting both the large (cardio-vascular) and small blood vessels (peripheral vascular). Blackfoot disease (BFD) in parts of Taiwan is an example of peripheral vascular disease. BFD is characterized by coldness and numbness in the feet, followed by ulceration, black discoloration and
subsequently dry gangrene of the affected parts. In addition many of the BDF-patients have shown significantly higher death rate from cardio-vasuclar problems89.
3.3.3 Cancer
In additional to skin cancer, arsenic exposure in drinking water causes lung, bladder and kidney cancer may appear after 20 years or more years90 . Studies have consistently shown high mortality risks from lung, bladder and kidney cancers among populations exposed to arsenic via drinking water. Moreover, the risk of cancer for these sites
91
increases with increasing exposure
CHAPTER
4
ANALYTIC METHOD
Numerous relevant water quality parameters were measured in this arsenic study. These parameters include:
" Total inorganic arsenic * Arsenic speciation " pH
* Oxidation-reduction potential (ORP) * Total alkalinity
" Total hardness as CaCO3 * Total soluble iron
" Manganese
A description of each of the above water quality parameters and their test methods are explained in this section.
4.1
Total Inorganic Arsenic
Description
Total inorganic arsenic in Rupandehi and Nawalparasi districts of Nepal was comprised mainly of arsenic (III) and arsenic (V). Total inorganic arsenic was first measured with an Industrial Test Systems Inc. Arsenic Checkim Field Test Kit, and then confirmed with a Graphite Furnace Atomic Adsorption Spectrometry (GFAAS). Other forms of arsenic were irrelevant at these sites, thus were not measured. For example, other inorganic forms of arsenic such as arsine or arsenic element were not found in natural waters.
92,93
Organic arsenic was formed only by bacteria methylation of arsenite . The level of organic arsenic was believed to be low in anoxic groundwater. Furthermore, the toxicity of organic arsenic was very low compared to inorganic forms; therefore, organic arsenic was ignored.
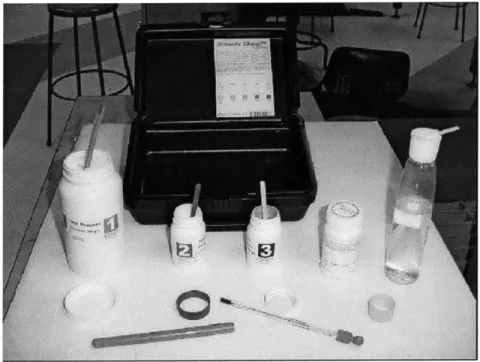
4.1.1 Industrial Test Systems Inc. Arsenic CheckTM Field Test Kit 4811964
This arsenic field test kit shown in Figure 8 provides a safe, simple, and reliable method to test for aqueous inorganic arsenic. It requires no electricity and no refrigeration. The detection range is from 0 to 800 mg/L. The upper detection limit can be extended to 4000 mg/L with a simple 1 to 5 dilution. All components are supplied in the kit,
including a detailed description of the test method, a color chart, three chemical reagents with material safety data sheets, three measuring spoons for the reagents, test strips, two reaction bottles, four bottle caps, a thermometer, and a zip-loc test strips disposal bag.
Figure 8 Industrial Test Systems Arsenic Checkim Field Test Kit 481196
The test results are determined by colorimetry. The color chart is standardized at 25'C, starting at pure white for 0 ppb arsenic, a tint of yellow for 5 ppb arsenic, to slightly more yellow at 10 mg/L, and increasing yellow intensity at 20, 50, 100, 200, and 500 mg/L. At 500 mg/L arsenic, the color is dark brown. It is recommended that the water sample temperature be between 20'C and 30'C for accurate reading off the color chart. This test tolerates up to 2 mg/L hydrogen sulfide and 0.5 mg/L antimony without test result
interference. No interference from iron or sulfate was found. There are 100 tests per kit, selling at $120 per kit.
Procedure
The chemistry of the reaction is based on the conversion of inorganic arsenic compounds
95
in water to arsine gas (AsH3) by the reaction of zinc dust and tartaric acid
1. First, a clean reaction bottle is filled with raw water to the 100 mL mark. Then, three level pink spoons of reagent 1, tartaric acid, are added to the bottle. The bottle is capped and shaken vigorously for 15 seconds. The tartaric acid is dissolved. The contents are allowed to sit for 15 seconds.
2. Three level red spoons of reagent 2, which contains a mixture of ferrous salts as reaction catalyst, are introduced. Again, the bottle is capped and shaken
vigorously for 15 seconds. The metal salts are dissolved. The content is allowed to sit for 2 minutes.
3. Then three level white spoons of reagent 3, zinc dust, is added to the bottle and shaken vigorously for 15 seconds. The bottle cap is replaced with another cap that allows a test strip containing mercuric bromide to be inserted into the bottle. 4. The bottle is capped for the next 30 minutes. Both hydrogen gas and arsine gas
will bubble from the solution. The arsine gas then reacts with mercuric bromide on the test strip to form mixed mercury halogens (such as AsH2HgBr) that appear
with a color change from white to yellow or brown.
5. At the end of 30 minutes, the test strip is taken out of the bottle and compared to the color chart to determine the arsenic concentration. Because hydrogen may cause an explosion, and arsine gas is toxic, it is highly recommended the test be conducted in a well-ventilated* area away from fire and other sources of
96
ignition
This test kit was simple and easy to use while in remote locations in Nepal. No
complications or problems occurred in its use under these challenging field conditions.
* Study by Hussam et al showed the maximum arsine concentration in the immediate vicinity of some arsenic test kits can be more than 35 times the threshold limiting value (TLV) of 50 ppbv of arsenic from a single experiment with 100 ppb of total arsenic in solution.
4.1.2 Graphite Furnace Atomic Adsorption Spectrometry (GFAAS)9 7 GFAAS is one of the USEPA methods for measuring arsenic in drinking water. Atomic adsorption is based on the principle that atoms will absorb light at some characteristic wavelength. These wavelengths are related to the atomic structure of an element and the energy required for the promotion of its electrons from one quantum level to another. Therefore each element has its own characteristic wavelength. A wavelength of 193.7 nm is recommended for arsenic. The amount of light absorbed by an element at a certain
wavelength can be correlated to the concentration of the element within the linear calibration range. The reliable calibration range is as low as 1-5 mg/L, and as high as
200 mg/L. Dilution of samples with higher arsenic concentrations may be required. Chemical interference may occur, but it can be ameliorated by the use of matrix modifiers. This method is not suitable for field use because of its large size and the
sensitivity of the delicate components to transportation. The GFAAS requires electricity, but no refrigeration. A GFAAS instrument is available for use in the R.M. Parsons Laboratory at MIT.
Procedure
1. Water samples from Nepal were first preserved by adding a drop of strong hydrochloric acid (HCl) per 10 mL of sample at the time of collection. The acidification prevents the precipitation of aqueous iron that would otherwise adsorb arsenic.
2. In the MIT laboratory, 1 mL of the water sample is carefully pipetted into a specially made plastic vial for GFAAS analysis. The vial is placed on the sampling dish. A set of standard arsenic solutions and matrix modifiers are also placed on the sampling dish. The dish has a capacity of 75 samples.
3. A pre-programmed arsenic testing procedure is loaded on the GFAAS computer control. Information on the test samples are entered into the computer.
4. Click to start the test procedure. The instrument then automatically takes a small amount of the sample and volatilizes the arsenic atoms by intense heating. Once the atoms are excited, a monochrome lamp at 193.7 nm sends an optical beam through the headspace above the sample. The instrument measures the absorption and reports it as a peak focused around the 193.7 nm wavelength. The area under the peak is numerically integrated. The integrated results are displayed on the computer screen and on a printer printout.
5. By comparing the area under the peak of the sample water with standard arsenic solutions, the concentration of the sample can be determined. Because of the variances associated with the instrument, a standard calibration curve was developed for every six to eight samples analyzed to maintain accurate measurements.
4.2
Arsenic Speciation
Description
Arsenic speciation refers to the proportion of arsenic (III) to arsenic (V) in water. Speciation is dependent on the groundwater chemistry. Speciation is an important measure in many respects. For example, arsenic (III) is much more toxic than arsenic (V)98. Arsenic (III) is charged thus more mobile than neutral arsenic (V) under normal groundwater conditions. Furthermore, many current arsenic removal technologies can effectively remove arsenic (V), but not arsenic (III). The arsenic speciation test was performed using Bio-Rad Laboratory's AGL-X8 ion exchange resin, 100-200 mesh, acetate form.
4.2.1 Bio-Rad Laboratory's AG1-X8 Ion-exchange Resin
The fundamental requirement for the arsenic speciation test is the separation of arsenic (III) from (V) in the water"'100. While there are many separation methods, the Bio-Rad Laboratory's AG1-X8 ion exchange resin, 100-200 mesh, acetate form is based on
ion-exchange. Ion exchange processes are chemical reactions between ions in solution and ions in an insoluble solid phase. Depending on the ion-exchange media, certain aqueous ionic species are removed by the ion-exchange solid. Since electron-neutrality must be maintained, the solid releases replacement ions to the solution01. For the case of arsenic
speciation at a pH range of 2 to 9, arsenic (III) is an uncharged aqueous species while arsenic (V) is a negatively charged aqueous species. The AG1-X8 resin is an ion exchange resin that only attracts and binds arsenic (V) in the solution. Virtually all arsenic (V) can be removed by the resin, leaving behind only arsenic (1II) in the solution. Then the arsenic (III) solution can be tested for arsenic content. By comparing this result with water sample containing both arsenic (III) and (V), the amount of arsenic (V) can be easily determined by a simple subtraction.
Procedure
1. The pH of the water sample is checked with a pH meter. If the pH falls within 2-9, then no pH adjustment is required. Otherwise, pH adjustment using strong acid such as HCl or strong base such as NaOH is necessary.
2. For every 10mL of water sample collected, 0.2 g of resin is needed. In case that a balance is not available, the resin has a density of 0.75 g/mL. The desired resin weight can be determined by measuring the required volume in a graduated cylinder. When in doubt, use more resin than prescribed.
3. For samples collected in mailer tubes that have a volume of about 14 mL, 0.3-0.4 g of resin was added to the sample. The tube is capped and shaken vigorously for 5 minutes. The shaking action allows efficient contact between the resin and arsenate species. Virtually all arsenate is adsorbed onto the ion-exchange resin within 5 minutes. Because arsenic (V) is very strongly adsorbed onto the resin, the vigorous shaking is not going to release the arsenic (V) back into the solution. 4. The content is then left undisturbed for 5 minutes. The resin settles to the bottom
of the tube. The supernatant, containing only arsenic (III), is decanted into a clean mailer tube. This water sample is preserved by acidification with HCl as described before.
5. Another mailer tube is used to collect a water sample containing total inorganic arsenic. This sample is preserved by acidification with HCl as well.
6. The two sample sets (arsenic (III) only and total arsenic) are then brought back to MIT to be analyzed by the GFAAS.
4.3
PH
Description
pH is a measure of the acidity of a solution. It is a very important water quality parameter because in natural water, many chemical reactions associated with the
formation, alteration, and dissolution of minerals are pH dependent 102. This is especially
true for carbonate minerals, as the equilibrium of carbon dioxide (C0 2), bicarbonate (HCO3 2-), and carbonate (C0 32-) are dictated by pH 03. Many biological activities, such
as photosynthesis and respiration, are also influenced by pH through their respective abilities to decrease and increase the concentration of dissolved carbon dioxide'0 4. As a result, an observed change in pH may provide clues on the types and direction of
reactions occurring in a solution. Another use of pH is that the protonation of many species are dependent on pH, such as arsenic (III) and (V). In addition to pH's
significance in chemical reactions, pH is also a key aesthetic objective in drinking water. For example, the US National Secondary Drinking Water Regulation (NSDWR) sets a
pH guideline of 6.5 to 8.5 105. In this arsenic study, pH in the field site was tested with two methods: Digi-Sense Digital pH/mV/ORP meter by Cole Parmer, and pH Test Strips by Industrial Test Systems.
4.3.1 Cole Parmer Digi-Sense Digital pH/mV/ORP Meter EW-5938-50
The Cole Parmer pH meter measures pH using a combination electrode. The electrode incorporates both glass and reference electrodes in one body1 06. The pH-sensitive part of the electrode is the thin glass bulb at the bottom of the electrode. When the electrode is immersed in a solution, the electric potential difference across the two electrodes is measured and converted to a pH reading0 7.
Procedure
1. The pH meter must be calibrated before use. Calibration solutions are prepared with pH buffer tablets. Three buffer solutions must be prepared, at pH = 4, pH =
7, and pH = 10.
2. The temperature of the buffer solutions are measured and entered into the pH meter.
3. The electrode is dipped into the pH = 7 buffer solution. The pH reading on the meter is set to 7.
4. Then the electrode is dipped into the pH = 4 buffer solution. Adjust the slope screw on the meter to a pH reading of 4. Now the pH meter is ready for use, with accuracy optimized for solutions with pH between 4 to 7. If the expected solution pH is above 7, then the pH = 10 buffer solution is used instead of the pH = 4 buffer solution. The slope screw is adjusted to a pH reading of 10.
5. Since pH is temperature dependent, it is important to enter the solution temperature into the meter in order to obtain the best readings.
6. The pH electrode should be immersed in a strong KCl solution (use tap water if KCl is not available) when not in use.
4.3.2 Industrial Test Systems pH Test Strips 4800005
The test strips are very easy for field study use. The test strips come in a bottle of 50 strips. Printed on the bottle is a color chart corresponding to pH values from 6.0 to 9.0 at a 0.5 interval. Due to the proprietary nature of the product, the author was unsuccessful in obtaining details on the underlying chemistry of how the strips work.
Procedure
1. A test strip is taken out from the bottle, and immersed in the sample solution for 10 seconds without any motion.
2. Remove and immediately match the color on the strip with the color chart. Color on the strip will start to fade after 15 seconds.
4.3
Oxidation-Reduction Potential (ORP)
Description
Oxidation and reduction (redox) reactions involve the transfer of electrons. Redox reactions are important because they mediate the behavior of many chemical constituents
in drinking water' 0. Arsenic is an excellent example. The speciation of arsenic is dependent on the redox potential of the solution. While redox potential is an exact chemical quantity, ORP is an approximate measurement of the redox potential of a solution. Digi-Sense Digital pH/mV/ORP meter by Cole Parmer was used in the field study to measure ORP.
4.3.1 Cole Parmer Digi-Sense Digital pH/mV/ORP Meter EW-5938-50
The measurement of ORP is based on the potential difference measured between a measuring electrode and a reference electrode. For the Cole Parmer meter, the reference electrode for ORP is identical to that for pH measurements. When the electrode is immersed in a solution containing a reversible chemical reaction system, a migration of electrons is established between the electrode and the system. The electron flow is
109
measured and converted to an ORP reading
Procedure
1. ORP calibration is not perfromed on the meter because the procedue is not explained in the user manual.
2. Place the electrode into a sample solution. Select ORP mode on the meter. Record ORP value when the reading stablize.
4.4
Total Alkalinity
Description
Alkalinity of water is its acid-neutralizing capacity. Total alkalinity can be defined as the sum of all the titratable basesO, 1. In groundwater, where the carbonate system is the
carbonate*. Therefore, it can be taken as an indication of the concentration of these
12,113
constituents 12 . In this arsenic study, the total alkalinity was measured with Total Alkalinity Test Strips by Industrial Test Systems.
4.4.1 Industrial Test Systems Total Alkalinity Test Strips
The test strips are very easy for field study use. The test strips come in a bottle of 50 strips. Printed on the bottle is a color chart corresponding to total alkalinity values of 0, 80, 120, 180, 240, and 360 mg/L. Due to the proprietary nature of the product, the author was unsuccessful in obtaining details on the underlying chemistry of how the strips work.
Procedure
1. A test strip is taken out from the bottle, and immersed in the sample solution for 10 seconds without any motion.
2. Remove and immediately match the color on the strip with the color chart. Color on the strip will start to fade after 15 seconds.
4.5 Total Hardness as CaCO
3Description
Hardness is a measure of the total amount of calcium and magnesium** that has naturally leached into the water, as mg/L of calcium carbonate. If the subsurface contains
abundant calcium and magnesium rich formations, such as calcite (CaCO3) and dolomites (CaCO3 *MgCO3), then the groundwater from that region may have high hardness.
Hardness of more than 300 mg/L as CaCO3 is consider excessive for public use because 114
of high soap consumption and formation of scale in water fixtures . Most people prefer
* Total Alkalinity ~ -[H+] + [OH] + [HCO3~] + 2[C 32-] given that the carbonate system is the only
significant buffer system
** Although ions of iron, manganese, strontium, and aluminum also produce hardness, they are not present in significant quantities in natural water.
Source: Viessman, W., Hammer, M. "Water Supply and Pollution Control." 6t Edition. Addison-Wesley Longman, Inc.: Menlo Park, CA. USA. 1998.
water of less than 150 mg/L hardness ". Hardness was measured in this study with Total Hardness (as calcium carbonate) Test Strips made by WaterWorksim
4.5.1 WaterWorksTM Total Hardness (as calcium carbonate) Test Strips
The test strips are very easy for field study use. The test strips come in a pack of 30 individually wrapped strips. Found in the pack is a color chart corresponding to hardness values of 0, 40, 80, 120, 180, 250, and 425 mg/L as CaCO3. Due to the proprietary
nature of the product, the author was again unsuccessful in obtaining details on the underlying chemistry of how the strips work.
Procedure
1. A test strip is immersed in the sample solution for three seconds.
2. Remove and immediately match the color on the strip with the color chart. Color on the strip is stable for one minute.
4.6
Total Soluble Iron
Description
The two most common oxidation states for groundwater iron are Fe(+II) and Fe(+II)1 16.
Soluble iron refers to mostly Fe(II) because it is highly soluble. The solubility of Fe(III) is very low. Iron is a very important water quality parameter in this arsenic study
because iron hydroxide, Fe(OH)3, is a strong adsorbent for arsenic 1 7. Therefore, the
presence of high iron can aid arsenic removal. Iron was measured in the field sites in Nepal using Chemetics Inc.'s CHEMetsR Iron Kit K-6010.
4.6.1 CHEMetsTM Iron Kit K-6010
The iron test kit is simple to use. The test kit contains 30 ampoules, a sample cup, a bottle of A-6000 Activator Solution, and two sets of colour comparator. The first set of color comparator is for iron range of 0 to 1.0 mg/L at 0.1 mg/L interval. The second set