ASSESSING THE PERFORMANCE OF
HUMAN-AUTOMATION COLLABORATIVE PLANNING SYSTEMS
by | MASSACHUSETTS INSTITUTE OF TE CLOGY Jason C. Ryan
JUL 07 2011
B. S. Aerospace EngineeringUniversity of Alabama, Tuscaloosa, AL, 2007
Submitted to the Department of Aeronautics and Astronautics in partial fulfillment of the requirements for the degree of
Master of Science in Aeronautics and Astronautics at the
MASSACHUSETTS INSTITUTE OF TECHNOLOGY
June 2011
0 2011 Jason C. Ryan. All rights reserved.
The author hereby grants to MIT permission to reproduce and to distribute publicly paper and electronic copies of this thesis document in whole or in part in any medium
now known or hereafter created. A uth or ...
Department 6<Aeronautics and Astronautics
May 1 9th, 2011
4
C ertified by ... . . ...
Mary L. Cu ing Associate Professor of Aeronautics and Ast 'nau ics
Thesis S erv' or
A ccepted by ... ...
Eytan H. Modiano
Associate Proessor of Aeronautics and Astronautics
ASSESSING THE PERFORMANCE OF
HUMAN-AUTOMATION COLLABORATIVE PLANNING SYSTEMS
by
Jason C. Ryan
Submitted to the Depart of Aeronautics and Astronautics on May 19th, 2011 in partial fulfillment of the requirements for the
degree of Master of Science in Aeronautics and Astronautics.
ABSTRACT
Planning and Resource Allocation (P/RA) Human Supervisory Control (HSC) sys-tems utilize the capabilities of both human operators and automated planning algorithms to schedule tasks for complex systems. In these systems, the human operator and the al-gorithm work collaboratively to generate new scheduling plans, each providing a unique set of strengths and weaknesses. A systems engineering approach to the design and as-sessment of these P/RA HSC systems requires examining each of these aspects individu-ally, as well as examining the performance of the system as a whole in accomplishing its tasks. An obstacle in this analysis is the lack of a standardized testing protocol and a standardized set of metric classes that define HSC system performance. An additional issue is the lack of a comparison point for these revolutionary systems, which must be validated with respect to current operations before implementation.
This research proposes a method for the development of test metrics and a testing protocol for P/RA HSC systems. A representative P/RA HSC system designed to perform high-level task planning for deck operations on United States Naval aircraft carriers is utilized in this testing program. Human users collaborate with the planning algorithm to generate new schedules for aircraft and crewmembers engaged in carrier deck operations.
A metric class hierarchy is developed and used to create a detailed set of metrics for this
system, allowing analysts to detect variations in performance between different planning configurations and to depict variations in performance for a single planner across levels of environment complexity. In order to validate this system, these metrics are applied in a testing program that utilizes three different planning conditions, with a focus on validat-ing the performance of the combined Human-Algorithm plannvalidat-ing configuration.
Experimental result analysis revealed that the experimental protocol was successful in providing points of comparison for planners within a given scenario while also being able to explain the root causes of variations in performance between planning conditions. The testing protocol was also able to provide a description of relative performance across complexity levels.
The results demonstrate that the combined Human-Algorithm planning condition per-formed poorly for simple and complex planning conditions, due to errors in the
recogni-tion of a transient state condirecogni-tion and in modeling the effects of certain acrecogni-tions, respec-tively. The results also demonstrate that Human planning performance was relatively consistent as complexity increased, while combined Human-Algorithm planning was ef-fective only in moderate complexity levels. Although the testing protocol used for these scenarios and this planning algorithm was effective, several limiting factors should be considered. Further research must address how the effectiveness of the defined metrics and the test methodology changes as different types of planning algorithms are utilized and as a larger number of human test subjects are incorporated.
Thesis Supervisor: Mary L. Cummings
ACKNOWLEDGEMENTS
I owe a great many of you a great deal of thanks.
To my Mom and Dad, you have supported me in every decision that I have ever made and stuck by me through thick and thin. When I decided to leave home for college for an engineering discipline we knew little about, you were behind me 100%. When I left for Atlanta for a difficult job in small business, again you were there. When I decided to leave my well-paying job to go back to graduate school to further my education, you again supported me completely. The two of you have influenced me more than I can ex-plain and I have only come to appreciate that since I have left home. I love you both, and
I would not be here without your love and support.
To the Office of Naval Research, for funding my research and giving me the opportunity to attend this prestigious institution, for the exciting travel experiences, the ability to meet new people. This has been a wonderful project to be a part of, and I look forward to a few more years of continuing research.
To Jim and Nick, I would not have made it to MIT without you. Although I thought I was a hard working, dependable person, working with you taught me more lessons about en-gineering, responsibility, and how to manage ones life and resources than I could ever have imagined. We had our ups and downs, but I am forever thankful to you, Jim, for giving me a chance to work with your company. I will be forever grateful for everything that you have done for me.
To Missy, I owe you a great debt of thanks for giving me the opportunity to work with you these past two years (and for the next few more). I know there were times were I struggled with things, was hopelessly lost, or made major mistakes, but you always pointed me in the right direction (with an appropriate amount of force). Working in this lab the past two years has made me realize that this is exactly the type of research I have always been interested in, but never knew what it was. Simply for that, you have my eternal thanks.
To Yves, my thesis reader, I'm sorry for putting you through all of this, and I thank you for your patience, your guidance, and your sense of humor as we went through this proc-ess. You've been equal parts friend, mentor, and torturer through this process, but it's all for the better. I could not have finished this thesis without you, and expect to get a bottle of wine from me soon.
To Olinda, my other thesis reader, thanks for taking some time out of your busy schedule to read over my thesis. Also, thanks for showing me a bit around San Diego while I was there. Hopefully, I can make it back at there at some point and have some more time to
To the rest of the DCAP Team - Nick, Jon, Emilio, Randy, Ashis, Yale, Raj, Buddy, Susie, Bruno, Jonathan, and Morrisa - thanks for all the hard work in putting the system together. This thesis would not have happened without the combined efforts of all of us to create the DCAP system. I am the major beneficiary of your hard work, so I thank you all.
To those of you in the HAL Lab whom I have come to know and love - Jackie, Daryl, Farzan, Dave, Kris, Luca, Jason, Ryan, Kim, Andrew, Armen, Fei, Paul, Christin, Tho-mas, Pierre, Luisa, Birsen, Brian, Tuco - thanks for all the good times, the laughs, the beer, the hockey, the volleyball, for eating my cooking, for the late nights and random movies, for dragging me out of my bad moods, for leading me around Boston and Cam-bridge, and for all the other ways that you made my past two years here in Cambridge an absolute joy! I am delighted to call all of you friends. I know some of you are leaving soon, and to you, I wish you the best of luck with what you are doing. To the rest of you,
I still get to see you for at least another year, and I can't wait to see what happens.
To the crews at Tech Catholic Community and Hope In Action - thank you both for re-minding what is important to me outside of my research and work life. I feel more grounded now than I have since the end of my undergrad days at Alabama. None of you really know the extent of that story, but sufficed to say, you have my gratitude for it.
TABLE OF CONTENTS
Abstract ... 3
Acknow ledgem ents... 5
List of Figures ... 10
List of Tables... 13
List of A cronym s... 15
1. Introduction... 19
1.1. Problem Statem ent... 23
1.2. Research Questions ... 24
1.3. Thesis Overview ... 25
2. Prior W ork... 27
2.1. The HSC M etric Hierarchy ... 27
2.2. M etrics for M ission Efficiency ... 32
2.3. Metrics for Autonomous Platform Behavior Efficiency... 34
2.3.1. Common Algorithms for Planning and Resource Allocation...35
2.3.2. Measures of Autonomous Platform Behavior Efficiency ... 38
2.4. M etrics for Hum an Perform ance ... 40
2.4.1. M etrics for Hum an Behavior Efficiency... 41
2.4.2. M etrics for Hum an Behavior Precursors ... 43
2.5. Metrics for Human-Automation Collaboration ... 44
2.6. Chapter Sum m ary ... 45
3. The Deck Operations Course of Action Planner (DCAP)... 47
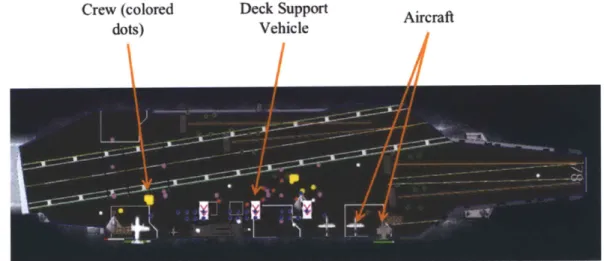
3.1. The Sim ulation Environm ent... 48
3.2. Display Elem ents ... 52
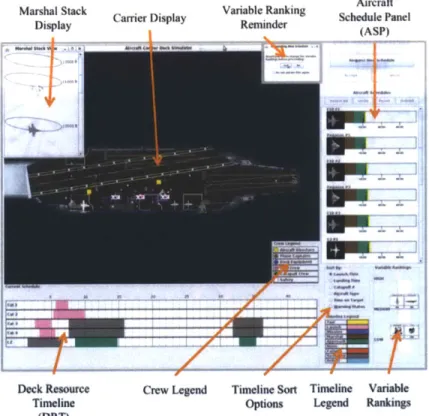
3.2.1. Inform ation Display Configuration ... 54
3.2.2. Plan Creation Configuration ... 57
3.2.2.1. Relative Priorities in the Variable Ranking Tool... 57
3.2.2.2. Individual Priorities in the Aircraft Schedule Panel... 58
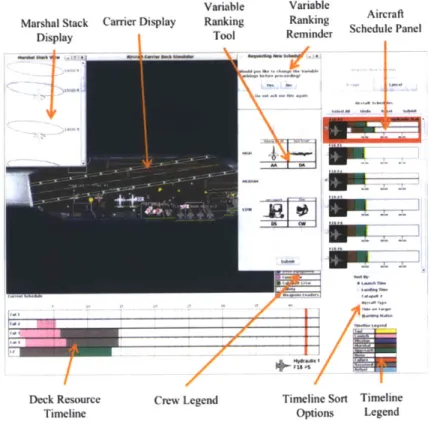
3.2.3. Proposal Review Configuration ... 59
3.3. The Autom ated Planner... 62
3.4. Chapter Sum m ary ... 64
4. Perform ance Validation Testing... 65
4.1. Testing Protocol... 66
4.1.1. Subject M atter Expert Heuristics ... 67
4.1.2. Scenario Definition ... 69
4.1.2.1. Sim ple Scenario...70
4.1.2.2. M oderate Scenario ... 72
4.1.2.3. Com plex Scenario ... 73
4.1.3. Statistical Pow er Analysis ... 74
4.2. Definition of the M etrics ... 75
4.2.1. M ission Efficiency M etrics... 75
4.2.1.1. Safety (Error-based) M etrics... 76
4.2.1.2. Expediency (Tim e-based) M etrics ... 78
4.2.2. Autonomous Platform Behavior Efficiency Metrics...81
4.2.3. Hum an Behavior Efficiency M etrics... 84
4.2.4. Hum an Behavior Precursors... 85
4 .2.5. Section Su m m ary ... 8 6 4.3. Testing Apparatus... ... ... 87
4.4. Chapter Summary -... ... ...--... 87
5. Results and Discussion ...---..---... 89
5.1. Reducing Family-wise Error ... 90
5.2. Within-scenario Results ...-...- ...--... 94
5 .2 .1. Sim p le Scen ario ... 9 4 5.2.1.1. Results of Statistical Testing... 95
5 .2 .1 .2 . D iscu ssio n ... 9 7 5.2.2. Moderate Scenario...101
5.2.2.1. Results of Statistical Testing... _... 101
5.2.2.2. D iscu ssion ...- - -... ... ... ... . 10 3 5.2 .3 . C om plex Scen ario ... ... ... 10 5 5.2.3.1. Results of Statistical Testing... - .... ... ... 106
5 .2 .3 .2 . D iscu ssio n ...--- 1 07 5.3. Performance Across Scenarios ...-... .... 109
5.4. Chapter Summary ... ... ... 116
6. Conclusions and Future Work .. . ... ... 119
6.1. Research Objectives and Findings...--....-....-... ... 119
6.2. Limitations and Future Work...-...-...126
6.3. Thesis Summary .-...--....-... ...--...- 129
Appendix A - Gaussian Processing Times for DCAP Simulation ... 131
Appendix B - Hybrid Cognitive Task Analysis for DCAP ... .... ....133
B.1 Preliminary Analysis ... ... ... ... ... 133
B.1.1 Scenario Task Overview (STO)... 133
B.1.2 Event Flow Diagrams (EFDs) ... 135
B.1.3 Decision Ladders ... 139
B.2 Secondary Analysis ....---- -...-.-... 144
B.2.1 Scenario Task O verview ... 14 5 B .2.2 Event Flow D iagram s... ... ... 14 5 B.2.3 Secondary Decision Ladders _... 147
B.2.4 Situational Aw areness Requirem ents... ... 150
B.3 Final Information and Functional Requirements .... -... 151
Appendix C - Tutorial for the DCAP Simulation ... ... 153
Appendix D - Expert User Replanning Actions...163
D.1 Replanning Actions for the Expert User....-...- ... ... 163
D.1.1 Planning for the Simple Scenario .-...- ... ... 163
D.1.2 Planning for the Moderate Scenario... ..--... 165
D.1.3 Planning for the Complex Scenario ... ...-...--... 166
Appendix E - Metrics with Low External Validity .... ... 169
Appendix G - Normality Tests...183
Appendix H - Tests for Heteroskedasticity...187
Appendix I - Boxplots for the Simple Scenario ... 191
Appendix J - Boxplots for the Moderate Scenario...197
Appendix K - Boxplots for the Complex Scenario...205 R eferen ces...21 5
LIST OF FIGURES
Figure 1. Human supervisory control diagram for P/RA HSC systems ... 19
Figure 2. Systems engineering spiral model as adapted to software ... 22
Figure 3. Existence of standardized metrics for HSC systems... 23
Figure 4. HSC diagram highlighting Pina's metric classes... 30
Figure 5. Sheridan and Verplank's Ten Levels of Automation (adapted from [64])... 37
Figure 6. Basic Areas of the Aircraft Carrier Deck. ... 48
Figure 7. View of the Carrier Deck, showing crew, Aircraft, and Unmanned W eapons L oaders... 52
Figure 8. Model of Human-Automation Collaborative Decision Making [111]... 53
Figure 9. Information Display Configuration of the DCAP Interface ... 55
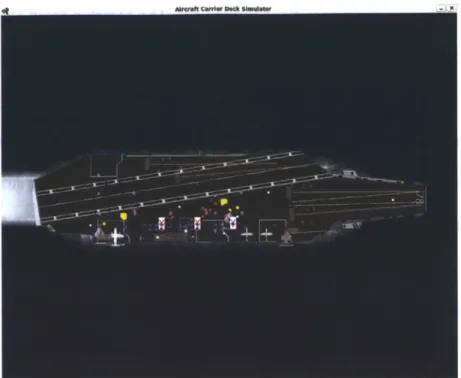
Figure 10. Full image of Carrier Display, "Deck View."... 56
Figure 11. Full image of Carrier Display, "General Overview."... 56
Figure 12. Ranking interface for the four system variables... 58
Figure 13. Example of priority definition and suggestion of an operating schedule for an aircraft in the A SP. ... 59
Figure 14. Proposal Review configuration. ... 60
Figure 15. D isruption ... 6 1 Figure 16. Collision avoidance "halo" for aircraft. Blue dot represents crew, gold dot with black ring signifies environment model of aircraft (point mass)... 83
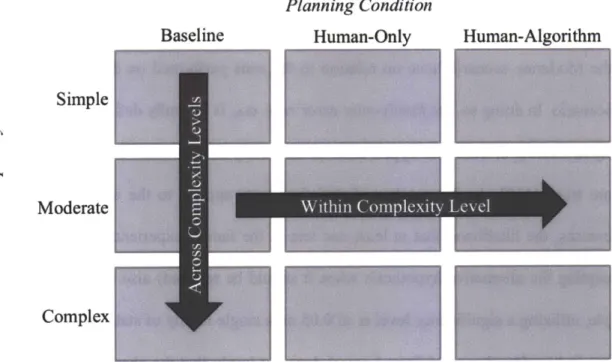
Figure 17. Visual depiction of the analyses performed in this testing program. ... 89
Figure 18. Simple scenario, Catapult 2 launch rate (launches per minute). ... 98
Figure 19. Simple scenario, Catapult 4 launch rate (launches per minute). ... 98
Figure 20. Simple scenario, Total Catapult Launch Rate (launches per minute). ... 99
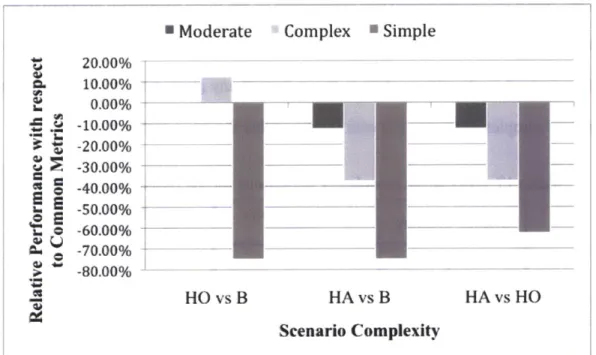
Figure 21. Relative performance comparison across scenarios... 111
Figure 22. Relative performance comparison across Common metrics. ... 112
Figure 23. Relative performance comparison across Scenarios in the alternate complexity ordering (num ber of entities). ... 114
Figure B. 1. Elements used in Event Flow Diagrams... 135
Figure B. 2. Event Flow Diagram 1 -M onitoring. ... 137
Figure B. 3. Event Flow Diagram 2 -Replanning... 138
Figure B. 4. Decision Ladder 1 -Necessity of Replanning (from EFD 1). ... 140
Figure B. 5. Decision Ladder 2 -Is aircraft affected by failure (from EFD 2)... 141
Figure B. 6. Decision Ladder 3 -New task assignment for aircraftj (from EFD 2). ... 142
Figure B. 7. Decision Ladder 4 -Define landing position for aircraft k (from EFD 2).. 143
Figure B. 8. Event Flow Diagram 3 - DCAP Replanning... 146
Figure B. 10. Decision Ladder 6 -Suggested schedule for aircraft i (from EFD 3)... 148
Figure B. 11. Decision Ladder 7 -Is proposed schedule acceptable (from EFD 3)... 149
Figure C. 1. Tutorial Step 1 - requesting a schedule... 153
Figure C. 2. Tutorial Step 2 - select whether to change variable rankings. ... 154
Figure C. 3. Tutorial Step 3 - changing variable rankings... 155
Figure C. 4. Tutorial Step 4- defining aircraft priorities... 156
Figure C. 5. Tutorial Step 5 - suggesting aircraft schedules. ... 157
Figure C. 6. Tutorial Step 6 - review the proposed schedule... 158
Figure C. 7. Tutorial Step 7 - adjust proposed schedule. ... 159
Figure C. 8. Tutorial Step 8 - accepting the proposed schedule... 160
Figure C. 9. Tutorial Step 1 - returning to a monitoring state... 161
Figure I. 1. Landing Zone Foul Time (LZFT). ... 191
Figure I. 2. Total Aircraft Taxi Time (TATT)... 191
Figure I. 3. Total Aircraft Active Time (TAAT). ... 192
Figure I. 4. Total Crew Active Time (TCAT). ... 192
Figure I. 5. M ission D uration (M D )... 193
Figure I. 6. Catapult 2 Launch Rate (C2LR). ... 193
Figure I. 7. Catapult 4 Launch Rate (C4LR). ... 194
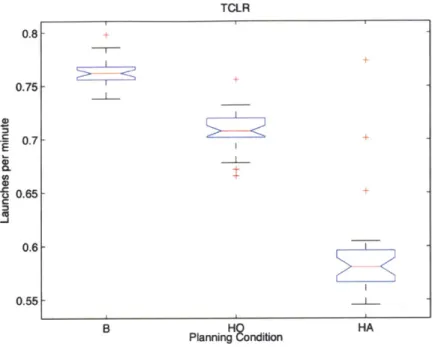
Figure I. 8. Total Catapult Launch Rate (TCLR)... 194
Figure I. 9. H alo V iolations (H V )... 195
Figure I. 10. Halo Violation Durations (HV-D). Spikes in plot imply 95% confidence interval notches extend past included data... 195
Figure I. 11. User Interaction Count (UIC). Spikes in plot imply 95% confidence interval notches extend past included data... 196
Figure I. 12. User Interaction Time (UIT). ... 196
Figure J. 1. Landing Zone Foul Time (LZFT). Spikes in plot imply 95% confidence interval notches extend past included data... 197
Figure J. 2. FMAC #6 Hydraulic Fluid Remaining (FMAC 6 HFR). Spikes in plot imply 95% confidence interval notches extend past included data. ... 197
Figure J. 3. FMAC #6 Emergency Aircraft Recovery Time (FMAC 6 EART)... 198
Figure J. 4. SMAC #2 Aircraft Active Time (SMAC 2 AAT). ... 198
Figure J. 5. SMAC #2 Emergency Fuel Remaining (SMAC 2 EFR)... 199
Figure J. 6. SMAC #2 Emergency Aircraft Recovery Time (SMAC 2 EART)... 199
Figure J. 7. Total Aircraft Taxi Time (TATT)... 200
Figure J. 8. Total Aircraft Active Time (TAAT)... 200
Figure J. 9. Total Crew Active Time (TCAT). ... 201
Figure J. 10. Wait Time in Queue in Marshal Stack (WTQMS). ... 201
Figure J. 11. Mission Duration (MD). ... 202
Figure J. 12. Halo Violations (HV)... 202
Figure J. 13. Halo Violation Durations (HV-D). ... 203
Figure J. 14. User Interaction Count (UIC). ... 203
Figure J. 15. User Interaction Time (UIT)... 204
Figure K. 1. Fuel Violation (FV)... 205
Figure K. 2. Landing Zone Foul Time (LZFT)... 205
Figure K. 3. SMAC #2 Aircraft Active Time (SMAC 2 AAT)... 206
Figure K. 4. SMAC #2 Emergency Fuel Remaining (SMAC 2 EFR)... 206
Figure K. 5. SMAC #2 EART (SMAC 2 EART)... 207
Figure K. 6. Total Aircraft Taxi Time (TATT). ... 207
Figure K. 7. Total Aircraft Active Time (TAAT)... 208
Figure K. 8. Total Crew Active Time (TCAT)... 208
Figure K. 9. Wait Time in Queue in Marshal Stack (WTQMS)... 209
Figure K. 10. Mission Duration (MD)... 209
Figure K. 11. Catapult 2 Launch Rate (C2LR)... 210
Figure K. 12. Catapult 3 Launch Rate (C3LR)... 210
Figure K. 13. Catapult 4 Launch Rate (C4LR)... 211
Figure K. 14. Total Catapult Launch Rate (TCLR)... 211
Figure K. 15. Halo Violations (HV). ... 212
Figure K. 16. Halo Violation Durations (HV-D). Spikes in plot imply 95% confidence interval notches extend past included data... 212
Figure K. 17. User Interaction Count (UIC). Spikes in plot imply 95% confidence interval notches extend past included data... 213
LIST OF TABLES
Table 1. M etric classes from prior work... 28
Table 2. Pina et al.'s [26, 27] metric classes and subclasses... 29
Table 3. Comparison of Algorithm Classes... 35
Table 4. Types of aircraft modeled in the DCAP simulation. ... 49
Table 5. List of crew groups (by color) and roles... 51
Table 6. Aircraft Carrier expert operator heuristics... 68
Table 7. DCAP Mission Performance Metrics. ... 75
Table 8. Possible Failures in the DCAP Simulation... 76
Table 9. DCAP Automation Behavior Efficiency Metrics [26, 27]. ... 82
Table 10. DCAP Human Behavior Efficiency Metrics [26, 27]... 85
Table 11. Human Behavior Precursor Metrics ... 86
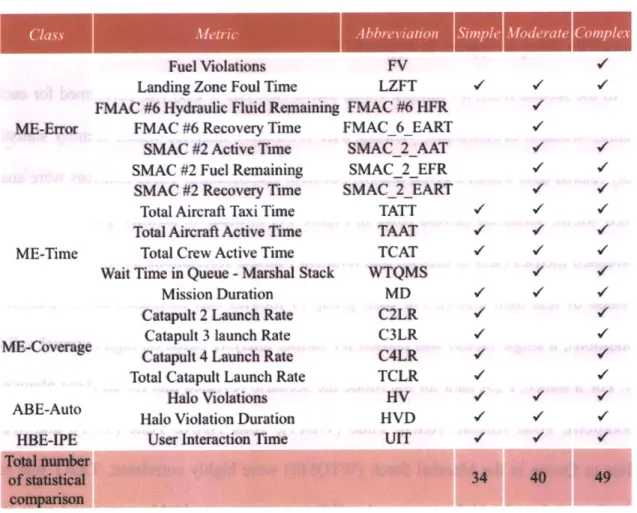
Table 12. Final list of DCAP Test metrics, with applicable scenarios (check marks, V, signify the test is applicable for the scenario)... 92
Table 13. Test significance levels desired for family-wise significance level of 0.05... 93
Table 14. Results of statistical testing for the Simple scenario (* signifies significance at a = 0.00 15; NP = Non-Parametric Mann-Whitney U Test)... 96
Table 15. Results of statistical testing for the Moderate Scenario (* signifies significance at a = 0.00 13; NP = Non-Parametric Mann-Whitney U Test; P = Param etric A N O V A ). ... 102
Table 16. Results of statistical testing for the Complex Scenario (* signifies significance at a = 0.001; NP = Non-Parametric Mann-Whitney U Test; P Param etric A N O V A ). ... 107
Table 17. Alternative complexity definitions for the DCAP test scenarios... 113
Table A. 1. List of Gaussian processing times for the DCAP simulation. ... 131
Table B. 1. Scenario Task Overview -Mission phase and subtasks... 134
Table B. 2. Scenario Task Overview -Replanning phase and subtasks... 135
Table B. 3. Scenario Task Overview - DCAP Replanning phase and subtasks... 145
Table B. 4. List of Situational Awareness Requirements (SARs). ... 150
Table B. 5. List of Situational Awareness Requirements (SARs), continued. ... 151
Table B. 6. Information Requirements for the DCAP Interface... 152
Table D. 1. List of aircraft with catapult reassignments... 163
Table D.2. Schedule assignment after manual replanning... 164
Table F. 2. PCA Results for the Simple scenario, Human-Only planning condition. .... 172 Table F. 3. PCA Results for the Simple scenario, Human-Algorithm planning
con d ition . ... 17 3 Table F. 4. Cross-Correlations for the Simple Scenario... 174 Table F. 5. PCA Results for the Moderate scenario, Baseline planning condition... 175
Table F. 6. PCA Results for the Moderate scenario, Human-Only planning
con dition . ... 17 6 Table F. 7. PCA Results for the Moderate scenario, Human-Algorithm planning
con dition . ... 17 7 Table F. 8. Cross-Correlations for the Moderate Scenario... 178 Table F. 9. PCA Results for the Complex scenario, Baseline planning condition... 179 Table F. 10. PCA Results for the Complex scenario, Human-Only planning
con d ition . ... 180
Table F. 11. PCA Results for the Complex scenario, Human-Algorithm planning
con d itio n . ... 18 1
Table F. 12. Cross-correlations for the Complex scenario. ... 182 Table G. 1. Results of Kolmogorov-Smirnov normality tests for the Simple scenario
(asterisks * denote that data was non-normal)... 183
Table G. 2. Results of Kolmogorov-Smirnov normality tests for the Moderate
scenario (asterisks * denote that data was non-normal). ... 184 Table G. 3. Results of Kolmogorov-Smirnov normality tests for the Complex
scenario (asterisks * denote that data was non-normal). ... 185
Table H. 1. Results of Heteroskedasticity tests for pairwise comparisons in the
Sim ple scenario... 187 Table H. 2. Results of Heteroskedasticity tests for pairwise comparisons in the
M oderate scenario... 188 Table H. 3. Results of Heteroskedasticity tests for pairwise comparisons in the
LIST OF ACRONYMS AA AAE ABE-Auto ANOVA ASP B B-HA B-HO CAG CTA
CW
CIL ClLR C2L C2LR C3L C3LR C4L C4LR DA DCAP DL DR DRT DS DVT EART EFD FMAC FMAC 6 AAT FMAC_6_HFR FMAC_6_EART FR FUAV FV GPS HA HBE-IPE hCTA HFV Airborne AircraftAttention Allocation Efficiency
Autonomous platform Behavior Efficiency - Autonomy ANalysis Of VAriance
Aircraft Schedule Panel Baseline planning condition
Comparison of Baseline and Human-Algorithm planning conditions
Comparison of Baseline and Human-Only planning conditions
Carrier Air Wing Commander Cognitive Task Analysis
Crew Working (variable in the Variable Ranking Tool) Carrier 1 Launches
Carrier 1 Launch Rate Carrier 2 Launches Carrier 2 Launch Rate Carrier 3 Launches Carrier 3 Launch Rate Carrier 4 Launches Carrier 4 Launch Rate
Deck Aircraft (variable in the Variable Ranking Tool) Deck operations Course of Action Planner
Decision Ladder Display Requirement Deck Resource Timeline
Deck Support vehicles (variable in the Variable Ranking Tool) Disruption Visualization Tool
Emergency Aircraft Recovery Time Event Flow Diagram
Fast Manned AirCraft
Fast Manned AirCraft #6 Aircraft Active Time Fast Manned AirCraft #6 Hydraulic Fluid Remaining
Fast Manned AirCraft #6 Emergency Aircraft Recovery Time Functional Requirement
Fast Unmanned Aerial Vehicle Fuel Violation
Global Positioning System
Human-Algorithm (planning condition)
Human Behavior Efficiency - Information Processing Efficiency subclass
Hybrid Cognitive Task Analysis Hydraulic Fluid Violation
HO HO-HA HRI HSC HV-D HV ILP IPE IR LP LZ LZFT MCO MD MDP ME-C ME-E ME-T MS P/RA PCA RRT SA SAGAT SAR SART SMAC SMAC 2 AAT SMAC 2 EART SMAC 2 EFR SME STO SUAV TAT TAAT TATT TCAT TCLR TUAT TV UAV UIT UU VRT WTAI
Human-Only (planning condition)
Comparison between Human-Only and Human-Algorithm planning conditions
Human-Robot Interaction Human Supervisory Control
Halo Violation - Duration
Halo Violation
Integer Linear Program
Information Processing Efficiency Information Requirement
Linear Program
Landing Strip/Landing Zone Landing Zone Foul Time Mars Climate Observer Mission Duration
Markov Decision Process
Mission Efficiency - Coverage subclass
Mission Efficiency - Error subclass
Mission Efficiency - Time subclass
Marshal Stack
Planning/Resource Allocation Principal Components Analysis Rapidly-exploring Random Tree Situational Awareness
Situational Awareness Global Assessment Tool Situational Awareness Requirement
Situational Awareness Rating Technique Slow Manned AirCraft
Slow Manned AirCraft #2 Aircraft Active Time
Slow Manned AirCraft #2 Emergency Aircraft Recovery Time Slow Manned AirCraft 32 Emergency Fuel Remaining
Subject Matter Expert Scenario Task Overview
Slow Unmanned Aerial Vehicle Total Active Time
Total Aircraft Active Time Total Aircraft Taxi Time Total Crew Active Time Total Catapult Launch Rate
Total Unmanned ground vehicle Active Time Total Violations
Unmanned Aerial Vehicle User Interaction Time User Utilization
Variable Ranking Tool
WTI WTO WTP WTQC WTQCrew WTQMS
Wait Time due to operator Interaction Wait Time due to Operator
Wait Time due to Processing Wait Time in Queue at Catapult Wait Time in Queue due to Crew Wait Time in Queue in Marshal Stack
1.
INTRODUCTION
Sheridan defined Human Supervisory Control (HSC) systems to be those in which "one or more human operators are intermittently programming and continually receiving information from a computer that itself closes an autonomous control loop through artifi-cial effectors to the controlled process or task environment" [1]. While Sheridan's origi-nal work considered the teleoperation of robots, HSC systems can also include systems that utilize automated algorithms to schedule task assignments or perform path planning for various agents [2-6]. These will be referred to as Planning and Resource Allocation, or P/RA, HSC systems, a model of which is provided in Figure 1 (adapted from Sheridan's original HSC model in [1]).
Controls - +Dt ik
-Displays + - Snos+
Human Planning/Resource Environment
Supervisor Allocation Algorithm
Figure 1. Human supervisory control diagram for P/RA HSC systems, modified from Sheridan [1].
Within a P/RA HSC system, the human operator engages a planning algorithm through a set of control interfaces in order to create a feasible plan of action. Once the plan has been deemed acceptable, it is transmitted to and implemented by the agents in the environment. The planning algorithm then monitors the execution of this plan via sensors in the environment, relaying information back to the operator through a set of display interfaces. A simple, but common form of this is the automobile GPS system, in
which drivers input a destination and a set of preferences to an automated planning algo-rithm, which returns a suggested driving path to the driver. After route acceptance, the system then continually updates the driver on the status of the route, sensed through a
GPS receiver, and relayed through a visual display and auditory alerts.
In more complex planning domains, such as military command and control environ-ments [7, 8], the value of P/RA HSC systems lies in the complementary capabilities of human and automated planners. Automated planning algorithms are capable of process-ing and incorporatprocess-ing vast amounts of incomprocess-ing information into their solutions. How-ever, these algorithms are brittle and unable to account for conditions that are outside the programmed parameters, especially in uncertain environments. [9]. Also, despite the speed at which algorithms can process information, human operators retain superiority in pattern recognition and the ability to adapt to changing conditions [10, 11]. The human ability to satisfice, or to provide feasible solutions that only address a subset of the over-all problem, has also been shown to be highly effective [12, 13]. Recent research has shown that by properly allocating functions between human operators and automated sys-tems, performance superior to either entity alone can be achieved [4, 14, 15]. In the con-text of P/RA HSC systems, human planners can rely on their experience to determine the factors most important to system performance (as they would otherwise do when satis-ficing). Communicating these factors aids the algorithm in the development of a local so-lution that often outperforms the soso-lutions generated by the human or algorithm individu-ally.
The design of P/RA HSC systems requires a systems engineering approach, which addresses the performance of both the human operator and the algorithm, the interactions
between them, and their ability to function together in executing system tasks [16]. This approach stems from the belief that successful system performance is a product of both effective component design and effective component integration. The Mars Climate Or-biter (MCO), for example, was destroyed on entry into the Martian atmosphere due to a difference in measurement units between two subcomponents [17]. Although the individ-ual units tested properly, the error in unit consistency went undetected, resulting in a total mission loss. While the MCO case is an extreme result, it highlights the necessity of evaluating interactions between components within the system. Regardless of the per-formance of the human operator and the algorithm within a P/RA system, if the two can-not effectively communicate in order to execute tasks, the overall effectiveness of the system will likely be diminished.
Viewing this from a systems engineering perspective, several models provide guid-ance for the development of P/RA HSC systems. Two of these models, the Waterfall [18] and "V" models [19], only address the highest level of process task definition (e.g., Analysis and Design in the waterfall model). This thesis will focus on a third model, the spiral model [20, 21], which divides these high level tasks into multiple phases of plan-ning, requirements definition, risk analysis, and testing. This set of four steps is continu-ally repeated throughout the process. Figure 2 shows a spiral model for the development of a generic software system. As the spiral moves outward, the design process moves from lower to higher levels of abstraction, beginning with a basic definition of the con-cept of operations in the center and concluding with final accon-ceptance testing and imple-mentation. The construction of the spiral model also provides guidance to the designer as to where to move if a test shows deficient system performance. For example, the
tion and Test stage includes the final assembly of system components and tests of their ability to interact effectively. Should this test fail, the engineering process should likely
return to the Design Validation and Verification stage to adjust component design
pa-rameters, or to the Integration and Test Plan stage if the method of component interfac-ing requires alteration.
CUMMULATIVE
COST PORS
OJECTIVES.STEPS ATETIVES
ALTERNATIVES, IDENTIFY,
CONSTRAINTS RESOLVE RISKS
RISK ANALYSIS
RISK ANALYSIS
RISK ANALYSIS d OPERATIONAL
COMMITMENT PROTOTYPE
PARTITION'. PROTOTYPE2
REVIEW aifb- .EMUL
---- R LS . CONCEPT OF MODELS BENCHMARKS PLAN OPERATION SOFTWARE
SOFTWARE DETA LED
PNXETLLVELRPRODUCTMETLNRIPLEMENSANC TAATION ESIGN
LOC
Figure 2. Systems engineering spiral model as adapted to software engineering [20, 21].
The spiral model in Figure 2 is used as a basis for discussion throughout the remain-der of this thesis. Specifically, this thesis will address the two final test steps, highlighted
in grey in Figure 2 - the Integration and Test and Acceptance Test stages. The former
addresses the effectiveness with which the human operator and the algorithm interact within the system, while the latter addresses the ability of the combined system to effec-tively perform tasks in the environment. This thesis will address the development of
22
measurement metrics and a testing protocol for evaluating the performance of P/RA HSC systems in these two test steps, addressing both the human and algorithmic components of the system. The testing protocol and measurement metrics should also be generalizable to a wide range of P/RA HSC system domains and algorithm formats. The metrics devel-oped for this protocol are both descriptive and diagnostic, providing empirical compari-son points between systems while also identifying the properties of a single system that led to its efficiency (or inefficiency).
1.1. PROBLEM STATEMENT
A systems engineering approach to the evaluation of P/RA HSC systems requires a holistic, comprehensive testing protocol. An obstacle to the creation of this protocol is a lack of both standardized metrics and a standardized methodology of metric definition. While standardized metrics and frameworks exist for defining the performance of both
human operators [22, 23] and automated planning algorithms [24, 25], no standardized
frameworks are currently in place for the interaction between humans and automated P/RA systems, or for system (mission) performance overall.
System
No standardsHuman
Automated
Operators
Systems
Known Known standards standardsFigure 3. Existence of standardized metrics for HSC systems. . .. ... ... - ... ... ..... ... -_..._..._- I ... ..
The goal of this thesis is to understand how a set of metrics should be defined for and applied to a P/RA HSC system, and how an analysis of the resulting data can provide in-sight into the strengths and weaknesses of a human-automation collaborative system. A metric class hierarchy from prior literature [26, 27] is used to guide the creation of met-rics for a representative P/RA HSC system, the Deck operations Course of Action Plan-ner (DCAP). The DCAP system utilizes an automated scheduling algorithm to aid opera-tors in replanning tasks in the aircraft carrier deck environment, which is generalizable to a large number of planning and resource allocation HSC systems. Metrics are defined for this system and utilized in an experimental simulation testbed that examines performance over varying complexity levels. The discussion of these testing results addresses both the comparison of system performance within each testing scenario, as well as the perform-ance of the systems across complexity levels. The next section of this chapter details the specific research questions that will be addressed in this thesis.
1.2. RESEARCH QUESTIONS
This thesis addresses three specific questions:
1. What metrics are required for the evaluation of a Planning and Resource Allocation
Human Supervisory Control system as compared to manual planning?
2. How can these metrics assess the variations in performance of human and combined human-algorithm planning agents?
3. How can these metrics predict system feasibility and highlight possible design
1.3.
THESIS OVERVIEWThis thesis is organized into six chapters. Chapter 1, Introduction, describes the moti-vation and research objectives for this thesis. Chapter 2, Prior Work, details prior re-search concerning planning and resource allocation algorithms and the creation of metrics for human performance, automated algorithm performance, and the interaction between these elements. Chapter 3, the Deck Operations Course of Action Planner (DCAP), ex-plains the features of the DCAP system and its embedded automated algorithm. Chapter 4, Performance Validation Testing, describes the creation of the metrics used in the analysis of the DCAP system, the testing scenarios, the creation of a set of operator plan-ning heuristics, and subsequent testing of the system. Chapter 5, Results and Discussion, details the results of the application of the defined metrics to the resultant simulation data and the information gained from this process. Chapter 6, Conclusions and Future Work, reviews the contributions of this research in regards to the defined research questions and
2.
PRIOR WORK
This chapter provides a review of metrics previously used in validating the perform-ance of planning algorithms and HSC systems (including both P/RA and more generic
HSC systems). The first section in this chapter presents a framework for HSC metric
classification taken from prior literature. This framework is used as an organizational tool for the remaining sections of the chapter, which provide details on the specific types of metrics utilized in prior literature.
2.1. THE HSC METRIC HIERARCHY
Several non-standardized metric class hierarchies have been developed for HSC sys-tems [28-31]. Metrics can be differentiated into classes according to their attributes, pri-marily in terms of the object of the application. P/RA HSC metrics can be separated into classes for Human, Automation, and Mission performance as well as Human-Automation Interaction. Mission Performance metrics describe the ability of the system, as a whole, to accomplish its goals in the environment. Automation Performance describes the ability of the automated components - such as automated algorithms or sensors - to perform their specific tasks. Measures of Human-Automation Interaction typically describe the active processes the operator uses to input commands to or acquire information from the system (e.g. mouse clicks), while Human Performance measures typically describe fea-tures native to the human operator (such as fatigue or stress). Table 1 provides a brief representation of four prior metric hierarchies according to this metric class structure.
Table 1. Metric classes from prior work.
Olsen and Goodrich [28] X X X
Steinfeld et al. [29] X X X X
Crandall and X X X
Cummings [30]
Scholtz [31] X X
Olsen and Goodrich's hierarchy [28] focused almost exclusively on quantifying robot performance, with most metric classes excluding measures for the human operator; those that considered human operators examined only their interaction with the autonomous platform. Steinfeld et al. [29] included classes addressing both the human and automated aspects of the system, as well as the effectiveness of the overall system. However, the class of human performance metrics did not differentiate between human-automation in-teraction and individual human performance measures. Steinfeld's hierarchy also lacked
depth in the definitions for human and system performance (only three metrics appear in each category), but did provide numerous metrics for automation performance.
Crandall and Cummings [30] created metrics for single-robot and multi-robot systems and created additional measures addressing human interaction. This hierarchy did not in-clude direct measures of system performance, although it did provide a differentiation between human performance and human-automation interaction. Scholtz's [31] hierarchy addressed measures dealing primarily with the human operator and their interaction with the system, but lacked metrics for system performance and automation performance.
While each of these four hierarchies is lacking in some manner, they combine to ad-dress each of the aspects of P/RA HSC systems as depicted in Figure 3. However, as a
whole, only the automation performance class contains a large number and variety of ex-ample metrics; the remaining categories only include few, if any, exex-amples. These defi-ciencies were also noted by Pina et al. [26, 27], who incorporated the work of these (and other) authors in creating an expanded and detailed categorical structure for HSC metrics. The five main categories developed from this work, with additional subcategories, are shown in Table 2.
Table 2. Pina et al.'s [26, 27] metric classes and subclasses.
- Tine based * Adequacy - Attention e Cognitive # Between
" Error based e Autonomy Allocation Precursors Humans
- Coverage * Usability Efficiency - Physical * Between
based . Self- Information Precursors Autonomous
awn s Processing systems
Efficiency + Between
Human and Automation
Pina et al.'s [26, 27] five metric classes consider each of the various aspects of a gen-eral HSC system and encompass much of the previous metric hierarchies, while also pro-viding additional detail in the definition of subclasses for each category. Pina et al. also include an additional class of Collaborative measures, which is an additional perspective on human-automation interaction. Collaborative measures address the sociological as-pects of the system, considering the automation to be a member of the "team" of opera-tors performing system tasks. These measures may address the effectiveness of collabora-tion between multiple human operators, multiple automated agents, or between human and automation.
Mission Efficiency metrics measure the performance of the system as a whole as it
performs tasks within its domain - a critical issue in the Acceptance Test stage in the
spi-ral model. The remaining categories address the performance of individual subcompo-nents and their efficiency of interaction, supporting the Integration and Test stage in the spiral model. Autonomous Platform Behavior Efficiency contains measures for the effec-tiveness of an algorithm in its computations and its capability to support the human op-erator in his/her tasks. Human Behavior Efficiency measures address the performance of the human operator as he or she engages the system through both cognitive (information extraction) and physical (command input) means. Human Behavior Precursor metrics ex-amine the endogenous factors that affect human interactions (such as physical and mental fatigue or operator situational awareness). The final category, Collaborative Metrics, ad-dresses the degree to which human users and automated agents are able to work together to accomplish tasks. Figure 4 highlights how Pina et al.'s classes of metrics apply to the P/RA HSC metric hierarchy originally shown in Figure 1.
Mission Efficiency
7
Figure 4. HSC diagram highlighting Pina's metric classes ----- -- ___ -- ____ ... ..... .......
The metrics included in these categories can fulfill both descriptive and diagnostic roles. All metrics are descriptive with respect to some aspect of the system. For Plan-ning/Resource Allocation systems, descriptive metrics document the objective perform-ance of the system and its subcomponents (the human operator and algorithm). For a path planning system, a descriptive Mission Performance measure may address the total travel time on the path or the cost of the path (e.g. total work). Descriptive measures for the al-gorithm may address the total time required to replan or make take the form of a scoring function applied to the solution. A descriptive measure for the human operator may in-clude a rating of their situational awareness or trust in the system.
These same measures can also be used in a diagnostic manner, explaining the per-formance of other metrics. While total mission completion time is a widely used descrip-tive measure, it has no ability to explain the conditions within the environment that lead to its final value. This can only be revealed by additional diagnostic metrics that illumi-nate specific details of the performance of the system. For instance, a metric noting that the human operator required more time to execute replanning tasks may provide one ex-planation for high values of mission completion time. Metrics demonstrating that the sys-tem performed poorly on a single mission subtask may provide an alternate explanation for this same factor. Additionally, a second round of diagnostic measures can be applied to each of these cases in order to determine why the human operator required more time to replan (longer time to perform a replanning subtask) or why the mission subtask re-quired more time (deadlock in path planning or unnoticed failure). This can continue it-eratively until a definite root cause explanation is obtained.
The ultimate goal of the system is to provide maximum effectiveness in performing tasks in the environment, which is revealed primarily by measures of Mission Efficiency. However, in cases where poor mission performance is seen, descriptive measures may not effectively identify the mechanisms leading to problems. Thus, a combination of met-rics addressing each of these factors - the mission, human operator, algorithm, and hu-man-automation interaction classes- is needed to provide a full analysis of the system
[26, 27]. The remaining sections of this chapter will address measures for each of these
aspects individually as they relate to P/RA HSC systems.
2.2. METRICS FOR MISSION EFFICIENCY
Measures of Mission Efficiency address the ability for the complete HSC system to perform tasks in the world, and exact definitions for these measures depend on the envi-ronment in which the HSC system acts. Pina et al. [26, 27] differentiated measures of Mission Efficiency measures into Error-based, Time-based, and Coverage-based meas-ures. This section will address these measures and provide examples used in prior studies, focusing on those used in P/RA systems.
Error measures identify the number of errors that occur in the execution of the P/RA system solution. Errors can be attributed to either the human or the automation perform-ing inappropriate actions (errors of commission) or not fulfillperform-ing desired objectives (er-rors of omission). For a path planning P/RA system, the returned solution may be a path that avoids specific areas (such as threat zones) while minimizing costs or collisions [4,
32, 33]. Error measures for such a path planning system may track how many collisions
commission). In other cases, the inability to address tasks within a given time window [34, 35] can be considered as errors of omission (failing to perform certain tasks). These measures are descriptive and diagnostic only with respect to the performance of the re-turned solution. The identification of the specific actions on the part of the human opera-tor or the algorithm that lead to this performance can appear in other metric classes.
Time-based measures include all temporal measures, primarily addressing the total time of solution execution (the mission time or mission duration) [36-40]. By definition, however, these are limited to systems with a temporal component. For P/RA HSC sys-tems that perform time-independent task allocations, these measures may not be impor-tant.
Coverage-based metrics can also be included in some cases [3, 41, 42]. A common application of military P/RA planning systems is in target destruction tasks, where an al-gorithm supports a human operator in identifying, tracking, and destroying hostile targets. In some cases, the number of targets may outnumber the available resources, making the destruction of every target impossible. The percentage of total targets destroyed can be used as a measure of overall performance for the system [41]. Additionally, a measure of missiles fired per enemy target destroyed is descriptive in terms of the actions of the al-gorithm but may also be diagnostic in revealing the efficiency of system actions. In this case, high values of missiles fired per target destroyed can explain poor overall perform-ance (e.g., the system did not effectively utilize its resources or the missiles had difficulty in reaching and destroying targets) [42].
These Mission Efficiency measures examine the effectiveness of the generated solu-tion in light of the system objectives, but they are not the sole indicator of a well-performing system [16]. These measures are, however, the primary descriptive metrics of the system and are often the primary criterion on which system implementation is based. These measures are also affected by the individual performance of the human operator and the algorithm and the quality of interaction between the two, each of which must be considered in the course of system evaluation. The next section will address one of these aspects - the ability of the algorithm to support the mission, described by measures of Autonomous Platform Behavior Efficiency.
2.3. METRICS FOR AUTONOMOUS PLATFORM BEHAVIOR
EFFI-CIENCY
In P/RA HSC systems, an algorithm does not necessarily exist as an independent agent and may interact with a human operator in order to perform system tasks. In this regard, the algorithm must perform adequately within the system and provide sufficient support for mission operations. The ability of the algorithm and the associated interface to accomplish these objectives was included as part of Autonomous Platform Behavior Efficiency in Pina et al.'s metric hierarchy [26, 27]. However, in selecting metrics that
define the performance of the automated algorithm, the type of algorithm and the domain of application will determine the number of applicable metrics. Before providing exam-ples of Autonomous Platform Behavior Efficiency, this section will review common types of algorithms used in P/RA HSC systems and the domains to which they are ap-plied.
2.3.1. Common Algorithms for Planning and Resource Allocation
Several different forms of planning algorithms have been proposed for, or imple-mented in P/RA HSC systems [8, 15, 32, 33, 36, 40, 43-45]. However, these various al-gorithms can be grouped into three categories based upon the assumptions made and ac-tions taken by the algorithms. These three classes are Deterministic, Probabilistic, and Heuristic algorithms [46, 47]. Table 3 provides a brief comparison of these algorithm classes.
Table 3. Comparison of Algorithm Classes.
Deterninistic Probabilistic Heuristic
Algoritmns Algorithms Algorithms
Assmed knowledge Complete Incomplete Incomplete
Fully defined cost Probability density
Decision basis functions and functions Heuristic rules
constraints
MILPs. Dynamic MDPs, Kalman/particle Tabu search
Examples Programming, filtering, RRTs Hill-climbing
Clustering f R algorithms
Deterministic algorithms utilize explicit cost functions and constraint models to per-form an exhaustive search of the domain. For correct solutions, these algorithms require access to all information relating to these cost and constraint models. If this information is accessible, these algorithms will return an optimal solution (if one exists). This class includes Mixed-Integer Linear Programs [32, 44, 45], graph exploration algorithms such as Breadth- and Depth-first search, potential fields [36, 40], and many other forms [8, 15,
In contrast with deterministic algorithms, probabilistic algorithms [48-51], such as Markov Decision Processes (MDPs), assume incomplete knowledge about the world and calculate responses based on probability models. Kalman and particle filters also fall within this class, but instead use mathematical filtering techniques to reduce the level of incompleteness of information. For instance, systems performing target tracking may not know the exact location of the target to be tracked, but may be able to build a probability density function describing the likelihood of the target's location on the map [49].
Heuristic algorithms [37, 41, 52-59] also assume incomplete information about the world, but do not rely on probabilities in order to make choices. Instead, heuristic algo-rithms rely on a set of heuristics - "rules of thumb" [60] - to calculate responses. For these cases, the exact equation describing optimality may not be known, due to either problem complexity or to the inability to model certain constraints accurately. In this case, a heuristic function, such as a scoring metric [61, 62], can be used to judge the rela-tive performance of the system. This class of algorithms includes Tabu search [41, 52-54]
and hill-climbing algorithms [61, 62], as well as several other forms [37, 55-59].
The amount and types of data available from the environment can influence the choice of algorithm for the system. Deterministic algorithms typically require complete data on the state of the world. For a tracking task, the algorithm requires precise informa-tion on the terrain, the current posiinforma-tion of the target, and informainforma-tion about the current state of tracking vehicle and its capabilities. Probabilistic algorithms can compensate for cases where the system does not have precise information on the location of the target, as noted above. The system's solution could be optimal on average but may not be optimal for any one case. Heuristic algorithms can be used when the characteristics of an optimal
solution or the world are not known, or if the problem space is complex enough that complete, feasible solutions are not expected. In this case, the system iterates through possible solutions, selecting candidates for the next iteration based on a set of basic rules. These algorithms do not guarantee optimality, and instead seek solutions that reach a cer-tain threshold of performance - a concept known as "satisficing" [63].
By definition, HSC systems require the presence and interaction of human operators
in order to accomplish tasks. The required level of interaction may vary as described by Sheridan's ten levels of automation, listed in Figure 5.
Autoatin LvelAutomationt Descriptionl
The computer offers no assistance
2 The computer offers a complete set of decision/action alternatives, or
3 Narrows the selection down to a few, or
4 Suggests one alternative, and
5 Executes that suggestion if the human approves, or
6 Allows the human a restricted time to veto before automatic execution, or
7 Executes automatically, then informs humans, and
8 Informs the human only if asked, or
9 Informs the human only if it, the computer, decides to.
10 The computer decides everything and acts autonomously, ignoring the human Figure 5. Sheridan and Verplank's Ten Levels of Automation (adapted from [64]).
In one extreme (Level 1), the human operator performs all tasks without any aid from the automated system. At the other extreme (Level 10), the automated system performs all tasks, requiring no assistance from (and offering no notifications to) the human opera-tor. The remaining eight levels comprise the majority of Human Supervisory Control sys-tems, with operator workload and input gradually decreasing as level increases. For the case of P/RA systems, many exist in the range between Level 3 (the automated system
provides several options) and Level 6 (the system executes a suggested solution unless vetoed by human operator). In each of these cases, the human operator and automated system work collaboratively in order to perform a shared task, with the operator possibly providing suggestions to the system or selecting (or vetoing) one of several suggested solutions. In this context, the performance of the P/RA algorithm requires measuring the ability of the algorithm to support these collaborative mission-replanning tasks. These measures of Automation Platform Behavior Efficiency are discussed in the next subsec-tion.
2.3.2. Measures of Autonomous Platform Behavior Efficiency
Pina et al. divided measures for Autonomous Platform Behavior Efficiency into four categories (Table 2). Measures of Adequacy address the ability of the algorithm to sup-port the mission computationally, focusing on the accuracy and reliability of the algo-rithm. Originally, this category only considered qualitative measures for the entire HSC system and did not differentiate between the interface and the algorithm. For P/RA sys-tems, this can be expanded to include traditional algorithm performance measures such as runtime and error (infeasibility/incompleteness) rates (see [24, 25, 65-70] for examples). Within P/RA systems, ideal algorithms would be both highly reliable and highly accurate, accepting user inputs and creating valid plans with no errors.
In the context of P/RA systems, measures of Usability address the human operator's subjective opinions of the algorithm's ability to support the mission, as well as the ability of the user to understand how to interact with the algorithm through the display and con-trol interface. This may involve a subjective evaluation of the system by the user [37, 71]
or asking the user to explain their thought processes during interaction [72, 73]. In other cases, these qualitative measures have been operationalized into quantitative measures
[74-77], such as tracking the order and duration of user's interactions with the system and
comparing these to the actions of an expert user [74-76]. With regards to P/RA systems, these measures may also ask the user to evaluate the performance of and their ability to understand the algorithm through surveys [3] or other means. The goal of these measures is to determine the ease of use of the algorithm - that the user is able to understand its actions, able to predict its performance, and understand how to appropriately interact with the algorithm.
Autonomy refers to how well the system is able to function without operator interac-tion. This measure has its roots in Human Robot Interaction (HRI) research [6, 28, 30, 35,
78-80], where the performance of one or more robots can degrade over time. This
re-sulted in measures of "neglect" [28, 78] that judged how long the system could maintain performance above a certain threshold without operator input. This may not be an appli-cable measure for every P/RA algorithm. If the current plan or schedule does not degrade in performance until an exogenous event occurs, and the algorithm requires human inter-action in order to replan, neglect tolerance is dependent on the occurrence of the exoge-nous event and not on the algorithm. For all systems that do not exhibit these two condi-tions, typical measures of neglect tolerance apply.
Self-awareness is primarily intended for autonomous systems that can independently self-monitor and self-diagnose their performance. In the context of P/RA systems, this would involve the ability of the algorithm to relate the actual performance of its solutions to the predicted performance. This could potentially lead to the algorithm adjusting its
parameters as time continues (known as "on-line" learning; see [81]). For a P/RA system, the inclusion of this ability would be beneficial to the embedded algorithms. However, this is still an area of emerging research [82-84] and is beyond the scope of this present work.
Metrics within the class of Autonomous Platform Behavior Efficiency address the performance of the automated algorithm and its ability to support the P/RA HSC system in its tasks. While these measures address the planning algorithm and its responses to human input, they do not address the performance of the human operator as he or she in-teracts with the system. These measures for human performance are divided into catego-ries of Human Behavior Efficiency and Human Behavior Precursors and are addressed in the next section of this chapter.
2.4. METRICS FOR HUMAN PERFORMANCE
Human performance can be characterized along two dimensions. Measures for Hu-man Behavior Efficiency address the effectiveness with which the huHu-man operator ac-tively engages the system through the interface elements, acquiring information and exe-cuting tasks. Human Behavior Precursors address how the efficiency of this interaction is affected by certain endogenous factors inherent to the human operator. These precursors simultaneously both influence and are influenced by Human Behavior Efficiency. Each of these factors will be discussed individually in the following subsections, beginning with Human Behavior Efficiency.
![Figure 1. Human supervisory control diagram for P/RA HSC systems, modified from Sheridan [1].](https://thumb-eu.123doks.com/thumbv2/123doknet/14103017.465819/19.918.154.815.576.743/figure-human-supervisory-control-diagram-systems-modified-sheridan.webp)
![Figure 2. Systems engineering spiral model as adapted to software engineering [20, 21].](https://thumb-eu.123doks.com/thumbv2/123doknet/14103017.465819/22.918.219.683.342.763/figure-systems-engineering-spiral-model-adapted-software-engineering.webp)