Publisher’s version / Version de l'éditeur:
Vous avez des questions? Nous pouvons vous aider. Pour communiquer directement avec un auteur, consultez la première page de la revue dans laquelle son article a été publié afin de trouver ses coordonnées. Si vous n’arrivez pas à les repérer, communiquez avec nous à [email protected].
Questions? Contact the NRC Publications Archive team at
[email protected]. If you wish to email the authors directly, please see the first page of the publication for their contact information.
https://publications-cnrc.canada.ca/fra/droits
L’accès à ce site Web et l’utilisation de son contenu sont assujettis aux conditions présentées dans le site LISEZ CES CONDITIONS ATTENTIVEMENT AVANT D’UTILISER CE SITE WEB.
Client Report (National Research Council of Canada. Construction), 2015-10-30
READ THESE TERMS AND CONDITIONS CAREFULLY BEFORE USING THIS WEBSITE. https://nrc-publications.canada.ca/eng/copyright
NRC Publications Archive Record / Notice des Archives des publications du CNRC :
https://nrc-publications.canada.ca/eng/view/object/?id=2e8047b5-6f4b-481f-94a4-bba5bf72279d https://publications-cnrc.canada.ca/fra/voir/objet/?id=2e8047b5-6f4b-481f-94a4-bba5bf72279d
NRC Publications Archive
Archives des publications du CNRC
For the publisher’s version, please access the DOI link below./ Pour consulter la version de l’éditeur, utilisez le lien DOI ci-dessous.
https://doi.org/10.4224/23002870
Access and use of this website and the material on it are subject to the Terms and Conditions set forth at
High performance roofing and walls technologies: task 4, thermal
performance testing of a curtain wall panel
Construction
High Performance Roofing and
Walls Technologies
Task 4: Thermal Performance Testing of a
Curtain Wall Panel
Client Report: A1-002844-04
Michael A. Lacasse, Hamed H. Saber and W. Maref
30 October 2015
REPORT A1-002844.04 iii
Table of Contents
Table of Contents ... iii
List of Figures ... v
List of Tables ... vii
Summary ... ix
Acknowledgements ... xi
1. Background ... 1
2. Objective ... 1
3. Experimental Approach and Description ... 1
3.1 Approach ... 1
3.2 Descriptions of test facility, methods, and specimen ... 2
3.2.1 Description of Test Facility ... 2
3.2.3 Description of Test Specimen ... 4
4. Results ... 8
4.1 Results derived from testing ... 8
5. Summary ... 11
REPORT A1-002844.04 v
List of Figures
Figure 1 —Notio al s he ati of a Guarded hot o test fa ilit to deter i e the ther al resista e
of wall assemblies (Vertical Section) ... 3
Figure 2 – Elevation and sectional drawings of curtain wall test specimen ... 5
Figure 3 – Sectional drawing of curtain wall mullion (Section No. 002/02 of Fig 1); Photo showing end portion of horizontal section. ... 6
Figure 4 – Sectional drawing of curtain wall mullion at opaque panel (Section No. 002/02 of Fig 1) ... 6
Figure 5 – Location of thermocouples (1-47) o e terior of urtai all asse l ... 7
Figure 6 – Location of thermocouples (1-47) o i terior of urtai all asse l ... 8
Figure 7 – Results of thermocouples measurements (1-47) for e terior of urtai all asse l a d showing average steady state temperatures are given locations ... 9
Figure 8 – Results of thermocouples measurements (1-47) for i terior of urtai all asse l a d showing average steady state temperatures are given locations ... 10
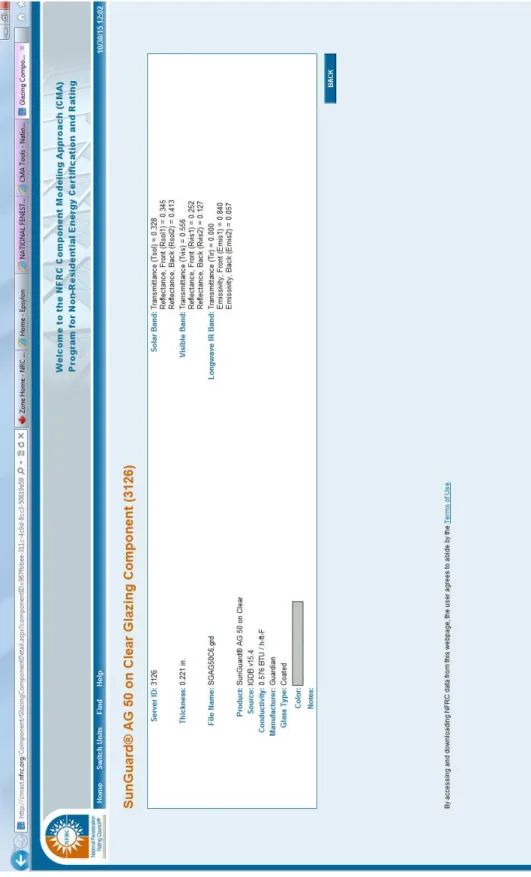
Figure 9 – Performance of IGU supplied to Epsylon curtain wall manufacturer; glazing manufacturer: Multi er ... 12
REPORT A1-002844.04 vii
List of Tables
Table 1 – Thermal and light transmission performance properties of double-glazed IGU ... 5 Table 2 – Test Results & Calculated U-value for curtain wall assembly ... 11 Table 3 – Average temperature measurements for respective interior & exterior locations (1-47) of
curtain wall assembly ... 14 Table 4 – Assigned contributory area (mm2 & m2) for respective interior & exterior thermocouple
locations (1-47) of curtain wall assembly ... 15 Table 5 –Surface temperatures and corresponding assigned areas for respective interior & exterior
REPORT A1-002844.04 ix
Summary
In 2012 the NRC-Construction initiated a project on the “High Performance Walls and Roofing Technologies Next Generation Technologies R&D – Building Envelopes”. Partnership and funding for the project was obtained from NRCan (Housing and Buildings /Sustainable Building and Communities CANMET / Group) under the Program of Energy Research and Development (PERD).
In commercial buildings, curtain wall systems often cover a significant part of the building envelope, and therefore their impact on the overall thermal performance of the building is important. In order to evaluate, compare and improve curtain wall designs, one requires insights to the different calculation and evaluation methods, and as well, knowledge of the state-of-the-art in thermal optimization of curtain walls.
The overall objective of this project was to improve the thermal efficiency of commercial building envelopes. This was achieved by using different approaches to improve the overall effective R-values of the curtain wall systems.
The project consisted of a number of Tasks in which curtain walls were evaluated, compared and suggestions made for improvement to the thermal performance of such systems, and include:
o Task 1: Literature review on Curtain Walls
o Task 2: Curtain Walls and National Energy Code for Buildings 2011 o Task 3: Thermal Optimization in Curtain Walls: Part I - Modelling o Task 4: Thermal Performance Testing of a Curtain Wall Panel
o Task 5: Benchmarking the Thermal Performance of a Curtain Wall Panel through Simulation o Task 6: Development of Guidelines for the Selection of Curtain Wall Components
This report focuses on Task 4: Thermal Performance Testing of a Curtain Wall Panel. The full-scale testing of a thermally broken, double-glazed, commercially available, curtain wall system was carried out at test laboratories of CLEB Building Sciences, located in Varennes (QC) in collaboration with this company and with the oversight of Mr. Mario Goncalves. A curtain wall system was supplied by a Canadian manufacturer Epsylon Concept, Inc. of Quebec City (QC).
Accordingly, in this report a description of the experimental work required to test the thermal performance of the curtain wall system is provided. Details are provided on the test specimen, test method and instrumentation of tests. Full-scale testing determined the thermal transmittance of a
thermally broken, double-glazed, commercially available, curtain wall assembly using a guarded hot box test facility and in accordance with standard industry methods for assessing thermal performance of curtain wall assemblies.
The test results indicated that this double-glazed, thermally-broken curtain wall system had an effective thermal transmittance (U-value) of 1.7 W/(m2•K), thermal resistance of 0.42 (m2C)/W, and
REPORT A1-002844.04 xi
Acknowledgements
NRC wishes to acknowledge the partnership and funding for the project as provided by NRCan (Housing and Buildings /Sustainable Building and Communities CANMET / Group) under the Program of Energy Research and Development (PERD). More specifically, NRC acknowledges the close collaboration with NRCan and the Sustainable Building and Communities group of CANMMET, and in particular, the support provided by Dr. Anil Parekh in completing the work delivered in this project.
NRC also wishes to acknowledge the support of CLEB Building Science, Varennes, QC, for having carried out the guarded hot box test and Epsylon Concept Inc., Quebec City, QC for having supplied the curtain wall specimen.
REPORT A1-002844.04 xiii
High Performance Roofing and Walls Technologies
–
Task 4
– Thermal Performance Testing of a Curtain Wall Panel
Authored by:
Michael A. Lacasse, Ph.D., P.Eng., Hamed H. Saber, Ph.D. and Wahid Maref, Ph.D.
A Report for the
Natural Resources Canada (NRCan)
Housing and Buildings
Sustainable Building and Communities CANMET / Group
ATT: Mr. Anil Parekh
National Research Council Canada Ottawa ON K1A 0R6 Canada
30 October, 2015
This report may not be reproduced in whole or in part without the written consent of both the client and the National Research Council of Canada
REPORT A1-002844.04 1
High Performance Roofing and Walls Technologies
Task 4 – Thermal Performance Testing of a Curtain Wall PanelFinal Report Task 4
Michael A. Lacasse, Hamed H. Saber and W. Maref
1. Background
In this report, experimental work is described in which the thermal performance of a typical thermally broken North-American curtain wall (CW) assembly, as provided by a local manufacturer, was evaluated in accordance with prescribed industry test methods. The curtain wall assembly incorporated double-glazed insulated glass units (IGU) and used a typical spandrel panel section design. The intent of undertaking such work was to obtain the thermal response of the CW unit in sufficient detail to permit benchmarking the thermal performance to that subsequently obtained through simulation. The results from simulation would later inform on the expected gains in thermal performance of the assembly as might be derived from improvements in the U-value of, for example, the IGU (center of glazing), IGU spacer (edge of glazing), spandrel panel, CW frame or as might be achieved through variations in the ratio of the vision glass to opaque portion of the CW. This later work on simulation is described in a companion report for Task 5, entitled: “Thermal performance modelling of selected curtain wall assemblies”.
2. Objective
The objective of this ask was to undertake the thermal performance assessment of a curtain wall assembly in accordance with established industry standards, and from which the thermal response of the assembly could be used to benchmark NRC’s simulation model, hygIRC-C1.
3. Experimental Approach and Description
3.1 Approach
The thermal performance of a locally obtained, commercially available, curtain wall assembly2 was determined on the basis of testing in accordance with NFRC 1003, specifically
1
hygIRC-C – Comsol Multiphysics package
2 High performance, thermally broken, curtain wall system 3
NFRC 100-2014,2014, Procedure for Determining Fenestration Product U-Factors, National Fenestration Rating Council, Inc., Greenbelt, MD, 2013
TASK 3—THERMAL OPTIMIZATION IN CURTAIN WALL DESIGN
REPORT A1-002844.04 2
ASTM C1363- Standard Test Method for Thermal Performance of Building Materials and Envelope Assemblies by Means of a Hot Box Apparatus4 and ASTM C1199 - Standard Test Method for Measuring the Steady-State Thermal Transmittance of Fenestration Systems Using Hot Box Methods5. A description of the test facility, test method, and test specimen, including instrumentation and calibration, is provided in the subsequent sections.
3.2 Descriptions of test facility, methods, and specimen
3.2.1 Description of Test Facility
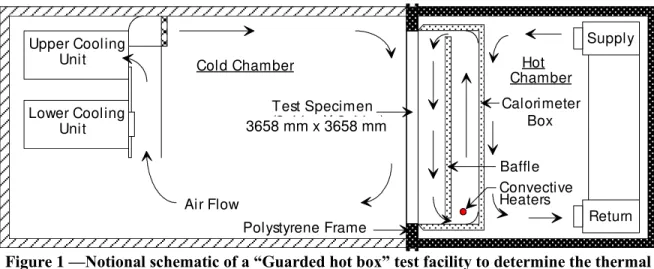
A “Guarded hot box” (GHB) test facility was used for the determination of the thermal transmittance of a typical curtain wall panel section; a schematic of the notional test facility is shown in Figure 1.
Generally described, the facility consists of a cold chamber and hot (warm) chamber between which is installed a wall test specimen that is mounted into an opening in the cold chamber. The periphery of the test specimen is sealed tight to the mask (surround panel) of the test frame to prevent movement of air across the specimen. A calorimeter (heat source and metering box) is attached to the specimen within the warm-side chamber and positioned against the specimen frame; it is used to measure heat flow through the specimen. A temperature difference is created across the test specimen over a specified period of time such that a steady state heat transfer through the specimen is maintained and from which heat loss measurements can be taken. During a steady state test, the calorimeter air temperature is maintained constant at the prescribed test temperature conditions and the power necessary to maintain this condition is continuously monitored and thereafter equated to the heat loss through the test specimen. The estimated heat flow across the test specimen can be measured by the calorimeter to an accuracy of ± 3% in respect to opaque wall specimens and to ± 6% in regard to a window or door specimens.
3.2.2 Test method for assessing thermal performance
The test method used to assess the thermal performance of the CW assembly is described in standards ASTM C1363 and ASTM C1199, a summary of which is provided here.
The test specimen is installed in a GHB test facility (Figure 1) and thermocouples are installed to either face of the specimen. Thereafter, the calorimeter is mounted to the warm side of the specimen, the warm and cold side chambers brought together, and a temperature difference (e.g. 40°C) across the wall is created through the cooling within the cold side chamber (e.g. -20°C) whilst the warm side chamber is maintained at a prescribed temperature (e.g. 20°C).
4
ASTM C1363 - 11 Standard Test Method for Thermal Performance of Building Materials and Envelope Assemblies by Means of a Hot Box Apparatus; ASTM International, ASTM International, West Conshohocken, PA, USA; 44 p.; DOI: 10.1520/C0033-03, www.astm.org.
5 ASTM Standard C1199-14, 2014, Standard Test Method for Measuring the Steady-State Thermal Transmittance of
Fenestration Systems Using Hot Box Methods, ASTM International, West Conshohocken, PA, 2011, DOI: 10.1520/C0033-03, www.astm.org.
REPORT A1-002844.04 3
Figure 1 —Notional schematic of a “Guarded hot box” test facility to determine the thermal resistance of wall assemblies (Vertical Section)
After steady state temperature has been achieved continuously over a period of 6 hours, measurements are taken over the subsequent 2 hours to determine values for:
Heat flow rate, specifically, from the heater, fan, thermopile and surround panel; measurements for heat flow, were recorded every minute over the measurement period to ± 0.01 W;
The average steady state temperatures of the air (grid), respectively, of the warm side, ��, and cold
side chambers, ���; measurements of temperature from the respective thermocouples were recorded every minute over the measurement period.
The average steady state temperatures of the area weighted values for the warm side (room), � and cold side � .
Knowing the area of the test specimen, � , the area of the surround panel, � , one can calculate the net test specimen heat loss, � (W) according to the following relation:
� = �ℎ � + � � + �ℎ � − � [�]
Where � is the heat flow of the surround panel, and is related to the area and conductance of the surround panel, � , and the temperature difference across the panel, for which:
� − � � Δ� = [�]
Where � is the area of the surround panel6 [m2], � the conductance [�/ � �)] and Δ�, the temperature difference [°C] across the panel.
The interior film heat transfer coefficient is the following:
ℎ�= � �⁄ ��− � [�/ � � ]
6
Asp = (12-ft. x 12-ft. x 0.093m 2
/ft2) - As (exterior of test specimen)
Lower Cooling Unit
Unit
Upper Cooling Supply
Return Chamber Baffle Test Specimen Polystyrene Frame (2.44m X 2.44m) Convective Heaters
Cold Chamber Hot
Air Flow
Calorimeter Box 3658 mm x 3658 mm
TASK 3—THERMAL OPTIMIZATION IN CURTAIN WALL DESIGN
REPORT A1-002844.04 4
Where � is the area of the test specimen (m2), �� and � , respectively, the average steady state warm side (interior) and weighted room side temperatures (°C) of the test specimen.
Whereas the exterior film heat transfer coefficient is:
ℎ�� = � �⁄ � − ��� [�/ � � ]
Where � and ���, are, respectively, the average steady state weighted weather side (exterior) and cold side temperatures (°C) of the test specimen.
The test specimen conductance, Cs, is given as:
� = � �⁄ � − � [�/ � � ]
From which the thermal transmittance the U-value, of the test specimen can be determined based on this relationship:
� = [⁄ ⁄� + ⁄ℎ� + ⁄ℎ�� ] [�/ � � ]
3.2.3 Description of Test Specimen
3.2.3.1 – Detailed specimen configuration
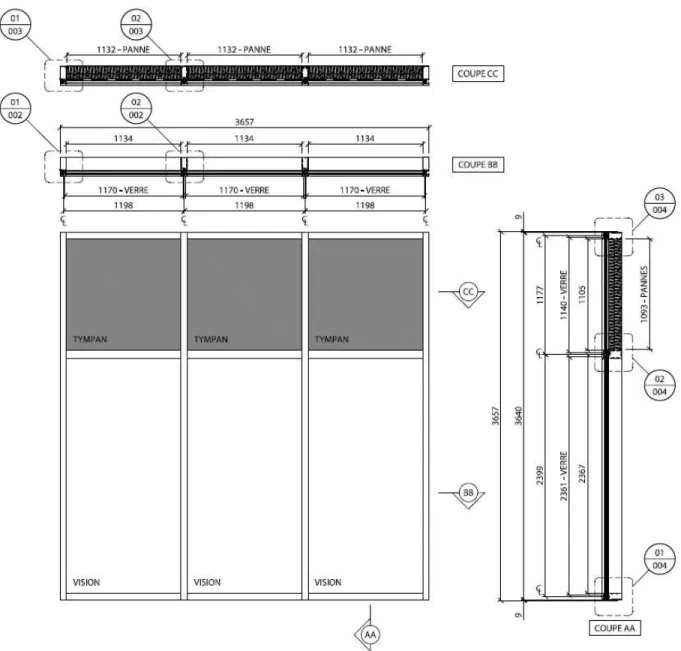
Detailed elevation and sectional drawings are provided in Figure 2 to Figure 4 7. In Figure 2 is shown an elevation, and horizontal and vertical sectional drawings of the curtain wall test specimen.
As can be seen in this figure, the curtain wall assembly consisted of three equal size opaque panels, each conventionally insulated and superimposed over three vision panels of the same width. The overall test specimen area, � , was 13.37 m2. The glazed area, � , was ca. 8.29 m2, the opaque panel area, � , ca. 3.88 m2, and the frame area, � , ca. 1.37 m2. As such, the proportion of vision glass to the overall wall area (� ⁄ ) was ca. 62 %; the frame to wall area, (�� ⁄ ) ca. 10%, and; the vision to opaque panel � ratio (� ⁄ ) was estimated to be ca. 2.14. The perimeter length of glazing was 20.97 m and that of the � opaque panels, ca. 13.64 m.
The vision panel was comprised of a double-glazed insulated glass unit (IGU), a metal spacer, the IGU cavity being filled with argon gas, and surface 2 of the IGU had a low-e coating (Guardian AG5;
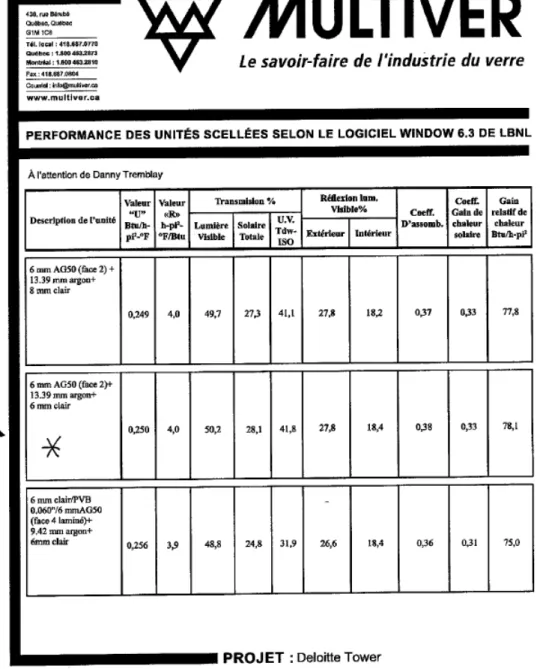
SunGuard high performance low-e coated glass; emissivity = 0.057). The light transmission and thermal performance properties of the IGU are given in Table 1; this information was provided by the curtain wall manufacturer, a copy of which is provided in the Appendix, together with information on the performance attributes of the low-e glass.
7
REPORT A1-002844.04 5
Figure 2 – Elevation and sectional drawings of curtain wall test specimen
Table 1 – Thermal and light transmission performance properties of double-glazed IGU
Insulated Glass Unit
Description U-value R-value
Transmission (%) Reflected visible light (%)
Relative heat gain
Btu/hft2°F hft2°F/Btu Visible
light
Total
Solar UV Exterior Interior
Shading
coefficient SHGC Btu/h-ft
2
6 mm AG 50 (surface 2) + 13.39 spacer; argon gas + 6 mm clear glass
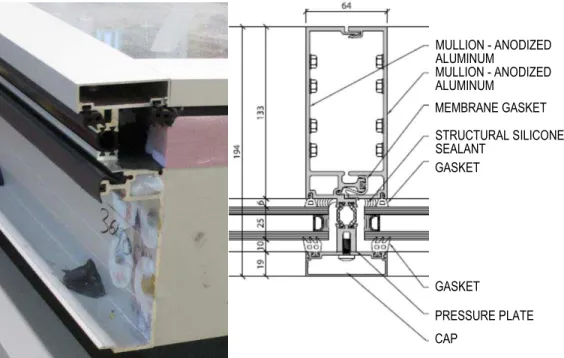
TASK 3—THERMAL OPTIMIZATION IN CURTAIN WALL DESIGN REPORT A1-002844.04 6 MULLION - ANODIZED ALUMINUM MULLION - ANODIZED ALUMINUM MEMBRANE GASKET STRUCTURAL SILICONE SEALANT GASKET GASKET PRESSURE PLATE CAP
Horizontal sectional drawings of the anodized aluminum curtain wall mullion and corresponding photos are given in Figure 3 and Figure 4; in Figure 3 is shown the sectional drawing across the vision panel whereas in Figure 4, the same for the opaque panel. The different curtain wall components are given in the respective sectional views; a polyimide compound was used as thermal break. The opaque panels are insulated with mineral wool to the depth of the mullion.
Figure 3 – Sectional drawing of curtain wall mullion (Section No. 002/02 of Fig 1); Photo showing end portion of horizontal section.
Figure 4 – Sectional drawing of curtain wall mullion at opaque panel (Section No. 002/02 of Fig 1)
STEEL BACK PAN INSULAITON – ROXUL CURTAIN ROCK
STRUCTURAL SILICONE SEALANT
REPORT A1-002844.04 7
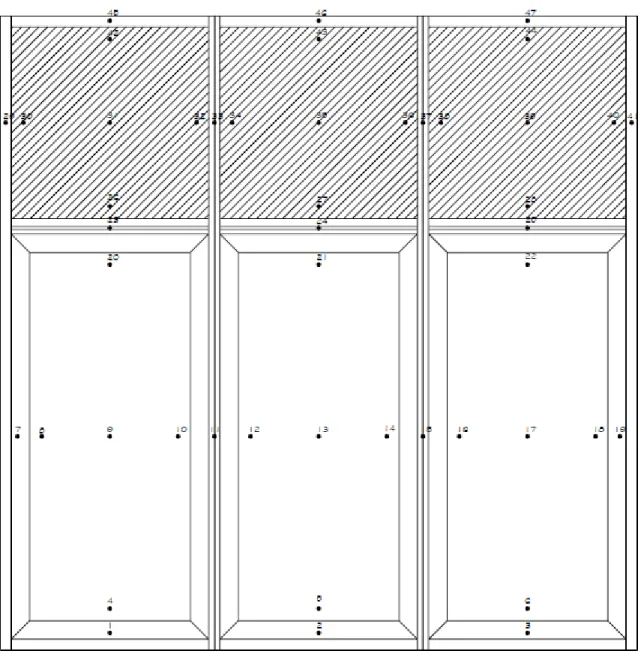
3.2.3.2 - Instrumentation
Two sets of 47 thermocouples were installed, respectively on the interior and exterior faces of the test specimen. The location of the sensors on the exterior of the test specimens are shown in Figure 5 and on the interior of the specimen in Figure 6. The thermocouples were capable of measuring temperature to ± 0.1 °C.
TASK 3—THERMAL OPTIMIZATION IN CURTAIN WALL DESIGN
REPORT A1-002844.04 8
Figure 6 – Location of thermocouples (1-47) on “interior” of curtain wall assembly
4. Results
4.1 Results derived from testing
The results derived from testing the curtain wall assembly in the guarded hot box test facility to determine the U-value of the assembly are given in Figure 7 and Figure 8, and in Table 2. The results of
thermocouples (TC) measurements (1-47) for the “exterior” of the curtain wall assembly are provided in Figure 7 and in Figure 8 are measurements obtained from TCs for the “interior” of the curtain wall assembly; for either side, the measurements reported are the average steady state temperatures at the TC locations for the respective sides of the curtain wall.
REPORT A1-002844.04 9
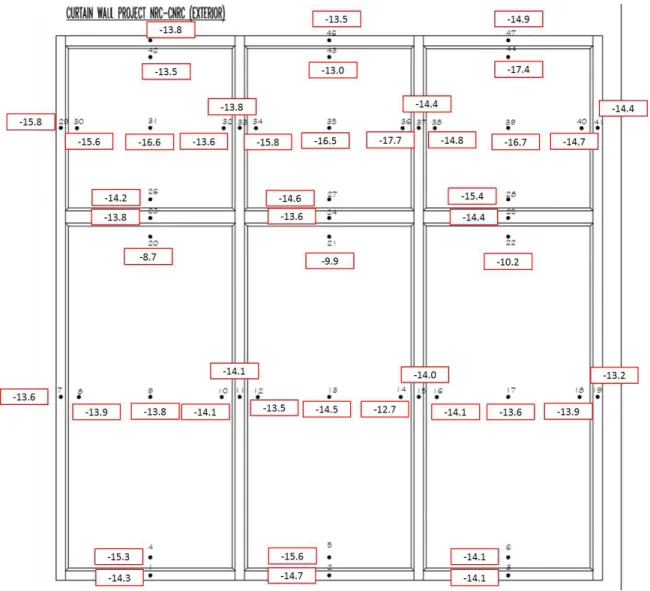
Figure 7 – Results of thermocouples measurements (1-47) for “exterior” of curtain wall assembly and showing average steady state temperatures are given locations
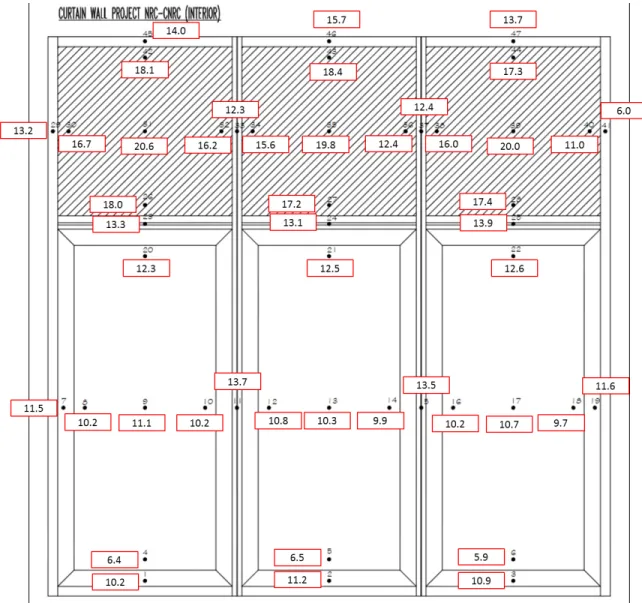
Results from the “exterior” side of the CW are provided in Figure 7. Portions of the CW exposed to a cold side temperature (-18 °C) would normally be expected, once steady state conditions had been attained, to all somewhat coincide to that of the average cold side temperature for the respective components (i.e., vision glass; opaque panel; frame). A review of the average steady state values for temperatures of the different locations on the wall suggests that there are nonetheless some discrepancies amongst the values reported in Figure 7. For example, the differences in temperature between TC 42 (-13.5 °C) and TC 44 (-17.4 °C) was ~ 3.9 °C; this is unexpected. Another perhaps not as significant result is the temperature difference between TC 29 (-15.8 °C) and TC 41 (-14.4 °C) which is ~ 1.4 °C. A review of results from the “interior” side of the CW, as provided in Figure 6, provide at least a single discrepancy in the reported average steady state values for temperatures; specifically, for TC 41, (-6.0 °C). This value is lower that might be expected. The remaining values for surface temperatures appear to be reasonably consistent with what might be expected.
TASK 3—THERMAL OPTIMIZATION IN CURTAIN WALL DESIGN
REPORT A1-002844.04 10
Figure 8 – Results of thermocouples measurements (1-47) for “interior” of curtain wall assembly and showing average steady state temperatures are given locations
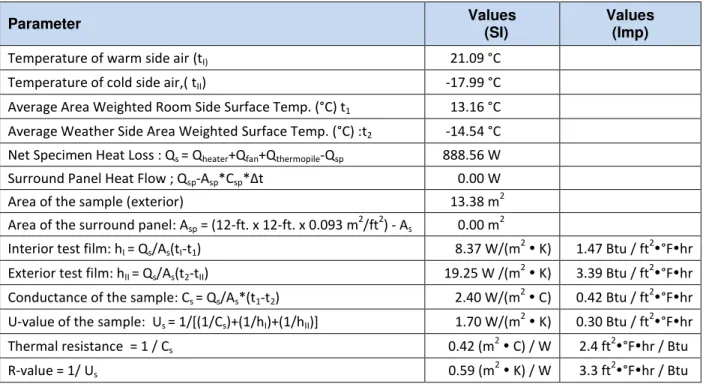
The information provide in Table 2 includes all basic information required to determine the area weighted U-value, or thermal transmittance of the curtain wall assembly in W/(m2•K) as well as Btu/(hr•ft2•°F ). As well, the value for thermal resistance [(m2C)/W] and the R-value [(m2K)/W] are also provided, both in SI and B.I. units.
The thermal transmittance (U-value) of the double-glazed thermally-broken curtain wall panel was 1.7 W/(m2•K), the thermal resistance 0.42 (m2C)/W, and the R-value 0.59 (m2K)/W.
REPORT A1-002844.04 11
Table 2 – Test Results & Calculated U-value for curtain wall assembly
Parameter Values
(SI)
Values (Imp)
Temperature of warm side air (tI) 21.09 °C
Temperature of cold side air,( tII) -17.99 °C
Average Area Weighted Room Side Surface Temp. (°C) t1 13.16 °C
Average Weather Side Area Weighted Surface Temp. (°C) :t2 -14.54 °C
Net Specimen Heat Loss : Qs = Qheater+Qfan+Qthermopile-Qsp 888.56 W
Surround Panel Heat Flow ; Qsp-Asp*Csp*Δt 0.00 W
Area of the sample (exterior) 13.38 m2 Area of the surround panel: Asp = (12-ft. x 12-ft. x 0.093 m
2
/ft2) - As 0.00 m 2
Interior test film: hI = Qs/As(tI-t1) 8.37 W/(m 2
K) 1.47 Btu / ft2°Fhr Exterior test film: hII = Qs/As(t2-tII) 19.25 W /(m
2 K)
3.39 Btu / ft2°Fhr Conductance of the sample: Cs = Qs/As*(t1-t2) 2.40 W/(m
2 C)
0.42 Btu / ft2°Fhr U-value of the sample: Us = 1/[(1/Cs)+(1/hI)+(1/hII)] 1.70 W/(m2 K) 0.30 Btu / ft2°Fhr
Thermal resistance = 1 / Cs 0.42 (m 2 C) / W 2.4 ft2°Fhr / Btu R-value = 1/ Us 0.59 (m 2 K) / W 3.3 ft2°Fhr / Btu
5. Summary
The full-scale testing to determine the thermal transmittance of a thermally broken, double-glazed, commercially available, curtain wall system was completed in a guarded hot box test facility using standard industry methods for assessing thermal performance of curtain wall assemblies.
The curtain wall assembly consisted of three equal size opaque panels, each conventionally insulated and superimposed over three vision panels of the width; the double glazed vison panels were argon filled and low-e coated (surface 2). The proportion of vision glass to the overall wall area was ca. 62 % and that of the frame to the wall area, ca. 10%. The vison to opaque panel ratio was estimated to be 2.14.
The test results indicate that this double-glazed, thermally-broken curtain wall system had an effective thermal transmittance (U-value) of 1.7 W/(m2•K), thermal resistance of 0.42 (m2C)/W, and
TASK 3—THERMAL OPTIMIZATION IN CURTAIN WALL DESIGN
REPORT A1-002844.04 12
A
PPENDIX
Figure 9 – Performance of IGU: information supplied curtain wall manufacturer; glazing manufacturer: “Multiver”
REPORT A1-002844.04 13
TASK 3—THERMAL OPTIMIZATION IN CURTAIN WALL DESIGN
REPORT A1-002844.04 14
Table 3 – Average temperature measurements for respective interior & exterior locations (1-47) of curtain wall assembly
Channel # Channel # 1 10.2 °C 50.37 °F 1 -14.3 °C 6.30 °F 2 11.2 °C 52.14 °F 2 -14.7 °C 5.54 °F 3 10.9 °C 51.64 °F 3 -14.1 °C 6.67 °F 4 6.4 °C 43.50 °F 4 -15.3 °C 4.48 °F 5 6.5 °C 43.67 °F 5 -15.6 °C 4.00 °F 6 5.9 °C 42.60 °F 6 -14.1 °C 6.65 °F 7 11.5 °C 52.67 °F 7 -13.6 °C 7.51 °F 8 10.2 °C 50.30 °F 8 -13.9 °C 7.04 °F 9 11.1 °C 51.96 °F 9 -13.8 °C 7.08 °F 10 10.2 °C 50.43 °F 10 -14.1 °C 6.55 °F 11 13.7 °C 56.62 °F 11 -14.1 °C 6.67 °F 12 10.8 °C 51.48 °F 12 -13.5 °C 7.61 °F 13 10.3 °C 50.59 °F 13 -14.5 °C 5.90 °F 14 9.9 °C 49.88 °F 14 -12.7 °C 9.10 °F 15 13.5 °C 56.38 °F 15 -14.0 °C 6.86 °F 16 10.2 °C 50.29 °F 16 -14.1 °C 6.62 °F 17 10.7 °C 51.21 °F 17 -13.6 °C 7.48 °F 18 9.7 °C 49.40 °F 18 -13.9 °C 7.02 °F 19 11.6 °C 52.91 °F 19 -13.2 °C 8.17 °F 20 12.3 °C 54.15 °F 20 -8.7 °C 16.36 °F 21 12.5 °C 54.45 °F 21 -9.9 °C 14.26 °F 22 12.6 °C 54.66 °F 22 -10.2 °C 13.69 °F 23 13.3 °C 55.94 °F 23 -13.8 °C 7.12 °F 24 13.1 °C 55.63 °F 24 -13.6 °C 7.52 °F 25 13.9 °C 57.01 °F 25 -14.4 °C 6.06 °F 26 18.0 °C 64.38 °F 26 -14.2 °C 6.53 °F 27 17.2 °C 63.04 °F 27 -14.6 °C 5.77 °F 28 17.4 °C 63.36 °F 28 -15.4 °C 4.26 °F 29 13.2 °C 55.70 °F 29 -15.8 °C 3.54 °F 30 16.7 °C 62.12 °F 30 -15.6 °C 4.00 °F 31 20.6 °C 69.02 °F 31 -16.6 °C 2.04 °F 32 16.2 °C 61.21 °F 32 -13.6 °C 7.45 °F 33 12.3 °C 54.10 °F 33 -13.8 °C 7.09 °F 34 15.6 °C 60.11 °F 34 -15.8 °C 3.56 °F 35 19.8 °C 67.60 °F 35 -16.5 °C 2.30 °F 36 12.4 °C 54.28 °F 36 -17.7 °C 0.12 °F 37 12.4 °C 54.28 °F 37 -14.4 °C 6.07 °F 38 16.0 °C 60.73 °F 38 -14.8 °C 5.35 °F 39 20.0 °C 67.96 °F 39 -16.7 °C 1.92 °F 40 11.0 °C 51.87 °F 40 -14.7 °C 5.52 °F 41 6.0 °C 42.73 °F 41 -14.4 °C 6.04 °F 42 18.1 °C 64.67 °F 42 -13.5 °C 7.78 °F 43 18.4 °C 65.18 °F 43 -13.0 °C 8.56 °F 44 17.3 °C 63.23 °F 44 -17.4 °C 0.75 °F 45 14.0 °C 57.24 °F 45 -13.8 °C 7.25 °F 46 15.7 °C 60.29 °F 46 -13.5 °C 7.73 °F 47 13.7 °C 56.69 °F 47 -14.9 °C 5.26 °F
Average Temperature Interior Average Temperature Exterior
REPORT A1-002844.04 15
Table 4 – Assigned contributory area (mm2 & m2) for respective interior & exterior thermocouple locations (1-47) of curtain wall assembly
Channel # Area mm² Area m² Channel # Area mm² Area m²
1 205098 0.21 1 106242 0.11 2 205098 0.21 2 106242 0.11 3 205098 0.21 3 106242 0.11 4 67977 0.07 4 68231 0.07 5 67977 0.07 5 68231 0.07 6 67977 0.07 6 68231 0.07 7 451878 0.45 7 189546 0.19 8 143605 0.14 8 144177 0.14 9 2213386 2.21 9 2231277 2.23 10 143605 0.14 10 144177 0.14 11 717240 0.72 11 185289 0.19 12 143605 0.14 12 144177 0.14 13 2213386 2.21 13 2231277 2.23 14 143605 0.14 14 144177 0.14 15 717240 0.72 15 185289 0.19 16 143605 0.14 16 144177 0.14 17 2213386 2.21 17 2231277 2.23 18 143605 0.14 18 144177 0.14 19 451878 0.45 19 189546 0.19 20 67977 0.07 20 68231 0.07 21 67977 0.07 21 68231 0.07 22 67977 0.07 22 68231 0.07 23 226167 0.23 23 154908 0.15 24 226167 0.23 24 154908 0.15 25 226167 0.23 25 154908 0.15 26 68040 0.07 26 68231 0.07 27 68040 0.07 27 68231 0.07 28 68040 0.07 28 68231 0.07 29 74496 0.07 29 107635 0.11 30 65818 0.07 30 65564 0.07 31 980784 0.98 31 979659 0.98 32 65818 0.07 32 65564 0.07 33 74496 0.07 33 157035 0.16 34 65818 0.07 34 65564 0.07 35 980784 0.98 35 979659 0.98 36 65818 0.07 36 65564 0.07 37 74496 0.07 37 157035 0.16 38 65818 0.07 38 65564 0.07 39 980784 0.98 39 979659 0.98 40 65818 0.07 40 65564 0.07 41 74496 0.07 41 107635 0.11 42 68040 0.07 42 68231 0.07 43 68040 0.07 43 68231 0.07 44 68040 0.07 44 68231 0.07 45 73557 0.07 45 106242 0.11 46 73557 0.07 46 106242 0.11 47 73557 0.07 47 106242 0.11 Sum 15805835 15.81 14091205 14.09 Interior Exterior
TASK 3—THERMAL OPTIMIZATION IN CURTAIN WALL DESIGN
REPORT A1-002844.04 16
Table 5 –Surface temperatures and corresponding assigned areas for respective interior & exterior thermocouple locations (1-47) of curtain wall assembly
Thermocouple Channel #
Room Side Weather Side Room Side Weather Side
1 10.21 -14.28 0.21 0.11 2 11.19 -14.70 0.21 0.11 3 10.91 -14.07 0.21 0.11 4 6.39 -15.29 0.07 0.07 5 6.48 -15.56 0.07 0.07 6 5.89 -14.08 0.07 0.07 7 11.49 -13.60 0.45 0.19 8 10.17 -13.86 0.14 0.14 9 11.09 -13.85 2.21 2.23 10 10.24 -14.14 0.14 0.14 11 13.68 -14.07 0.72 0.19 12 10.82 -13.55 0.14 0.14 13 10.33 -14.50 2.21 2.23 14 9.93 -12.72 0.14 0.14 15 13.55 -13.96 0.72 0.19 16 10.16 -14.10 0.14 0.14 17 10.67 -13.62 2.21 2.23 18 9.66 -13.88 0.14 0.14 19 11.61 -13.24 0.45 0.19 20 12.31 -8.69 0.07 0.07 21 12.47 -9.85 0.07 0.07 22 12.59 -10.17 0.07 0.07 23 13.30 -13.82 0.23 0.15 24 13.13 -13.60 0.23 0.15 25 13.89 -14.41 0.23 0.15 26 17.99 -14.15 0.07 0.07 27 17.24 -14.57 0.07 0.07 28 17.42 -15.41 0.07 0.07 29 13.17 -15.81 0.07 0.11 30 16.73 -15.55 0.07 0.07 31 20.57 -16.64 0.98 0.98 32 16.23 -13.64 0.07 0.07 33 12.28 -13.84 0.07 0.16 34 15.62 -15.80 0.07 0.07 35 19.78 -16.50 0.98 0.98 36 12.38 -17.71 0.07 0.07 37 12.38 -14.41 0.07 0.16 38 15.96 -14.81 0.07 0.07 39 19.98 -16.71 0.98 0.98 40 11.04 -14.71 0.07 0.07 41 5.96 -14.42 0.07 0.11 42 18.15 -13.46 0.07 0.07 43 18.43 -13.02 0.07 0.07 44 17.35 -17.36 0.07 0.07 45 14.02 -13.75 0.07 0.11 46 15.72 -13.49 0.07 0.11 47 13.72 -14.86 0.07 0.11 Total Area: 15.81 14.09 Average Room Side Area Weighted Surface Temperature (°C) : 13.16 Average Weather Side Area Weighted Surface Temperature (°C) : -14.54
Surface Temperatures (°C)
Individual Average Assigned Areas per Thermocouple Location (m²) SURFACE TEMPERATURE MEASUREMENTS AND AREA INFORMATION