OF SLOW ELECTRONS
by
FRANKLIN SEANEY COOPER B. S., University of Illinois
1931
Submitted in Partial Fulfillment of the
%ASS.
4110,
Requirements for the Degree of
DOCTOR OF PHILOSOPHY
from the
Massachusetts Institute of Technology
1936
Signature Redacted
Signature of Author .. .- ... ... ...-.. Department of Physics, Signature of Professor May 14, 1936Sig nature Redacted
in Charge of Research -..4.- a A
Signature of Chairman of Department
Committee on Graduate Students ... ,r ...
TABLE OF CONTENTS I Introduction II Historical Survey III Apparatus IV Procedure Physical Biological V Experimental Data VI Discussion of Data
Errors and Possible Misinterpretations Basis for Interpretation of Data
Interpretation of Data
VII Summary
VIII Acknowledgements
IX Appendix; Biographical Note
I. INTRODUCTION
The investigation reported in this thesis was under-taken as the first part of a larger research program. This program, in its entirety, has for its object the quantitative determination of the biologic effects of electrons of a very wide range of energies on a variety of unicellular organisms. Furthermore, it envisages the correlation of existing x-ray dosage data and the estab-lishment of a sound theoretical basis for the calculation of x-ray dosages under specified conditions of wave-length distribution, filtering, and beam size. Finally, it is hoped that the results will assist in clarifying the mechanism of induced genetic mutations.
The experimental data required constitute the so-called
"survival curves" for a series of electron voltages, and the derived curves of lethal efficiency as a function of electron energy. The genetical side of the problem will require the same type of measurements but the use of
selected types of mutation instead of death as the biolog-ic indbiolog-icator. Calculation of x-ray dosages will involve the computation of the distributions in number and energy of recoil and photo-electrons resulting from the absorption of a given x-ray beam. The total biologic effect can then
-2-curves of lethal efficiency.
The essential point of superiority of this method over that involving the direct use of x-rays is that this method gives without intermediate computation the effect on a
single cell of electrons of accurately known energy. The x-ray method gives only the integrated effect of electrons whose energy ranges from a known maximum to zero.
Consideration of the entire problem indicated that the logical starting point was the investigation of the low voltage range. This follows from the facts that (1) the space rate of loss of energy by an electron reaches a high maximum at 100-200 volts and drops rapidly to an almost constant value for higher voltages, and also that
(2) the electron energy needed to just traverse one ordin-ary cell (ca. 15/4diameter) is ca. 15 e-KV. Hence, an
electron of less than this energy will be completely absorb-ed in a single cell, generating many times the number of ions which are formed in cells completely traversed by the electron. The ionization per cell resulting from the
passage of electrons of higher energy will change very slowly with voltage. One could expect then that the volt-age range below ca. 15 e-KV would be particularly inter-esting.
This thesis problem was undertaken (1) to develop the apparatus and physical technique needed for low voltage raying in high vacuum and (2) to secure sufficient data to
indicate the e ffects obtainable in this region and the probable value of a continuation of the investigation. It was recognized from the start that such a problem required full biological cooperation. This has been ably
II-1
II. HISTORICAL SURVEY
This thesis consists of exploratory work into
essentially virgin field. For ithis reason, an histor-torical review cannot be extensive if it is to remain pertinent. To be sure, many papers have been written on the biological effects of electrons but much of the early work is not only merely descriptive but also open to doubts as to its validityl. Of the remaining liter-ature, much is descriptive of the effects of beta rays
from various radioactive sources. A few descriptive papers have also appeared on the effects of high volt-age cathode rays. There is no basis for significant
correlation of such work with that here reported since the electron energies are so widely different, since different organisms are used, and since quantitative results are but rarely reported. A single paper by Haskins and Moore2 gives quantitative exploratory data
on the effects of high voltage cathode rays on Penicill-ium sp. as compared with the effects of hard and/oft x-rays. Even these results are given without sufficient data as to voltage and current density of the electrons arriving at the spores to permit correlation with the - present results even if the voltages were comparable.
1. Zirkle, R. E. in Duggar's "Biological Effects of Radiation", New York, 1936, Vol. I, p. 564. These remarkd apply equally
well to alpha and beta ray investigations. 2. Haskins, C. P. and 0. N. Moore--Radiology 23, 710 (1934)
11-2
A preliminary report by Wells3 of the effects of
extremely low energy electrons (19.5 - 30 volts) on
Staphylococcus albus gives killing at dosages which are ca. 10 times those here employed. These effects would seem to be due to a very different mechanism than any which may reasonably be postulated here.
There is a small body of quantitative data on the effects of x-rays available in the literature which will deserve careful consideration as soon as the present method of attack is extended to yield results
at higher voltages. However quantitative correlation will involve extended calculations.
In conclusion, it may be well to emphasize that the present work is, to the best of the author's know-ledge, the first quantitative attack on the biologic effects of electrons whose energy range permits their use as an "felectron-probe", i.e., a controlled tool
for the study of the variation of electron effects along the cell diameter.
III-)-III. APPARATUS
Some of the general considerations which determined the design of the apparatus in its present form were the following:
1) The experiment was primarily an exploratory one; hence, a non-specialized, highly flexible design
was essential. For example, the meager data
available on the order of electron density requir-ed as inferrrequir-ed from x-ray and low voltage cathode ray data differed by a factor of more than .a million.
2) Furthermore, the exploratory nature of the problem eliminated the necessity for many of the experi-mental refinements so essential to precision work.
3) The use of low voltage cathode rays made operation under high vacuum imperative. At the same time,
flexibility requirements precluded the use of a sealed glass system. The relative merits of a glass system with greased joints and of a metal system with soft wax seals were strongly in favor of the latter.
4) The inconvenience of introducing the material to
be rayed into an evacuated system made desirable
111-2
of slides at one time and their subsequent raying as desired. This was accomplished by the use of a cylindrical slide holder which could be rotated through a vacuum seal.
5) The difficulty of securing an electron beam of uniform density over an appreciable area led to
the use of a short, narrow slit parallel to the
axis of the cylindrical slide holder, and to the use of a slow, constant speed drive to move the
slide past the slit during raying. This proce-dure gave anaCrea of approximately 8mm2 over which the dose was substantially constant.
6) Potential difficulties with heat from the fila-ment of the electron gun and from soft x-rays
generated in the vicinity of the tube led to the use of separate chambers for tube and raying
cylinder, connected only by the final slit for the electron beam. This required, of course, separate pumping for the two chambers.
7) The raying arrangement required some means of blocking or diverting the electron beam to
pre-vent sweeping it across slides other than the one to be rayed. This was accomplished by using a magnetic field to bend the beam through ninety
II1-3
Ti.1is arrangement has the further advantage that it gives added protection from heat and soft x-rays., An alternative method of blocking the beam was the application of a high negative
voltage to the focusing grid of the electron gun. 8) The type of mount required for holding the spores
during irradiation required some consideration. It had to be a reasonably good conductor to pre-vent the accumulation of charge and consequent
deflection of the electron beam. The mount need-ed'to be removable for printing, cleaning, and reloading. It also had to have a polished surface
to permit the achievement of a single spore layer (no clusters of spores). Finally, x-ray genera-tion dictated a material of low atomic weight. The mounts chosen were small slides of aluminum, well polished.
9) The characteristics required of the high voltage supply were obviously that it deliver direct current of quite constant potential. The small currents required for the electron beam did not necessitate the use of high capacity filtering
condensers. Flexibility and cost both dictated the use of a storage battery floated at high po-tential for the filament supply.
111-4
10) The extreme uncertainty as to the currents
required for administering a lethal dose to the spores required detecting equipment suitable for all current values intermediate between a few milliamperes and micro-microamperes.
11) The desirability of eventually carrying the volt-age range down to about ten volts required an arrangement of raying box and pumping rack which would permit placing a large Helmholtz coil
around the raying box with a minimum of recon-struction.
A schematic diagram of the apparatus is given in
Fig.III-a and general and detailed photographs in Figs. III-b and through III-h. In the schematic diagram, the raying box, A, communicates with the tube box, B, through the windows, C. A slit system completely closes the
windows except for the vertical slit, D, which is 6.31 by
0.351 mm. and approximates optical quality. The side of thepronze slit jaws facing the tube box are shielded by a grounded copper sheet, E, except for an opening approx-imately 12 by 5mm. On the rtaying box side, (Fig. III-d), the slit is covered by a copper collecting screen, F, except for an opening approximately 10 by 2 mm. These three elements are mutually insulated by thin sheets of mica so arranged as not to accumulate charge from the
111-5
electron beam. The slit ;s grounded through an external lead and the collector plate is maintained at +45 volts above ground, also through an external lead. The entire slit system including mounting frames is about 1/8 inch thick and clears the slide surfaces by less than 1/8 inch.
The turn-table carries the cylindrical slide holder, G, on three amber pegs. It is driven from below by a
4 watt Telechron motor and gear train through a vacuum seal. The gear train (Fig. III-f) provides three speeds, 1, 1/14, 1/196 r.p.m. One of the large gears is attached directly to the turn-table shaft and has its rim engraved
to indicate accurately the position of the slide holder with respect to the slit. The motor assembly is located
directly under the raying box and at a distance of about 34 in. to minimize magnetic fields. The raying box and motor shaft compartment are pumped separately.
The slide holder, G, consists of a short brass cylin-der with space for twenty-eight slides each 2.5 x 0.5 cm. These are .held in place by spring clips around the bottom
of the holder. A window permits introducing a Faraday
cage, H, into a normal slide position. As is shown in Fig. III-e, this collector has, in addition to a slot in the outer shell, a series of three drill holes so arranged that direct measurements on the intensity of
M 111-6 1
the beam can be taken a:t top, middle, and bottom of the useful portion of the slit. The inner collector is insulated by mica strips, and is connected to the vacuum tube electrometer by a shielded cable. A fine
copper-constantan thermocouple is also mounted on one of the slides.
Space was left in the raying box for a small, low voltage tube and provisions were made for bringing out leads through metal-to-glass grinds in the lid of the raying box (See Figs. III-g). Several such tubes were actually tried but filament heat proved a serious diffi-culty.
The tube box (Fig. III-h) is pinned and clamped securely to the raying box, a vacuum tight joint being secured by the use of soft wax. It contains, besides
the tube assembly, two re-entrant liquid air traps, J,
for rapid pumping of condensable vapors. The larger one is so placed that if 1800 magnetic focusing of the beam is ever desired, the tube elements can be mounted on a glass grind replacing the trap. Both traps are covered with copper foil and the glass window, K, closing the
front of the tube box is shielded by a copper s creen to prevent electrostatic fields due to accumulated charges on the glass.
111-7
Electric D. C. Kenotron Testing Set rated at 15,000 volts, 100 ma. This was provided with an induction regulator and peak voltmeter. The ripple voltage was
smoothed to less than 1% by a 25 K.V., 0.4 mf. capaci-tor. Fuses and a protective resistance of 600,000 ohms were used in the output. The storage battery supplying the filament and the filament and grid controls were floated at the high voltage.
The electron gun consists of a filament, L, focus-ing grid, M, and acceleratfocus-ing plate, N, arranged as shown in Fig. III-a. The filament consists of a short spiral of 7 mil tungsten wire coiled to a diameter of
50 mils. It is supported on a standard radio tube press which also carries the grid. The latter is a soft iron
cylinder 1 in. high and 3/4 in. in diameter, closed at both ends. A vertical slot about 1/16 in. wide allows
egress of the electrons from the filament immediately behind it. Facing this slot and separated from it by 3/16 of an inch is a similar slot in the plane copper accelerating plate. The focusing grid is maintained at any desired potential difference with respect to the filament by means of "B" batteries floated at the high potential. The accelerating plate is grounded to the
111-8
supported between horizontal mica sheets held in place
by insulated pillars screwed into the top plate of the
tube box. The electron gun is so located that the beam strikes the slit face normally after traversing a
quarter arc of radius 5.1 cm.
In use, this form of electron gun has been quite satisfactory except for leakage across the mica supports at the higher voltages. The focusing grid permits vary-ing the size of the spot where the electrons strike the slit face/rom almost circular (ca. 2 cm. diameter) to a narrow band approximating the dimensions of the slit in the accelerating plate. The homogeneity of the beam is adequate. (See Section V). In use, a large circular beam was used and the focusing grid was employed only
to shut off the beam for zero adjustment of the electro-meter. A grid bias of -270 v. is more than adequate to
stop the beam at 7 K.V. The iron cylinder constituting the focusing grid serves two purposes other than provid-ing grid control. It prevents the escape of electrons from the filament in any but the desired direction and
it provides magnetic shielding from the field of the
Helmholtz coils.
The vacuum system consisted of two diffusion pumps, one oil and one mercury, backed by a Hyvac. No gage was
111-9
used since the vacuum required to prevent gas flashes at 10-20 K.V. is far better than necessary to prevent scattering of the electron beam. A leak t'ester was
regularly employed as a vacuum indicator before the high
voltage was applied.
The electrical circuits, other than that of the elec-trometer, have already been indicated. The electrometer circuit is essentially that due to Barthl. The adapta-tion of this circuit to the 1A6 tube was carried out by H. Tatel and 0. Morningstar. The complete circuit dia-gram and table of constants is given in Fig. III-i. In use, a balance was obtained to eliminate emission fluctu-ation by varying the. filament current. The galvanometer deflection was then reduced to zero with the input grid grounded to "instrument ground" by adjusting Rl. Then any steady input current to the grid could be measured
by adjusting the null voltage potentiometer to reduce
again the galvanometer reading to zero. The quotient of null voltage divided by input grid resistance gave the current to be measured. Thepange of null voltages used was kept between 0.1 and 3.0 v. by using the appropriate input resistance. The maximum sensitivity of this elec-trometer was about 10-14 amp./ mm. The rate of drift after thermal equilibrium had been attained was neglig-ible under the conditions of use.
III-10
All the essential instruments were calibrated to
better than 1% except the high voltage voltmeter. The voltmeter resistance box, Rv, was calibrated against a new Leeds and Northrup box which had in turn been checked against precision standards. The milliameter was cali-bi'ated using standard resistors and a Leeds and Northrup
potentiometer. The input grid resistances were calibrat-ed .n the electrometer using the standard RC method and standard condensers. The high voltage voltmeter on the G. E. Testing Set was calibrated against a 300 v. Weston meter (calibrated) and voltage multipliers. The cali-bration may be in error by as much as 5% due to poor
regu-lation of the high voltage transformer and appreciable current drain required by the calibrating voltmeter. The Telechron motor was checked for operation at synchronous
speed under load conditions. Slit dimensions were meas-ured with a Hilger comparator.
To pump.
To pump.
A
EN
FIG.
I-a.
K
III-ll
Fig. III-c.--Raying and
tube boxes; filament
and grid controls; Helmholtz coils.
Fig. III-b.--General view of the apparatus.
-~ V
LVUI
N
L
IsmI
IN
4
i( VI
4' V111-12
'A,,
I
4*ARE
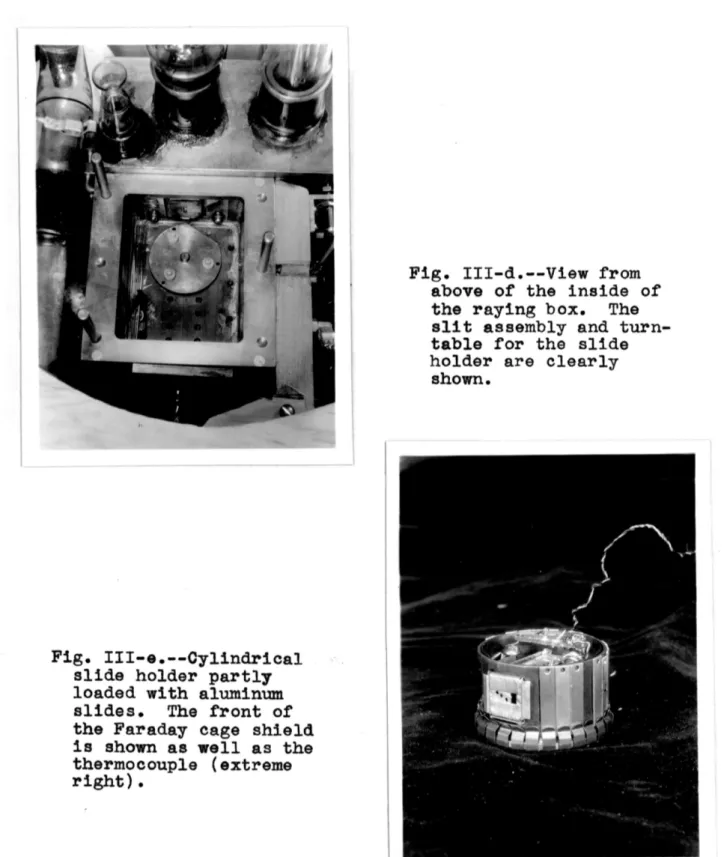
Fig. III-d.--View from
above of the inside of the raying box. The slit assembly and turn-table for the slide holder are clearly
shown.
Fig. III-e.--Cylindrical slide holder partly loaded with aluminum slides. The front of the Faraday cage shield is shown as well as the thermocouple (extreme right).
111-13
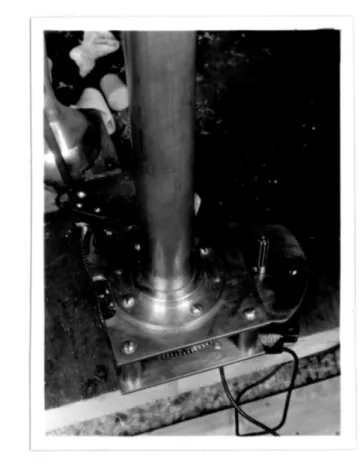
Fig. III-f.--Motor drive (right) and gear reduction box.
The divisions on the large gear (left) indicate the orientation of the slide holder. The pressure
ad-justment on the vacuum bearing is almost concealed by the vertical shaft housing.
111-14
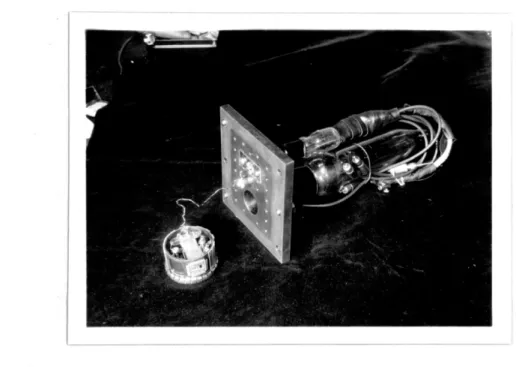
Fig. III-g.--Slide holder and top of raying box.
I,
II
A ~I
Fig. III-h.--Interior of tube box as seen through the window (copper mesh screen removed). The slit
connect-ing with the rayconnect-ing box appears at the right. On the left is shown the accelerating plate and tube support structure.
I
A 6
cage.
R
3E.G.
R
7E-r/A~
]I
1.G.
--VV\/V\r,-R2
R
R
VR\/
E
A
E
2
20 t 6000 7000 ohms 108, 109, 100 ohms ohms 1010, and 1011 ohms R5 R6 R7 R8 50 ohms 114 ohms 400 ohms 100 ohms 3 volts.12 volts. (storage battery) D.C. milliameter, 0-100 ma. D.C. voltmeter, 0-3 volts. Galvanometer. Sensitivity ca. Instrument ground. Earth ground 10-8 amp./Mm.
F
IG.
Irn -
i
To Faraday
Rl R2 R3 R4 El E2 A V G I.G. E.G. V1- 15R,5
IV. PROCEDURE
Physical
The steps in the raying procedure were as follows:
1) Prepared slides were fitted into the cylindrical slide holder and their positions noted. In
early runs only alternate positions were filled; but later, since the beam seemed well defined,
slides were loaded into all available positions. This permitted raying twenty-two slides per run. An additional slide for vacuum control was always loaded in a protected position inside the slide holder.
2) The slide holder and lid of the raying box were placed in position and the system evacuated to
a black vacuum as indicated by a high-frequency leak tester, and, immediately before the raying,
by application of 5-10 KV to the tube with
fila-ment cold. Evacuation required thirty to sixty minutes depending on whether the diffusion pumps
started hot or cold.
3) With the Faraday cage in position to receive the electron beam, voltage was applied to the tube and the filament was heated. The current in the Helmholtz coils was adjusted to center the beam
IV-2
on the slit, its position being indicated by the Willemite screen painted on the slit face.
4) The filament current was then turned off, and the zero reading taken with the electrometer.
5) The filament emission was adjusted to give the desired current through the slit to the Faraday cage.
6) The actual raying was then performed, the steps being to de-energize the Helmholtz coils, rotate the desired slide into position, engage the
Telechron motor, re-energize the coils while the slide was passing across the beam, then, with coils de-energized, to disengage the motor and rotate the Faraday cage into position again, and finally to re-energize the coils for a repeat measurement on the current through the slit and
for the zero reading. The raying proper
requir-ed about seventy seconds and the time between
current measurements was about two minutes.
7) During the switching operations of (6) the input grid of the electrometer was grounded. Also,
immediately before each of the four above measure-ments, the electrometer (grid grounded) was
checked for drift.
8) Each of the twenty-two slides was rayed in the same way, the voltage and dose being adjusted in
IV-3
each case to conform to a predetermined raying schedule.
9) The slide holder was removed from the vacuum and the slides were printed on to separate agar
blocks for germination.
Biological
The technique used was essentially the same as describ-ed by Haskins and Moorel.
The fungus, Penicillium sp. was cultured on Petri dish plates of potato-prune sucrose agar. Simpler media, e.g., Difco malt extract agar or Difco prune agar, did not
afford as luxuriant a growth. Spores were transferred to polished aluminum slides by means of gentle pressure on the surface of the culture. The slide was s tuck to a wooden printing block for this purpose. Excess spores were gently brushed away with a camels' hair brush until microscopic inspection revealed a favorable distribution of spores-with negligible clumping. The slides were then ready for raying.
After irradiation, the slide was attached to the wooden block and "printed" on thin blocks of the medium described above made up with 5% agar. The strips were arranged as
in fig. W-4.
IV-4
A hole in the aluminum slide was arranged to fit
on-to a peg set inon-to the wooden printing block. The hole impressed by this peg into the agar block on printing, served as a point of orientation in delimiting the spores in the rayed area that were to be counted. This was done
by means of two fixed parallel wires on.a frame which
could be orientated with a third fixed wire by means of the peg hole in the block. The slides were t-hen placed in a moist chamber until a stage of germination suitable for counting was reached (generally in 7-8 hours at room temperature).
Spore counts were made by making camera lucida draw-ings of spores in selected areas and therallying the germinated and non-germinated spores from the drawings.
IV-5
Fig. IV-a.--Biological apparatus. At the left is the device for isolating the desired portion of the agar print. The sample prints in the Petri dish
show clearly the rayed area and the section select-ed. The strips of paper towel beside the agar
V-1
V. EXPERIMENTAL DATA
The data desired fall into three fairly distinct classes:
1) Test data on the equipment, including electrical characteristics of the electron gun, which might conceivably affect the final result.
2) Survival curves, i.e., percent survival (correct-ed to 100% for the controls) as a function of electron dose in coulombs per sq. cm. for each of a series of voltages.
3) Incidental test data on the biological effect, if any, of certain factors in the ecxperiment, e.g., x-ray production, spreading of the electron beam, length of evacuation, et.c.
Of these classes, only the second required precision data.
The others are needed only to prevent serious error or misinterpretation.
The most important set of electrical tests on the tube were those concerning the homogeneity and constancy of the electron beam. The construction of the electron gun might conceivably have resulted in a "banded" beam since the filament was a fairly open spiral, and such focusing as existed was cylindrical and parallel to the axis of the filament spiral.
There was no visual evidence of such "banding" when the beam was directed onto the fluorescent screen covering the slit face; in no case was such an effect evident on the rayed spores.
Overall changes in beam intensity from top to bottom
of the useful portion of the slit indicated a variation from the mean of ca. 10 %. The measurements were made
by passing a constant beam across each of the three drill
holes in the front of the Faraday cage ( Fig. III-e) in turn. Table V-1 shows the currents flowing to the Fara-day cage through the top, middle, and bottom ports at each of several applied voltages.
TABLE V-1
Port Relative currents flowing to Faraday cage at
2 KV 3 KV 4 KV 5 KV 6 KV 7 KV
Top 0.19 0.60 0.20 0.21 0.24 0.60 0.23 0.22 Middle 0.21 0.66 0.21 0.20 0.23 0.66 0.21 0.22 Bottom 0.16 0.73 0.18 0.17 0.17 0.69 0.16 0.16
The entries on the right at 2 and 5 KV were measurements taken early in the series of rayings; other measurements were taken much later. The variation observed is not a serious one and does not, in fact,introduce a correspond-ing error into the survival curves since the choice of fields for counting germination was a random one across
V-3
No difference in the appearance of the germination was evident across this band.
Fluctuations in beam intensity with time were very slow indeed after the filament had attained thermal equi-librium (ca. 1-2 min.). However, apparent fluctuations with time were very troublesome during the early runs. The difficulty was found to be a fairly rapid change in intensity of the beam in a direction perpendicular to the
slit and to power line fluctuations affecting the strength of the Helmholtz coil field. Battery operation of the coil resolved the difficulty completely.
A potential difficulty which was examined
experiment-ally was possible spreading or diffusion of the beam after passing through the slit. The slit arrangement was such that moderate (50-100
%)
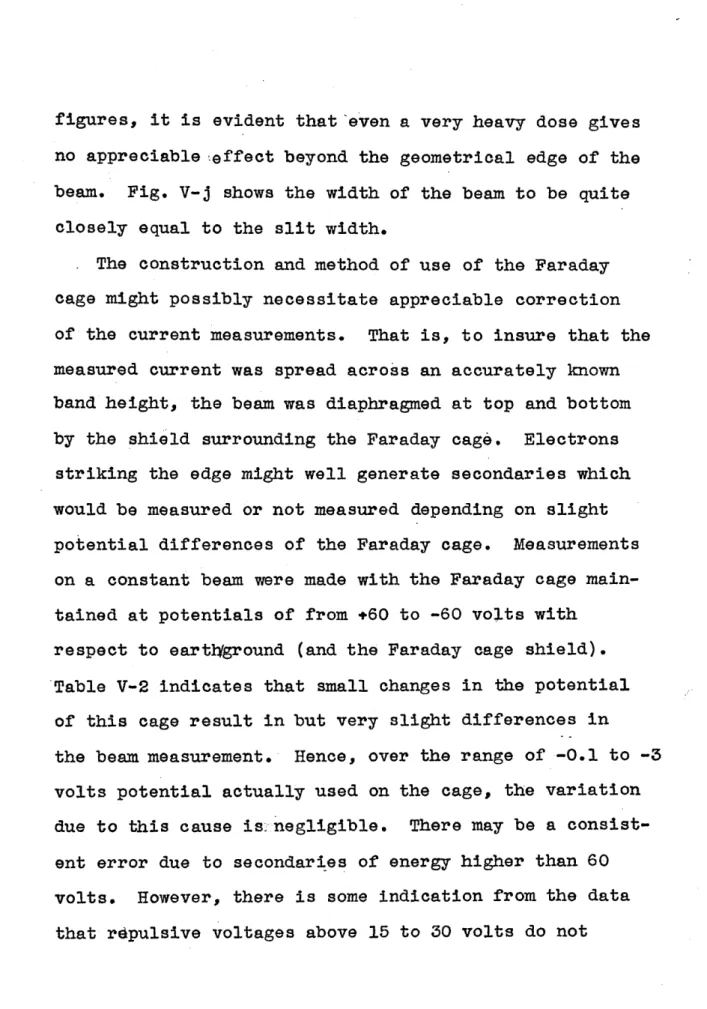
spreading would have introduced no appreciable error into the dosage measurements. However, wide angle spreading would have resulted in overlapping doses on adjacent slides. Hence, it was a relief to find that the beam had almost geometrically sharp edges andshowed but very slight spreading. The small extent to which the beam scatters beyond its geometrical edge is well shown in Figs. V-h, i. These photomicrographs show the boundary between the top of the rayed area and the unrayed portion of the slide. From the first of the two
V-4
figures, it is evident that 'even a very heavy dose gives no appreciable teffect beyond the geometrical edge of the beam. Fig. V-j shows the width of the beam to be quite
closely equal to the slit width.
The construction and method of use of the Faraday cage might possibly necessitate appreciable correction of the current measurements. That is, to insure that the measured current was spread across an accurately known band height, the beam was diaphragmed at top and bottom
by the shield surrounding the Faraday cage. Electrons striking the edge might well generate secondaries which would be measured or not measured depending on slight potential differences of the Faraday cage. Measurements
on a constant beam were made with the Faraday cage main-tained at potentials of from +60 to -60 volts with
respect to eartlyground (and the Faraday cage shield). Table V-2 indicates that small changes in the potential
of this cage result in but very slight differences in
the beam measurement. Hence, over the range of -0.1 to -3 volts potential actually used on the cage, the variation due to this cause is.negligible. There may be a consist-ent error due to secondaries of energy higher than 60 volts. However, there is some indication from the data that rdpulsive voltages above 15 to 30 volts do not
V-5
further decrease the measured beam; from which one would infer that the energy of the secondaries -lies below
30 volts or much above 60 volts.
TABLE V-2 Potential of Faraday cage +60.0 v. 37.5 15.0 10.5 ' 7.5 3.0 0.0 (Normal operation) -
3.0
-7.5
-10.5 -15.0 -37. 5 -60.0 Measured Beam at 1 KV. 0.540 x 10⁻⁹a. 0.550 0.520 0.525 0.520 0.505 0.500 0.490 0.475 0.463 0.460 0.460 Measured Beam at 4 KV. 0.535 x 10⁻⁹a. 0.522 0.517 0.519 0.518 0.508 0.500 0.495 0.486 0.483 0.480 00465 00468An experimental test was made of the generation of secondary electrons at the surface of the aluminum slide. An electron beam was directed onto a slide prepared in
the usual way. The electron current to the collector plate (F, in Fig. III-a) was measured with a potential of zero and of +45 volts applied to it for each of several electron energies. Also, the electron current flowing to the slide was measured with the slide maintained at zero and at +45 volts with respect to ground. Table V-3 gives
TABLE V-3
Measurement Significance Currents in Amp. x 10 at
1 KV 2 KV 3 KV 5 KV
1. Current to Collector Plate Reflected primaries
(C.P. at zero. Slide at zero) and fast secondaries 2. Current to Slide
(C.P. at zero. Slide at zero.) (See Text)
3. Current to Slide
(C.P. at zero. Slide at +45 v.) Electron beam 4. Current to Slide Electron beam
(C.P. at +45v.. Slide at zero.) minus secondaries
5. Difference: (3) - (4) Secondaries
6. Current to Collector Plate
(C.P. at + 45 v. Slide at zero)
7. Ratio of Secondaries to Primaries
Secondaries 0.0 0.67 1.02 0.0 0.0 -0.50 1.52 0.0 0.60 0.77 0.23 0.54 1.52 1.08 0.84 0.55 1.49 (1.14) (0.94) 0.71
V-6
the data obtained and explains its significance. The agreement of (4) and (5) gives a check on the self-con-sistency of the data. If an appreciable fraction of the incident beam were reflected, or served to eject fast secondary electrons, these should have been measured (Line (1) of Table V-3). If any were present, they totaled less than 1% of the incident beam.
There were, however, many slow secondary electrons ejected. The data are inadequate to permit an estimate of the electron energies except that a potential of 45 volts was apparently adequate to capture all of them. Also, the marked loss of electrons from the slide (Line 2 of Table V-3) for a repulsive field as low as 0.6 volts would be consistent with the assumption that the energies
of the secondaries are quite small, The presence of even a relatively large number of low energy secondaries can hardly be expected to affect the survival ratio-dosage curves in view of the marked resistance of Penicillium sp. to 1 KV electrons (See Section VI).
The major portion of the data here reported is that contained in the survival ratio-electron dosage curves of Table V-4 and Figs. V-0 through V-V . This data was
secured as outlined in Section IV. Each point of the curve represents counts of an average of 350 spores. In
V-7
no case was a count based on less than 200 individuals and frequently the number was as high as 500. The data are based on counts of a total of 150,000 spores.
The unrayed portions of the slides were regularly used as vacuum controls during the latter part of the work. Only data from spores rayed on aluminum slides
were used in plotting the curves.
The curves of Figs. V-o through V-u have as ordinates the survival ratio, i.e., the ratio of percent survival of the rayed spores to the percent survival of the con-trols. Abscissae indicate the electron dose administered measueed in coulombs per sq. cm. The points represent the more reliable data obtained from the last 13 runs taken after instrumental operation and biological tech-nique had become more standardized. Data from previous runs are less reliable but agree roughly with the later results.
Fig. V-v is a condensation of the essential
data from the curves of Figs. V-o through V-u. Ordi-nates represent the electron dose needed to reduce
the survival ratio to one-half; abscissae represent the electron energies in e-KV. The range of values consistent with the preceding curves is comparable with the diameter of the circles used in plotting except for the points at 1.4 and 1.6 K.V. The latter
V-8
are based on incomplete data and must be regarded as approximations. The trend of the curve is, however, unmistakable. At 1 KV. a series of increasing dosages
extending to 6.8 x 10⁻⁴ coulombs per sq. cm. failed to produce anZ noticeable effect. This is a factor of more than 104 the dose sufficing for 50% killing at 3 KV. The data used in plotting Fig. V-v is con-tained in Table V-5. TABLE V-5 Electron Energy (9-KV. ) 1.0 1.4 1.6 2.0 3.0 4.0 5.0 6.0 7.0 9.0
Electron Dose to Give S.R.= 0.5 (Coulombs/cm.2 x 107)
>6,800. to give any effect
ca. 40. ca. 3. - 1.01 0.05 0.51+ 0.02 0.49+ 0.03 0.5lk 0.03 0.60k 0.03 0.67+ 0.02 0.85 h 0.04
A number of tests were made of various factors
which might have affected the results of the inter-pretation. One of the first items requiring such a
check was the effect of prolonged evacuation. The results were obtained as a by-product of extended
V-9
instrumental tests and adjustments. The conclusion
to be drawn seems to be quite definitely that evacuation to ca. 10-5 mm. for at least as much as 36 hours neither
prevents nor retards germination. The same result holds for repeated evacuation.
Another potential variable was the culture used in preparing the slides. A series of slides, identical except for the source of the spores loaded on them, were given identical doses and culture conditions. The results are shown in Table V-6.
TABLE V-6 Culture No. Percent Survival at
3 KV 4 KV 1 56.2 -26.0 2 58.3 44.5 49.7 37.9 65.5 33.4 48.0 3 36.2 4 50.9 30.6 5 73.3 38.6
The variation between the slides of culture #2 is about that recurring throughout the work. The variations occurring between slides of different
cultures are somewhat larger but no consistent dif-ferences are evident.
V-10
An extended series of experimental tests designed to reveal any effects due to x-rays was performed.
The data and conclusions are presented together in section
VI.
The photomicrographs of Figs. V-a through V-g
cycle
show the stages in the normal life of Penicillium sp. Figs. V-k through V-n show characteristic fields
used in obtaining the data for the curves. The changes in appearance with increasing mortality are clearly
shown. The extension of the series to complete killing is provided by the rayed areas of Figs. V-h and i.
These latter together with Fig. V-j were included to demonstrate also the sharp boundaries of damage due to the electron beam.
v-/I
Fip. V-a.--Ungermiinated spores iimniediately after
print-ing onto agar.
Fig. V-b.--Initial swelling.
V-1l
Fig. V-c.--Complete swelling.
Fig. V-d.--Germ tube formation. (This is the stage at which counts were made. Spores showing
definite swelling were counted as germinating.
V-13 r& 4 95)A ti 0' t 9 '4 5 It 4 '~1 1 9 9 'Ci S $ C -' . '1 9 'Otl4 / ~tje S S N A V
Fig. V-e.--Two stages of rapidly spreading mycelial growth.
I
/ *
V- 14
I
0V)0
-4@ 0 4~I
0k 0A 0 0'I
0 *0Fig. V-f.--Maturation of fruiting bodies.
0 ~* 0* 40 %4
.3*I
AFig. V-g.--Fruiting bodies showing filaments of spores.
0 A S 4 EMEMEW
I
V-15 1 . d~ ~ ,, e5. *?-' *;~ 4 -~- I. ~*& ~ 4
Fig. V-h.--Line of demarcation between unrayed and heavily rayed areas.
Ia )
Y
~ U I .-*1(
')CFig. V-i.--Boundary between rayed and unrayed areas for a dose giving ca. 60-70O killing.
-V-/6
Fig. V-j.--"Shadowgraph" of slit. (Slide was not rota-ted during exposure.) The killed area has been overgrown by mycelium from the edges.
1'.0.
'A-
'..
'~'
1- *
Alt
1 -/7
Fig. V-k.--Typical field showing
75%
survival after irradiation with 0.565/O-7coulombs per sq. cm. of 7 KV electrons. *7 V au. * 4. 6* "'V * 4* *
V * kFig. V-l.--Typical field showing
85%
survival afterirradiation with 0.5/ x/0Q7coulombs per
sq. cm. of 7 KV electrons. '.4 Orr~ 'All - 16' 1 *, . r
Fig. V-m.--Typical field showing 50 survival after irradiation with 0.67 x /Q-7coulombs per
sq. cm. of 7 KV electrons.
Fig. V-n.--Typical field showing
40%
survival after irradiation with 0.7/
x/Q~7coulombs persq. cm. of 7 KV electrons. 04 0MON" PP 3 9 ~ A' 3 3 0~ 3 0 ~ 1) ~ 0 0
sz -/9
TABLE V-4
Code for Figures V-o through V-u Experimental run Points as plotted
B17 0 18 ( 19 20
e
21 0 22 23 0 30-4 Q
5
9
6
9
7-o
82
K.V.
0.60.8
0.2-0
4:
0-0
0
0
04
0.8
[2
6
2.0
X
I~
7ELECTRON
DOSE
(COUL.
CM
)
I I
1.0
3 K.V.
Q8
08
0.6
Q 0.4
C)0.2
0
I 00
0.4
0.8
1.2
1.6
X
I0
ELECTRON
DOSE
(COUL/CM.)
FIG.
=-P
1.0
4 K.V.
0.8
0
0.6
>0.4
Cr
0.2
9
0
0
0.4
08
1.2
1.6
X
10-ELECTRON
DOSE
COUL./C
I I
5
K. V.
1.0
Q8
0.8
ELECTRON
DOSE
(COUL./CM)
1.6 X I0~
FIG.
Z'7
-
R
&
0.6
tx
cr0.4
C,)0.2
0
N 00.4
I I I iI
.0
6 K.V.
08
0
~~
9
0.6
0.4N
9
66
0.2
6-0
6
0 00.4
0.8
1.2
1.6
A
10~ELECTRON
DO SE
(COUL./CM )
FIG.V-
S
I I
1.0
7 K.V.
p
08
0.6
.
04
p
0.2
0
0
0.4
08
1.2
.6
X
10
ELECTRON DO$E @COUL/M)
FIG.
V-
T
9 K.V
1.0
0.8
Q0.6
o-0Q,4
a I I I I I IELECT RON
0.8
DO SE
FIG.
=
(COUL.
CM
- U
1.6
X10
b b b02
0
N QN0
0.4
a I
I
I I I IELECTRON DOSET OR~rSURVIVAL-vRATIOI& 0.5
QOU/C)
0
QCOUL./CM.-)
;JLP'S m 0 -00~
~~~~~~1 4 .1 iL...J... r4 4..~ i SI , I..I
0.
-*1~ -- .'-fp
N hi w 15, L, ka a A VbL'
VI-1
VI DISCUSSION OF DATA
Errors and Possible Misinterpretations.
Errors in the physical measurements due to fluctua-tions of the electron beam, electrometer drift, and read-ing errors will not exceed 2%. This is equivalent, in the worst case, to a 5% error in the survival ratio.
Systematic errors due to calibrations have been consider-ed and will not exceconsider-ed 1-2%. Errors due to the measure-ment of low voltage secondaries from slit jaws or from
the tube box have been investigated and the maximum devi-ations shown to be 1% or less. A source of error which has not been completely checked is the reading and
stabi-lization of the high voltage. Errors of reading and calibration may be as much as 5%. This however, is not serious except between 1 and 2 KV. since elsewhere the change of required dose with voltage is very slight.
The sampling error when ca. 350 spores we counted for one reading is 3.6% assuming statistical distribu-tions. However, the careful selection of "representative" areas for counting will tend to decrease the random
errors but may very well introduce a corresponding system-atic error. For example, a region of slightly greater killing than the average will by reason of that fact
VI-2
appear less congested and thus invite selection. Great care has been exercised to keep errors due to clumping of the spores (and consequent shielding) at a minimum. The slides have been carefully brushed to remove clumps, and before raying, have beerixamined in detail. Highly polished slides were found to be necessary to prevent accumulation of the spores in small scratches in the metal surface. In counting, care has been taken to omit obvious clumps. The error in distinguishing between germination and non-germination has been reduced by
improvements in technique until it is a minor factor and not as important as unavoidable clumping. A fairly
accurate measure of the extent of clumping is afforded by the residual survival ratio beyond the region where the dose is critical.
A potential source of considerable biological error
is non-uniformity of the water supply to the germinating spores. The surfact of the agar print must be uniformly moist, or germination may be delayed sufficiently in
certain areas to alter the count. Too much water leads to profuse "sweating" on the surface of the print and to selective disarrangement of the spores. Close super-vision during germination permits maintaining a
VI-3
procedure has given quite satisfactory results.
The biological errors due to such causes as those
above amount to 5-8%.
The possibility of spurious killing due to x-ray was considered early in the problem. There was no expecta-tion that it would be a serious difficulty but adequate tests seemed desirable to eliminate any possible misin-terpretation of the results.
An approximatel relation giving the efficiency of production of x-rays is
Eff. = 1.1 x 10⁻⁹ V
x-ray output
This means that with constant current, the -ef4 ne
increases as V2. For 10 KV electrons on aluiiinum
= 13), the efficiency of production is ca. 0.014%.
Since the dose-voltage curve (Fig. V-v) does not show a continuously decreasing dose with increasing voltages, the absence of x-ray effects seems fairly certain.
However, some tests were made giving identical doses to spores on aluminum and on tin slides, also on alumin-um and on chromialumin-um. No significant difference was found
in the results although there should have been factors of 4 and 2 in the production of general radiation.
1. Compton, A. H. and S. K. Allison. "ix-Rays in Theory and Experiment", N. Y. 1935, p. 90
VI-4
Tests for characteristic radiation were made by giving equal doses to spores on aluminum at 1.4 and 1.6 KV. and on chromium at 5.5 and 6.5 KV. thus bracketing the K excitation voltages of 1.55 and 5.98 KV. respectively. The results with chromium were negative; apparent results
for aluminum were due to electron penetration of the cell wall. The net result was that x-rays were not effective
to a detectable degree.
The ejection of secondary electrons from the slide being rayed in numbers comparable with the number of primaries could require large corrections if such elec-trons were biologically effective. However, ineffect-iveness of 1 KV. electrons upon the spores eliminates any possible effect from secondaries of a few volts energy. Electrical tests indicated less than 1% of reflected primaries.
The possibility of spurious effects from heat kill-ing seems negliglble. Filament heat cannot reach the slides. The power supplied by the beam to the slide to give complete killing even at 9 KV. is less than 10-5 watts for 30 seconds. Finally, such internal evidence
as the sharpness of the boundaries between rayed and unrayed areas is adequate evidence that heat effects
VI-5
Basis for Ifterpretation of Data
This experimental method has the important advantage over x-ray methods in that it yields the detailed effects at various points within the cell. That is, the elec-tron beam constitutes an "elecelec-tron probe" with which one can explore as shallowly or as deeply as one wishes. Previous workers with cathode rays have sacrificed this advantage for the very considerable experimental simpli-fication to be had by the use of high voltages. Zirkle2 has used alpha particles in this way, but in spite of
the great advantage that they are but slightly scatter-ed, the results are probably not applicable to ioniza-tion by electrons. This is dCue to the very high concen-tration of ions along alpha ray paths and to the relation found by Zirkle between ion concentration and biological effectiveness. Recent attempts4'o apply this
2. Zirkle, R. E.--Jour. Cell. and Comp. Physiol. 2,
251-274 (1932)
--Amer. Jour. Cancer 23, 558-567 (1935) 3. Lawrence, J. H. and E. 0. Lawrence--Proc. Nat. Acad.
Sci. 22, 125-133 (Feb. 1936)
Zirkle, R. E. and P. . Aebersold--Proc. Nat. Acad.
vi46
relation to experiments on the biological effective-ness of neutrons have resulted in serious discrepancies between calculation and experiment. An advantage
possessed in common by alpha particles and electrons is
that the very end of the range is marked by a greatly
increased concentration of ions. The effect is more pronounced with electrons than with alpha particles.
A serious difficulty encountered with electrons is the
ease with which they are scattered and the extremely devious paths pursued near the end of the range. This
means that the maximum ionization due to the path ends
will not be at the depth in the cell calculated from the limiting range (Srenzdicke) but at an appreciably
smaller depth.
Fig. VI-a indicates the grenzdicke values for
various voltages and shows diagramatically the limiting
point within the spore which can be reached by an
elec-tron of given energy. Curves are also included for two voltages showing the relative numbers of ion pairs per
cm. at various points within the spore. The basic data4
on electron range in aluminum were reduced to range in water by multiplying by the density ratio. Values of
ion pairs per am. are relative and were taken as
propor-4. Lenard, P. and A. Becker in Wien-Harms "Handbuch der Experimentalphysik", V. 14 pp. 131-135.
Bothe, W. in Geiger and -Scheel's"Handbuch der Physick,
VI-7
tionalito the corresponding values5 in air at 1 mm.
Hg and 000.
Calculations of the number of electrons imping-ing upon a simping-ingle spore can be made directly from the dose in coulombs per sq. cm., and the spore dimensions. The spores of Penicillium sp. are spherical and vary in diameter between usual limits of 3.0 to 4.5 with an average value of 3.5,u . The usual variations in size are not detectable visually. Using the average diameter and the electron dose of 5 x 10⁻⁸ coulombs per sq. cm. needed to produce 50% killing at 3-5 KV., the average number of electrons striking a single spore is ca. 30,000. With this density of electrons project-ed onto the slide and spores, a spherical volume of diameter 1.4 x 10⁻⁶ cm. within the spore would have a
50% chance of being hit once. This then would correspond to the "sensitive volume" if a single hit mechanism
were involved.
5. Klemperer, 0.--"Einfuhrung in die Vlectronik",
VI-8
Interpretation of Data
The present data are too limited in range and
accuracy to justify conclusive interpretation. Further-more, the data apply to only one organism, a fact which does not permit a valid choice between certain alterna-tives. However, it should be of value to examine the compatibility of these data with reasonable assumptions regarding the effect of electrons on the spores of
Penicillium sp.
If one assumes that the spore has a single nucleus, and that it lies near the geometrical c enter of the spore, it seems reasonable to attribute the pronounced mortality at voltages below ca. 5 KV. to injury to the
cytoplasm since electrons of even 5 KV. cannot penetrate to the center of an average sized spore. The injury may be assumed to be a general effect or an effect on speci-fic sensitive regions scattered throughout the cytoplaan. However, the sigmoid shape of the survival-dosage curves strongly suggests6 that, whatever the details of the injury inflicted, loss of germinating power results from a number of injuries, and not from a single one.
6. Crowther--Proc. Roy. Soc., B , 100, 390 (1926)
VI-9
A similar effect7 is observed with x-rays when such a complicated injury indicator as death is employed. In the x-ray case, however, a multiple-hit mechanism in-volving the nucleus is usually invoked. The number of electrons per spore needed to produce any observable effect is also consistent with a multiple-hit interpre-tation.
The absence of any .drop in the course of the dose-voltage curve (Fig. V-v) at a dose-voltage (ca. 6 KV.
)
corresponding to electron penetration to the central region of an average sized spore could conceivably be accounted for under any one of the following assumptions:
1) The nucleus may be single and so small that death as a result of injury to the cytoplasm
is more probable than death from nuclear injury.
2) The nucleus, if single, may not be located in the center of the spore but may be randomly
oriented, or there may be several nuclei distri-buted throughout the spore. Either assumption would permit assigning to the nucleus or nuclei
all of the observed effects.
7. e.g. Packard--Journ. Cancer Res. 11, 1 (1927) (See also Ref. 6)
VI-10
3) The nucleus may not be easily damaged by elec-tron bombardment. This, if true, would be in disagreement with a large body of radiation literature as well as with the working basis of modern radiation genetics.
Cytological work now in progress on spores from the cultures used for this radiation work should permit a choice between the alternatives of (1) and (2).
Unfortunately, it was not until the end of this work that it was learned from Dr. Linder of Harvard University
that he had developed an as yet unpublished technique suitable for staining the nucleus in Penicillium spores; an accomplishment that had hitherto been deemed well-nigh impossible because of the difficulties presented by
the extreme impermeability of the cell wall to ordinary cytologic reagents. Dr. Linderts technique is being used for the present work.
The general shape of the dose-voltage curve is qualitatively interpretable on the basis of Fig. VI-a. If one assumes for simplificstion that the electron paths are straight and that cell injury varies
approx-imately with total ionization, then the volumes of the two shaded sections of Fig. VI-a representing the regions of heavy.ionization coming at the ends of the electron
VI-11
paths for 4 and 7 KV. electrons respectively are very rough measures of the probability of sufficient damage
to induce death. This would explain qualitatively why
the electron energies requiring least dose to give 50% killing are less than is necessary for penetration to the center of the spore. The effect of electron scatter-ing would be to broaden the minimum in the curve by
lowering the dosage values at the higher voltages. Less important modifications in the shape of the curve would be introduced by consideiring the size distribution of
the spores, variable sensitivity to damage by electron bombardment and the detailed variation of cell damage
as a function of ion concentration.
The precipitous drop of the dose-voltage curve
between 1 and 2 KV. seems fairly clear-cut evidence for lack of damage of the type observed in these experiments to the cell due to electron bombardment of the cell wall.
A more accurate determination of the shape of the/curve
in that region could confidently be expected to yield a better value for the thickness of the insensitive portion of the cell boundary than is otherwise
obtain-able. A value8
/from
the present data, assuming that that penetration just occurs at ca. 1.4 KV., is ca. 0.13 .Microscopic examination indicates merely that the wall thickness is near the resolving power of the instrument,
.ieca. 0.3p.
8. Calculated from data compiled by 0. Klemperer--"Einf. in die Elektronik", Berlin, 1933, p. 272. This "true" range differs from the "grenzdicke " of rig. VI-a.
VI-12
Finally, it is perhaps worth comparing the proposed interpretations of thesepata with the interpretation which would probably have been put on curves similar to
those of Figs. V-o, etc., had they been obtained by x-ray measurements. In the latter case, analogy with
accepted interpretations in the literature would
proba-bly have resulted in ascribing the killing to a
multiple-hit mechanism in the nucleus. The electron method makes such an interpretation highly implausible if the nucleus is single and is near the center of the spore. In case the effect could be shown to be a nuclear one, the
electron method of attack yields independently the
IZn ide
a-Fflectron Energy in e-KV.
VII-1
VII. SUMMARY
The survival curves obtained by the irradiation
of spores of Penicillium sp'. with electrons of controll-ed energies ranging from 1 to 9 e-KV. indicate that loss of germinating power may possibly be ascribed to a
succession of injuries. Loss of germinating power is observed to result from an electron penetration in excess
of ca. 0.1 - 0.2/,- . No additional effect is observed
if the electron penetration is extended to the center of the spore. Hence, if the nucleus be single and located near the center of the spore, the results may possibly be interpreted to mean that loss of germinating power results from injury to the cytoplasm even though the nucleus be in the region -irradiated. An alternative explanation is that the nucleus is multiple or randomly oriented, thus permitting identification of the injured portion with the nucleus (nuclei).
The data also clearly indicate a c ell boundary exceedingly insensitive to damage by electrons, and permit a determination of its thickness with moderate accuracy.
The data obtained can be qualitatively explained on the basis of the known ionization function for an elec-tron and the geometry of the spore.
VII-2
Further precision data would permit a more accurate determination of the thickness of the insensitive cell boundary and would justify a detailed study of the
shape of the derived dose-voltage curve from which could be obtained the r-elationpetween biological effectiveness and ion concentration along the path of the ionizing electron. Parallel data on suitable biological material is needed to strengthen a conclusion of injury to the cytoplasm in case the cytological findings are that the nucleus is single and at the center of the spore.
An extension of the experimental work to somewhat higher voltages should provide the data for a detailed correlation of x-ray and cathode ray effectiveness as a function of total ionization per c'ell.
The method and apparatus have demonstrated their essential merit and an example has beelcited of the potential utility of theelectron-probe" method in preventing misinterpretation of survival curves..
VIII. ACKNOWLEDGEMENTS
This thesis was carried out under the direction and with the ready support of Professor R.D. Evans. The problem is one requiring full cooperation between biologist and physicist. It is a very real pleasure
to acknowledge the essential role played by Mr.
S.H. Hutner as the biologist in this inveStigation.
The section on biological procedure was contributed
by Mr. Hutner. Also, the author is very deeply indebted
to Mr. Otto Morningstar for his extensive and untiring assistance with the physical side of the problem.
To Dr. C.P. Haskins of Schenectady, New York, belongs credit for suggesting the problem and for financial backing without which this work could not have been
carried on. In addition the author wishes to express his sincere appreciation of the keen interest and experimental assistance given by Dr. Haskins. To
Dr. E.V. Enzmann of the Harvard Biological Laboratories, the author owes thanks for the series of photomicro-graphs. For biological equipment and services as well as for interest and cooperation the author is indebted to the Department of Biology and Public Health and particularly to Mr. B.W. Parker. Valuable advice
Vnir- z
by Professors B.E. Warren, G.R. Harrison, E.G. Rudberg,
W.B. Nottingham, D.C. Stockbarger, Mr. J.E. Forbes, and Mr. C.E. Hentz (Electrical Engineering). Friendly and valuable assistance has been rendered by Mr. H.E. Tatel, Wm. Shockley, L.I. Schiff, and others. The author is indebted to the Department of Physics for generous financial support and for essential services. Especially warm thanks are due Mr. K.H. Robes for his painstaking work in the construction of the apparatus,
to Mr. J.E. Ryan for glassblowing, and to Mr. H. Hill and Mr. W.M. Gray for incidental services. Finally, sincere thanks are due the author's wife for her invaluable aid in preparing this thesis.