HAL Id: hal-00641423
https://hal.archives-ouvertes.fr/hal-00641423
Submitted on 15 Nov 2011
HAL is a multi-disciplinary open access
archive for the deposit and dissemination of
sci-entific research documents, whether they are
pub-lished or not. The documents may come from
teaching and research institutions in France or
abroad, or from public or private research centers.
L’archive ouverte pluridisciplinaire HAL, est
destinée au dépôt et à la diffusion de documents
scientifiques de niveau recherche, publiés ou non,
émanant des établissements d’enseignement et de
recherche français ou étrangers, des laboratoires
publics ou privés.
Nitrogen uptake by phytoplankton in the Atlantic sector
of the Southern Ocean during late austral summer
W.R. Joubert, S.J. Thomalla, H.N. Waldron, M.I. Lucas, Marie Boye, F.A Le
Moigne, Frédéric Planchon, Sabrina Speich
To cite this version:
W.R. Joubert, S.J. Thomalla, H.N. Waldron, M.I. Lucas, Marie Boye, et al.. Nitrogen uptake by
phy-toplankton in the Atlantic sector of the Southern Ocean during late austral summer. Biogeosciences,
European Geosciences Union, 2011, 85, pp.2947-2959. �10.5194/bg-8-2947-2011�. �hal-00641423�
www.biogeosciences.net/8/2947/2011/ doi:10.5194/bg-8-2947-2011
© Author(s) 2011. CC Attribution 3.0 License.
Biogeosciences
Nitrogen uptake by phytoplankton in the Atlantic sector of the
Southern Ocean during late austral summer
W. R. Joubert1,2, S. J. Thomalla1,2, H. N. Waldron2, M. I. Lucas3, M. Boye4, F. A. C. Le Moigne4, F. Planchon4, and S. Speich5
1Council for Scientific and Industrial Research, P.O. Box 320, Stellenbosch, 7599, South Africa 2Department of Oceanography, University of Cape Town, Private Bag X3, 7701, South Africa 3Department of Zoology, University of Cape Town, Private Bag X3, 7701, South Africa
4Laboratoire des Sciences de l’Environment Marin, UMR6539 UBO/CNRS/IRD, Institut Universitaire Europ´een de la Mer,
Technopˆole Brest Iroise, Place Nicolas Copernic, 29 280, Plouzan´e, France
5Laboratoire de Physique des Oceans (LPO), UMR6523 CNRS/IFREMER/IRD/UBO-IUEM, Centre Ifremer, BP70, 29820
Plouzan´e France
Received: 6 April 2011 – Published in Biogeosciences Discuss.: 23 May 2011
Revised: 30 September 2011 – Accepted: 6 October 2011 – Published: 21 October 2011
Abstract. As part of the Bonus-GoodHope (BGH) cam-paign,15N-labelled nitrate, ammonium and urea uptake mea-surements were made along the BGH transect from Cape Town to ∼60◦S in late austral summer, 2008. Our results are
categorised according to distinct hydrographic regions de-fined by oceanic fronts and open ocean zones. High regener-ated nitrate uptake rate in the oligotrophic Subtropical Zone (STZ) resulted in low f -ratios (f = 0.2) with nitrogen up-take being dominated by ρurea, which contributed up to 70 % of total nitrogen uptake. Size fractionated chlorophyll data showed that the greatest contribution (>50 %) of picophy-toplankton (<2 µm) were found in the STZ, consistent with a community based on regenerated production. The Sub-antarctic Zone (SAZ) showed the greatest total integrated ni-trogen uptake (10.3 mmol m−2d−1), mainly due to enhanced nutrient supply within an anticyclonic eddy observed in this region. A decrease in the contribution of smaller size classes to the phytoplankton community was observed with increas-ing latitude, concurrent with a decrease in the contribution of regenerated production. Higher f -ratios observed in the SAZ (f = 0.49), Polar Frontal Zone (f = 0.41) and Antarc-tic Zone (f = 0.45) relative to the STZ (f = 0.24), indicate a higher contribution of NO−3-uptake relative to total nitro-gen and potentially higher export production. High ambient regenerated nutrient concentrations are indicative of active regeneration processes throughout the transect and ascribed to late summer season sampling. Higher depth integrated
Correspondence to: W. R. Joubert
(wjoubert@csir.co.za)
uptake rates also correspond with higher surface iron con-centrations. No clear correlation was observed between car-bon export estimates derived from new production and234Th flux. In addition, export derived from15N estimates were 2– 20 times greater than those based on234Th flux. Variability in the magnitude of export is likely due to intrinsically differ-ent methods, compounded by differences in integration time scales for the two proxies of carbon export.
1 Introduction
The Southern Ocean is considered one of the most impor-tant ocean sinks of atmospheric CO2 (Caldeira and Duffy,
2000; Sigman and Boyle, 2000), making it important in un-derstanding the global carbon cycle. Primary productivity in the Southern Ocean plays a key role in the biological uptake of atmospheric CO2 (Metzl et al., 1999; Takahashi
et al., 2002). Phytoplankton biomass typically shows low chlorophyll a (chl-a) (<0.5 mg m−3) in open ocean waters of the Southern Ocean (Tr´eguer and Jacques, 1992; Banse, 1996; Moore and Abbott, 2000), while localised elevated chl-a (>1 mg m−3; Moore and Abbott, 2000) are often
as-sociated with mesoscale upwelling at hydrographic fronts (Laubscher et al., 1993; Comiso et al., 1993; Moore and Abbott, 2002; Sokolov and Rintoul, 2007), the marginal ice zone (MIZ) (Smith and Nelson, 1986; Sedwick and DiTul-lio, 1997) and regions of shallow bathymetry around Sub-antarctic islands (Blain et al., 2001; Pollard et al., 2002; Korb and Whitehouse, 2004; Seeyave et al., 2007; Whitehouse et al., 2008). Under-utilization of available macronutrients by
2948 W. R. Joubert et al.: Nitrogen uptake by phytoplankton in the Atlantic sector phytoplankton production results in the prevalent high
nu-trient low chl-a (HNLC) condition (Chisholm and Morel, 1991) of the Southern Ocean. Despite a high inventory of available macronutrients, low chl-a concentrations are main-tained by bottom-up controls of phytoplankton production through light, iron, and silicate limitation (Martin et al., 1990; Bathmann et al., 1997; Boyd et al., 2001, 2002, 2007; Moore and Abbott, 2002; Arrigo et al., 2008), as well as by top-down grazing control (Banse, 1996; Cullen, 1991; Price et al., 1994; Smetacek et al., 2004; Behrenfeld, 2010). These factors regulating primary production all modify carbon ex-port and thus play a key role in determining the strength of the Southern Ocean biological carbon pump.
Measurements of phytoplankton production throughout the euphotic layer using15N stable isotopes (Dugdale and Goering, 1967) have often been used to infer carbon export into the ocean interior based on the f -ratio (Eppley and Pe-terson, 1979; Savoye et al., 2004). The f -ratio differenti-ates between the uptake of NO−3 by phytoplankton which is “new” to the euphotic layer, introduced primarily by seasonal overturning or upwelling and “regenerated” nutrient uptake (NH+4, urea and dissolved organic nitrogen (DON)) which is recycled within the euphotic layer (Eppley and Peterson, 1979). As nitrogen flux into surface waters must ultimately be balanced by equivalent losses, the f -ratio is a measure of that fraction of primary production, which is potentially available for export to the deep ocean or to higher trophic lev-els; which is surplus to phytoplanktonic community mainte-nance requirements (Goeyens et al., 1998). NO−3 uptake can thus provide an indirect estimate of downward carbon flux when Redfield ratio stoichiometry is inferred or measured (Eppley and Peterson, 1979). This approach to measuring carbon export relies on a number of underlying assumptions which include steady state conditions (uptake flux of NO−3 approximately balanced by particulate nitrogen flux out of the surface), no storage of nitrogen in surface waters (Eppley and Peterson, 1979), and minimal euphotic layer nitrifica-tion (Bianchi et al., 1996; Yool et al., 2007). In addinitrifica-tion, the use of stoichiometric ratios to convert nitrogen uptake (ρN to carbon equivalents may be compromised by non-Redfield behaviour in the cellular response to available light, iron and nutrients (Brzezenski et al., 2003; Arrigo, 2005; Moore et al., 2007). Although nitrification in surface waters is particularly important in oligotrophic ocean regions, this process does not appear to be significant in nitrate replete environments (Yool et al., 2007; Lucas et al., 2007; Clark et al., 2008). Despite its limitations, the f -ratio therefore remains a use-ful proxy for estimating potentially “exportable production” (Sambrotto and Mace, 2000) in nutrient rich polar oceans.
Carbon export estimates are also possible using
234Th/238U disequilibrium (e.g. Buesseler, 1992). Lower
activities of particle-reactive 234Th relative to its conser-vative parent 238U in surface waters are associated with sinking particles. Particulate Organic Carbon (POC) export is calculated as the product of the ratio of POC/234Th on
set-786
Figures and Tables:
787
788
Figure 1. Cruise track during the Bonus Goodhope 2008 campaign in the Atlantic Southern
789
Ocean. Red dots indicate the sampling positions for 15N uptake experiments. The 790
hydrographic fronts, Subtropical Front (STF), Sub-Antarctic Front (SAF), Polar Front (PF),
791
South Antarctic Circumpolar Current Front (SAccF) and Southern Boundary (Sbdy) are
792
indicated by dotted white lines.
793 794 795 796 797 798 799
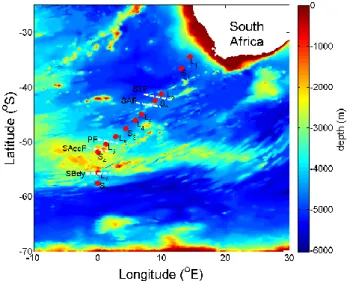
Fig. 1. Cruise track during the Bonus Goodhope 2008 campaign in
the Atlantic Southern Ocean. Red dots indicate the sampling posi-tions for15N uptake experiments. The hydrographic fronts, Sub-tropical Front (STF), Sub-Antarctic Front (SAF), Polar Front (PF), South Antarctic Circumpolar Current Front (SAccF) and Southern Boundary (Sbdy) are indicated by dotted white lines.
tling particles and the234Th disequilibrium flux (Coale and Bruland, 1985). Uncertainties associated with this method relate to varying measurement techniques and choice of models (steady-state vs non steady state). In addition, arguably the largest uncertainty in the application of the thorium approach lies in reliably characterising the ratio of POC:234Th on settling particles, which varies with time, depth, particle type, size and sinking velocity (for review see Buesseler et el., 2006). Despite all the uncertainties associated with the various proxies of carbon export, it is nonetheless useful to compare a variety of export estimates as they access different time and space scales.
This paper reports measurements of new and regenerated uptake rates and f -ratios (as a proxy for export) in surface waters of the Atlantic sector of the Southern Ocean in late austral summer 2008 as part of the BGH programme. The cruise crossed a number of mesoscale features and major hy-drographic fronts; namely the Subtropical Front (STF), the Sub-Antarctic Front (SAF), the Polar Front (PF), the South-ern Antarctic Circumpolar Current Front (SAccF) and the Southern Boundary (Sbdy) (Fig. 1). Results from this study characterise ρN dynamics and f -ratios across different hy-drographic regions and investigates their relation to MLD, light, macro-nutrient and dissolved surface iron concentra-tions. We compare our data with15N estimates of production in other areas of the Southern Ocean, as well as with234Th based estimates of carbon export measured during the BGH cruise.
2 Methods
2.1 Sampling and cruise track
The sampling cruise on board the R/V Marion Dufresne was conducted from 8 February–18 March 2008. The cruise tran-sect (Fig. 1) started on the shelf outside Cape Town (South Africa) at the 200 m isobath and followed the GoodHope – A21 transect in a south-westerly direction to the 0◦
merid-ian, then continued south to 58◦S. A total of 79 sampling
stations were completed, 12 of which were targeted for ρN incubations using15N tracer techniques (Slawyk and Collos, 1977; Dugdale and Wilkerson, 1986).
2.2 Hydrography
Water mass characteristics of the section sampled were de-termined from temperature, salinity measured with a CTD (SEABIRD 911plus) mounted on a SEABIRD rosette. On-board thermosalinograph (SEABIRD SBE21) data were col-lected in continuous mode at 5 m below sea level. Thermos-alinograph data was validated with daily water sampling fol-lowed by on-board analysis. Mixed layer depths were deter-mined using the temperature criteria (1T < 0.2◦C in refer-ence to the temperature at 10 m depth, de Boyer-Mont´egut et al., 2004).
2.3 Nutrient analyses
Ambient concentrations of NH−4 and urea-N were deter-mined manually by the colorimetric method of Grasshoff et al. (1983), scaled to 5 ml samples. Ambient NO−3 and Si(OH)4-Si concentrations were analyzed on a Bran and
Lubbe AAIII autoanalyser, as described in Tr´eguer and Lecorre (1975).
2.4 Chlorophyll-a
Total chl-a samples were collected in the upper 300 m at 6 depths from all CTD stations and 10 depths at all the ρN experiment stations. The samples were filtered onto 25 mm Whatman GF/F filters, extracted in 6 ml Acetone prior to fluorometric determination on a Turner Designs AU-10 flu-orometer (Strickland and Parsons, 1972). Phaeopigments were determined by reading the fluorescence after acidifi-cation with 2–3 drops of 10 % hydrochloric acid. Size-fractionated chl-a determinations were collected opportunis-tically from surface water sampling. Size-fractionated
chl-a concentrations were determined by screening samples through a 200 µm mesh (<200 µm fraction), and a 20 µm mesh (<20 µm fraction), followed by filtration onto What-man GF/F filters. The <2 µm fraction was obtained by filtering a sample through a 2 µm Nuclepore membrane filter and thereafter collecting the filtrate on a Whatman GF/F filter. Microphytoplankton (20–200 µm) were deter-mined by subtracting the <20 µm fraction from the <200 µm
fraction; nanophytoplankton (2–20 µm) by subtracting the
<2 µm fraction from the <20 µm fraction, while picophy-toplankton were represented by the <2 µm fraction. Chl-a and phaeopigment concentrations of each fraction were de-termined as above.
2.5 POC and PON
Particulate organic carbon (POC) and nitrogen (PON) were determined by filtering 1 l samples onto pre-ashed 25 mm Whatman GF/F filters that were frozen at −20◦C until anal-ysis ashore. Samples were then oven-dried at 45◦C, acid fumed with sulphuric acid to drive off inorganic carbon and pelletted into tin cups (8 × 5 mm) prior to analysis on a Thermo Scientific Flash EA1112 elemental CHN analyser. 2.6 Nitrogen uptake measurements
To determine depth integrated nitrogen uptake (∫ρN, sam-ples were collected at 5 underwater irradiance levels (100 %, 50 %, 25 %, 10 % and 1 %) measured using an underwa-ter PAR (400–700 nm) sensor attached to the CTD rosette. Three bulk samples (2 l each) from each light level were pre-screened through a 200 µm plankton mesh to exclude zooplankton grazers and transferred into borosilicate glass Schott bottles. Aliquots of 200 µl stock solutions of K15NO3 (1 µmol/100 µl), 15NH4Cl (0.1 µmol/100 µl) and
CO(15NH2)2 (0.1 µmol/100 µl)) were added, one to each of
the three bottles from all light depths for ρN incubations. The 15N enrichment was aimed at ∼10 % for each nutri-ent, assuming an average ambient NO−3 concentration of 10 µmol l−1, and 1 µmol l−1for NH+4 and urea. The inocu-lum was kept constant throughout the cruise and resulted in NH+4 enrichments that were greater than 10 % of ambient concentrations (10–30 %). Incubation bottles were placed in-side a Perspex tank covered with neutral density filters to re-create the appropriate light environment. Temperature was maintained at sea surface temperature (SST) by circulating surface water through the incubation tanks. Samples were incubated for 24 h and terminated by filtration onto ashed 47 mm Whatman GF/F filters, which were then dried at 45◦C
before later isotopic analyses. 2.7 Isotope analyses
Particulate matter collected on the Whatman GF/F filters were pelletted and placed 8 × 5 mm into tin capsules prior to isotopic analysis. Analyses were carried out on a Delta V Plus stable light isotope mass spectrometer interfaced to a Thermo Scientific Flash EA1112 Elemental Analyser. Nat-ural abundance for nitrogen was 0.3663 atom % 15N, were used to calculate the isotopic enrichment of the nitrogen ad-ditions. Values were scaled upwards to reflect the proportion of the sub-sampled area relative to the total filtered area. Sul-phanilamide and urea were used as calibration standards for carbon and nitrogen determinations. Specific uptake rates
2950 W. R. Joubert et al.: Nitrogen uptake by phytoplankton in the Atlantic sector
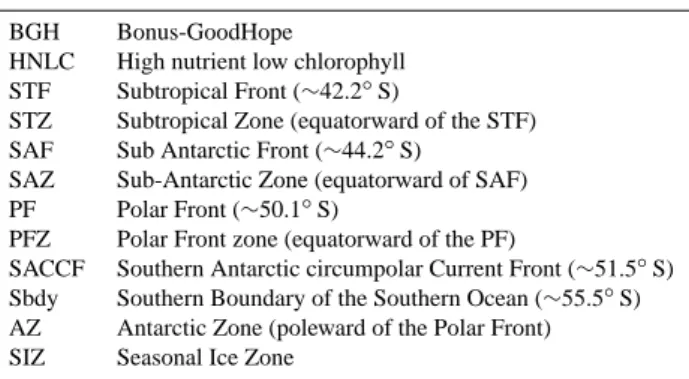
Table 1. List of abbreviations.
BGH Bonus-GoodHope
HNLC High nutrient low chlorophyll STF Subtropical Front (∼42.2◦S)
STZ Subtropical Zone (equatorward of the STF) SAF Sub Antarctic Front (∼44.2◦S)
SAZ Sub-Antarctic Zone (equatorward of SAF) PF Polar Front (∼50.1◦S)
PFZ Polar Front zone (equatorward of the PF)
SACCF Southern Antarctic circumpolar Current Front (∼51.5◦S)
Sbdy Southern Boundary of the Southern Ocean (∼55.5◦S) AZ Antarctic Zone (poleward of the Polar Front) SIZ Seasonal Ice Zone
for nitrogen were calculated from the isotopic ratios of the particulate organic material at the end of the incubations as described by Dugdale and Wilkerson (1986), without correc-tion for isotopic dilucorrec-tion in the case of NH+4 uptake. New production estimates were calculated from NO−3 uptake rates and in situ C:N ratios calculated from POC and PON sam-ples.
3 Results
3.1 Hydrography
The BGH meridional cruise track crossed all the major hy-drographic fronts and open ocean regions commonly recog-nised in the Southern Ocean (Orsi et al., 1995) (Fig. 1). The frontal positions during the cruise were determined using potential temperature criteria (Speich et al., 2011) (Fig. 2). The region north of the STF was defined as the Subtropi-cal Zone (STZ) where SST exceeded 14◦C and salinity ex-ceeded 35 psu (Fig. 2). The Sub-Antarctic zone (SAZ) lay between the STF (42.2◦S) and the SAF (44.2◦S), where SST fell in the range 9–14◦C, and surface salinity between 34–35 psu. In this zone, an intense anticyclonic eddy (“an-ticyclone M”; Arhan et al., 2011) of Indian Ocean origin was observed (at 42.9◦S –44◦S) over the Agulhas Ridge (Fig. 2). The Polar Front Zone (PFZ) extended from the SAF to the PF (Pollard et al., 2002) at 50.1◦S, where SST decreased from 10–5◦C and surface salinity was <34 psu (Fig. 2). The Antarctic Zone (AZ) was found south of the PF where temp was <3◦C and salinity was ∼34 psu. The
following results are presented according to the four zones defined above (STZ, SAZ, PFZ and AZ).
3.2 Nutrients
Nutrient concentrations shown in Fig. 3a, b are from the upper 200 m of the BGH cruise track (LeMoigne et al., 2011). In the STZ, surface nutrient concentrations (Fig. 3a, b) showed typical oligotrophic conditions, with surface
800
801
Figure 2. Zonal description of the regions during the cruise (Sub Tropical Zone (STZ), Sub 802
Antarctic Zone (SAZ), Polar Front Zone (PFZ) and Antarctic Zone (AZ). Surface temperature 803
(red line) and surface salinity (blue line) with latitude along the cruise track measured by 804
onboard continuous thermosalinograph. Sampling station identifiers are indicated above the 805
plot. The position of Anticyclone M is indicated by an increase in temperature and salinity in 806 the SAZ. 807 808 809 810 811 812 813 814 “Anticyclone M” L1 S2 L2 S2 L3 L4 S3 L5 L6 S4 L7 S5
Fig. 2. Zonal description of the regions during the cruise (Sub
Tropical Zone (STZ), Sub Antarctic Zone (SAZ), Polar Front Zone (PFZ) and Antarctic Zone (AZ). Surface temperature (red line) and surface salinity (blue line) with latitude along the cruise track mea-sured by onboard continuous thermosalinograph. Sampling station identifiers are indicated above the plot. The position of Anticyclone M is indicated by an increase in temperature and salinity in the SAZ.
NO−3 concentrations <0.05 µmol l−1 (Fig. 3a), while sur-face Si(OH)4 concentrations were typically <2 µmol l−1
(Fig. 3b). Surface NH+4 concentrations were depleted (<0.1 µmol l−1), while urea concentrations were variable,
ranging from 0.22–1.51 µmol l−1 (Table 2). In the SAZ,
a gradual increase in surface NO−3 concentrations was ob-served ranging from 5–15 µmol l−1, but reaching 20 µmol l−1 below 100 m depth (Fig. 3a, Table 2). Si(OH)4
concen-trations were depleted (<2 µmol l−1)throughout the surface 250 m (Fig. 3b). NH+4 concentrations were <0.25 µmol l−1, but reached concentrations of up to 0.4 µmol l−1between 40– 70 m depth (Table 2), while urea concentrations ranged from 1–1.5 µmol l−1 (Table 2). In the PFZ, surface NO−
3
con-centrations reached >20 µmol l−1 (Fig. 3a), while Si(OH) 4
concentrations remained <2 µmol l−1in the upper 100 m of the water column (Fig. 3b). From north to south, surface NH+4 concentrations (above 100 m) gradually increased from
<0.25 to >1.0 µmol l−1(Table 1). Urea concentrations were higher than in the STZ and ranged from ∼1 µmol l−1 to a maximum of 3.27 µmol l−1 (at ∼60 m, station S3). Uni-versally high nutrient concentrations were observed in the AZ. NO−3 concentrations exceeded 30 µmol l−1 in the sur-face ∼100 m and continued to increase to a maximum of
∼40 µmol l−1with depth (Fig. 3a). Si(OH)
4concentrations
showed a steep north-south gradient from <2 µmol l−1north
of the PF to >60 µmol l−1 at the southern margin of the region (Fig. 3b). NH+4 and urea concentrations in the AZ reached 0.8 and 2 µmol l−1in the euphotic layer.
815
Figure 3 a, b. Profiles of NO3 and Si(OH)4 in the upper 500 m along the Bonus Goodhope Cruise track (taken from LeMoigne et al., 2011). It
816
shows increasing surface nutrient concentrations with increasing latitude. Frontal positions are indicated by the white vertical dotted lines. 817 818 SAZ STZ PFZ AZ 80 30 20 10 0 120 40 40 0 D ep th (m ) D ep th (m ) 0 200 400 0 200 400
STF SAF PF SAccF Sbdy
Fig. 3 (a, b) Profiles of and Si(OH)4in the upper 500 m along the Bonus Goodhope Cruise track (taken from LeMoigne et al., 2011). It shows increasing surface nutrient concentrations with increasing latitude. Frontal positions are indicated by the white vertical dotted lines.
819
Figure 3 c, d (cont.). Profiles of chlorophyll-a and phaeopigments in the upper 200 m of the water column along the Bonus-Goodhope cruise
820
track (Taken from Beker et al, 2011). Elevated pigment concentrations were observed in equatorward of the Subtropical Front. Frontal positions
821
are indicated by the white vertical dotted lines.
822 D ep th (m ) STZ SAZ PFZ AZ D ep th (m ) 0 50 100 150 200 0 50 100 150 200 0.6 0.4 0.2 0 0.6 0.6 0.4 0.2 0.0
STF SAF PF SAccF Sbdy
Fig. 3 (c, d) Profiles of chlorophyll-a and phaeopigments in the
up-per 200 m of the water column along the Bonus-Goodhope cruise track (Taken from Beker et al., 2011). Elevated pigment concen-trations were observed in equatorward of the Subtropical Front. Frontal positions are indicated by the white vertical dotted lines.
3.3 Chlorophyll-a
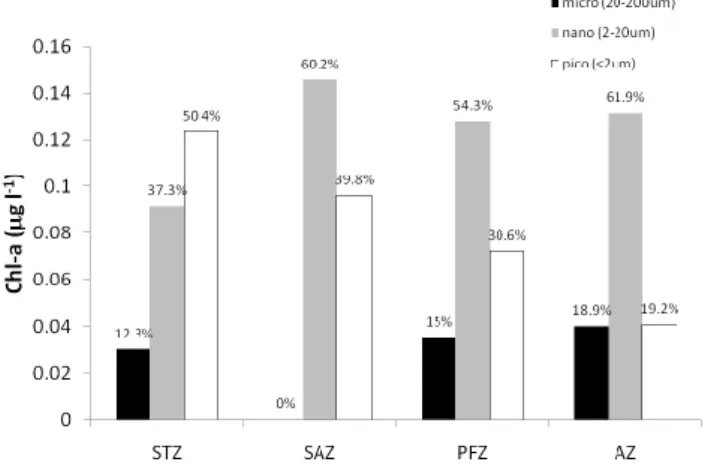
In the STZ, euphotic zone chl-a concentrations were high-est, exceeding 0.4 µg l−1with a sub-surface chl-a maximum (>0.5 µg l−1) at 30–40 m (Fig. 3c See also Beker et al., 2011). A similar sub-surface maximum was observed for phaeopigments, although slightly deeper in the water column at 40–60 m (Fig. 3d). Size-fractionated chl-a showed that pi-cophytoplankton (<2 µm) contributed 50.4 % to total chl-a (Fig. 4b). In the SAZ, chl-a concentrations in the surface
∼40 m exceeded 0.4 µg l−1(Fig. 3c), whereas a sub-surface maximum in phaeopigments (>0.3 µg l−1) was observed at
∼50 m (Fig. 3d). Size-fractionated chl-a indicated that nano-(2–20 µm) and picophytoplankton contributed 60.2 % and 39.8 % respectively to total chl-a concentrations, while no
823
Figure 3 e, f. (cont.) Profiles of Particulate Organic Carbon (POC) and Particulate Organic Nitrogen (PON) in the upper 200 m of the water 824
column along the Bonus Goodhope cruise track. Highest concentrations were observed equatorward of the Sub-Antarctic Front. Frontal positions 825
are indicated by the white vertical dotted lines. 826 0 50 100 150 200 0 50 100 150 200 D ep th (m ) D ep th (m ) 15 12.5 10 7.5 5 2.5 0 2 1.5 1 0.5 0 STZ SAZ PFZ AZ
STF SAF PF SAccF Sbdy
Fig. 3 (e, f) Profiles of Particulate Organic Carbon (POC) and
Par-ticulate Organic Nitrogen (PON) in the upper 200 m of the wa-ter column along the Bonus Goodhope cruise track. Highest con-centrations were observed equatorward of the Sub-Antarctic Front. Frontal positions are indicated by the white vertical dotted lines.
microplankton (20–200 µm) were measured (Fig. 4) in the SAZ. In the PFZ, chl-a concentrations of ∼0.3 µg l−1were found in the upper 70 m, (Fig. 3c). Phaeopigments typi-cally exceeded 0.1 µg l−1in the upper 50 m of the water col-umn, and remained <0.1 µg l−1 below this depth (Fig. 3d). Size-fractionated chl-a in surface samples was dominated by nanophytoplankton (54.3 %) throughout this region (Fig. 4), followed by picophytoplankton (30.6 %) and microphyto-plankton (15 %). Chl-a concentrations in the AZ between the PF and the SAccF, as well as south of the SBdy, ranged from 0.2 to 0.3 µg l−1, while a band of low chl-a (<0.2 µg l−1)
was evident between the SAccF and the SBdy (Fig. 3c). Phaeopigments appeared completely absent in this region (Fig. 3d). In the AZ, nanoplankton comprised 61.9 % of the phytoplankton community, while micro and picoplank-ton comprised 18.9 and 19.2 % respectively (Fig. 4). 3.4 POC and PON
Maximum concentrations of POC (14.1 µmol l−1)and PON (1.9 µmol l−1)were found in the STZ just north of the STF (Fig. 3e, f) and confined to the upper 25 m. Average PON concentrations over the euphotic layer of the STZ were 1.0 ± 0.6 µmol l−1, with a mean euphotic zone C:N ratio of 7.16±2.29. In the SAZ, POC and PON concentrations in the surface 40 m reached a maximum of 7.7 and 1.5 µmol l−1
re-spectively (Fig. 3e, f, modified from Beker et al., 2011), with a mean euphotic zone C:N ratio of 6.0±0.7. In the PFZ, POC and PON averaged 5.3 ± 0.5 µmol l−1and 0.7 ± 0.2 µmol l−1 respectively in the upper 60 m of the water column (Fig. 3e, f), with both decreasing below this depth. The average C:N ratio in the euphotic zone was 8.2 ± 1.7. In the AZ, POC and PON were typically <4 µmol l−1and <0.5 µmol l−1 respec-tively (Fig. 3e, f) in the euphotic zone, with a mean C:N ratio of 7.4 ± 2.7.
2952 W. R. Joubert et al.: Nitrogen uptake by phytoplankton in the Atlantic sector
Table 2. List of data at each sampling station (including latitude positions) during the BGH cruise (MLD; m, sample depth; m, chl-a, µg l−1; POC and PON, µmol l−1; nutrients, µmol l−1; ρN, nmol l−1d−1). The five sample depths at each station represent, with increasing depth, the 100 %, 50 %, 25 %, 10 % and 1 % light depths. nd indicates no data.
Station MLD Depth Chl-a POC PON NO3 NH4 Urea ρNO3 ρNH4 ρUrea f
STZ L1 42 1.0 0.05 5.36 0.94 <0.05 0.06 0.22 14.4 12.7 10.7 0.38 (34.4◦S) 5.0 0.05 8.13 0.68 <0.05 0.05 0.33 9.5 26.0 30.5 0.14 9.1 0.06 1.80 0.25 <0.05 0.01 0.11 13.9 29.0 20.0 0.22 35.0 0.11 4.78 0.82 <0.05 0.02 0.33 21.2 34.5 49.8 0.20 80.9 0.47 3.36 0.46 3.24 0.01 0.33 4.9 2.7 61.7 0.07 S1 10 1.0 0.14 4.36 0.59 <0.05 0.02 0.86 5.5 17.4 245.1 0.02 (36.5◦S) 7.3 0.16 4.50 0.62 <0.05 0.01 0.76 20.1 18.4 280.2 0.06 14.0 0.17 4.56 0.64 <0.05 0.06 0.32 17.8 20.3 133.5 0.10 40.2 0.20 5.42 0.71 <0.05 0.10 0.86 18.2 16.3 347.5 0.05 53.6 0.37 7.06 0.99 <0.05 0.17 0.76 5.0 4.9 264.7 0.02 L2 17 1.0 0.49 12.26 1.93 2.01 0.08 1.51 1.4 32.0 330.5 0.00 (41.2◦S) 3.3 0.54 12.26 1.93 2.01 0.08 0.65 37.5 37.7 169.0 0.15 7.8 0.55 12.27 1.77 2.50 0.10 1.08 53.2 42.8 294.2 0.14 15.3 0.56 14.12 1.88 3.86 0.03 0.76 56.6 17.6 105.0 0.32 35.4 0.40 6.07 0.90 3.99 0.51 0.65 7.0 5.9 41.6 0.13 SAZ S2 75 1.0 0.35 7.70 1.30 11.04 0.09 1.26 41.0 15.9 50.0 0.38 (42.5◦S) 5.0 0.35 7.24 1.48 10.80 0.09 2.11 157.2 30.1 197.2 0.41 9.6 0.35 7.68 1.15 10.80 0.09 0.84 96.7 21.8 57.6 0.55 21.9 0.34 7.48 1.30 10.80 0.09 1.37 132.2 25.9 105.1 0.50 50.6 0.38 5.78 0.89 6.03 0.09 1.26 54.7 1.8 46.7 0.53 PFZ L3 47 1.0 0.25 4.78 0.78 17.79 0.31 0.71 30.7 23.4 26.4 0.38 (44.9◦S) 10.0 0.25 4.57 0.64 nd nd 1.29 nd nd 50.7 nd 20.2 0.25 4.78 0.68 nd 0.31 0.82 nd 25.8 34.0 nd 40.0 0.26 4.65 0.78 nd nd 0.59 nd nd 35.6 nd 60.9 0.25 4.57 0.64 17.67 0.31 nd 56.8 5.1 nd 0.92 L4 81 1.0 0.40 6.97 0.78 18.68 0.67 1.37 17.6 6.3 36.0 0.29 (46.0◦S) 10.6 0.40 6.67 0.80 18.68 0.67 0.91 33.1 22.0 18.2 0.45 18.9 0.40 6.51 0.88 18.44 0.68 0.91 53.4 29.4 44.1 0.42 20.3 0.40 5.63 0.75 18.44 0.68 1.03 45.6 35.7 15.3 0.47 48.9 0.40 6.04 0.78 18.92 0.69 1.94 43.0 26.7 8.0 0.55 S3 84 1.0 0.36 6.04 0.86 21.12 0.60 0.24 124.0 39.6 13.0 0.70 (47.6◦S) 5.0 0.36 6.04 0.86 21.12 0.60 0.85 72.0 24.6 16.9 0.63 9.5 0.36 5.89 0.88 20.88 0.60 0.85 40.2 21.0 14.0 0.53 19.7 0.36 5.58 0.74 21.12 0.60 1.58 28.3 48.1 106.8 0.15 60.1 0.36 5.56 0.80 20.88 0.62 3.27 22.2 8.4 108.5 0.16 L5 97 1.0 0.26 5.17 0.47 20.93 0.73 0.39 37.1 8.2 5.6 0.73 (49.0◦S) 3.9 0.26 5.17 0.47 20.93 0.73 0.39 20.6 9.3 3.0 0.63 10.1 0.26 5.49 0.53 20.93 0.73 2.06 21.0 14.4 13.2 0.43 13.9 0.28 5.19 0.47 20.93 0.73 1.42 39.1 18.8 15.3 0.53 60.4 0.25 5.16 0.60 20.93 0.73 0.77 15.5 15.3 10.5 0.38 L6 78 1.0 0.31 5.37 0.54 22.80 1.26 nd 14.6 4.3 nd 0.77 (50.4◦S) 5.7 0.31 5.37 0.54 22.80 1.26 1.58 18.1 6.2 20.1 0.41 9.4 0.30 9.04 0.74 22.80 1.25 1.33 22.9 7.4 28.3 0.39 15.2 0.30 5.23 0.47 22.80 1.26 1.94 23.5 11.5 48.4 0.28 78.5 0.30 3.43 0.31 24.51 1.89 1.33 13.6 5.5 13.3 0.42 AZ S4 107 1.00 0.16 2.67 0.50 nd 0.80 2.00 nd 11.0 24.7 nd (51.8◦S) 1.90 0.16 2.67 0.50 25.71 0.80 2.00 28.8 11.6 16.9 0.50 13.50 0.17 2.72 0.50 25.71 0.79 2.19 20.9 8.5 12.5 0.50 23.60 0.16 2.98 0.50 25.71 0.80 1.62 19.7 9.2 16.8 0.43 88.30 0.16 2.60 0.40 25.96 0.79 1.43 10.8 7.1 8.7 0.41 L7 69 1.0 0.25 5.37 0.54 28.08 0.46 0.83 28.0 14.4 11.0 0.52 (55.6◦S) 5.3 0.25 9.04 0.74 28.08 0.46 0.41 51.1 13.0 8.0 0.71 13.5 0.24 5.23 0.47 28.08 0.43 1.33 42.3 15.0 19.4 0.55 25.1 0.27 5.39 0.52 28.08 0.43 1.94 53.3 3.7 41.5 0.54 109.9 0.28 2.05 0.19 29.76 0.31 1.33 45.4 14.3 18.4 0.58 S5 90 1.0 0.33 4.48 0.76 27.81 0.61 1.68 47.5 20.0 29.3 0.49 (57.6◦S) 3.2 0.33 4.48 0.76 27.81 0.61 1.29 41.2 23.8 29.3 0.44 8.5 0.33 4.63 1.03 27.81 0.61 2.06 45.2 27.6 43.4 0.39 28.8 0.30 4.06 0.69 28.06 0.63 3.10 33.3 19.5 73.0 0.26 90.0 0.21 3.55 0.68 28.06 0.62 1.16 36.1 22.8 21.1 0.45
827
Figure 4. Size fractionated chl-a of surface samples in each region along the BGH cruise
828
track. Bars indicate microphytoplankton (20 – 200 µm) given in black, nanophytoplankton (2
829
– 20 µm in grey and picophytoplankton (< 2 µm) in the white. Percentage of the total is
830
presented at the top of each bar. It shows the decreasing contribution of picophytoplankton
831
from north to south along the cruise track. Latitudes for the different zones are STZ (34 –
832
42.2oS), SAZ (42.2 – 44.2oS), PFZ (42.2 – 50.1oS) and the AZ (50.1 – 57.5oS).
833 834 835 836 837 838 839 840 841 842 843
Fig. 4. Size fractionated chl-a of surface samples in each region
along the BGH cruise track. Bars indicate microphytoplankton (20– 200 µm) given in black, nanophytoplankton (2–20 µm in grey and picophytoplankton (<2 µm) in the white. Percentage of the total is presented at the top of each bar. It shows the decreasing contribution of picophytoplankton from north to south along the cruise track. Latitudes for the different zones are STZ (34–42.2◦S), SAZ (42.2– 44.2◦S), PFZ (42.2–50.1◦S) and the AZ (50.1–57.5◦S).
3.5 Nitrogen uptake
In the STZ (n = 3), ρurea dominated ∫ρN by ∼80 % (Ta-ble 3), reaching a maximum rate of 347 nmol l−1d−1 at 40 m at station S1 (Table 2). ρurea was on average 8 times greater than ρNO−3 or ρNH−4 yielding a mean f -ratio of 0.24 ± 0.22 (Table 3). Specific uptake of urea (Vurea)was
on average 10 times greater than that of nitrate (VNO3) or
ammonium (VNH4) (Fig. 5). In the SAZ (n = 1) ρNO
− 3
and ρurea reached maximum rates at 5 m of 157.3 and 197.2 nmol l−1d−1respectively (Table 2). These values de-creased to 54.7 and 46.4 nmol l−1d−1respectively at the 1 % euphotic depth. ∫ρN was 10.3 mmol m−2d−1, with the high-est contribution from ∫ρNO−3 (49.4 %) followed closely by
∫ρurea (43 %) (Table 3). The depth-integrated f -ratio for this station was 0.47 (Table 3). Specific uptake rates of nitrate (VNO3)and urea (VUrea)over the euphotic zone were 0.12 ±
0.05 d−1and 0.13 ± 0.08 d−1(Fig. 5), while V
NH4 was lower
(0.02 ± 0.02 d−1). In the PFZ (n = 5), euphotic zone ρNO−3,
ρurea and ρNH−4 remained below 50 nmol l−1d−1(Table 2) and were typically lower than uptake rates in the STZ and SAZ. Station S3 exhibited the highest ρN rates, compared to adjacent stations to the north or south. At station S3,
ρNO−3 decreased from 124.0 nmol l−1d−1 in the surface to 22.2 nmol l−1d−1at the base of the euphotic zone (Table 2). Conversely, ρurea increased from 13.0 nmol l−1d−1 in the surface to 108.5 nmol l−1d−1at depth. Average ∫ρN for the
PFZ was 5.26 ± 2.2 mmol m−2d−1 (Table 2), with the
ma-jority being due to ∫ρNO−3 (1.97 ± 0.46 mmol m−2d−1)and ∫ρurea (2.13 ± 1.78 mmol m−2d−1), while ∫ρNH−4 aver-aged 1.16 ± 0.41 mmol m−2d−1, resulting in a mean f -ratio
844
845
Figure 5. Specific uptake (V, d-1) averaged over the euphotic zone for each region. It shows
846
the contribution VNO3 (black), VNH4 (grey) and VUrea (white) as % of total uptake, and a
847
decreasing trend VUrea from north to south. Latitudes for the different zones are STZ (34 –
848
42.2oS), SAZ (42.2 – 44.2oS), PFZ (42.2 – 50.1oS) and the AZ (50.1 – 57.5oS).
849 850 851 852 853 854 855 856 857 858 859 860
Fig. 5. Specific uptake (V , d−1)averaged over the euphotic zone for each region. It shows the contribution VNO3 (black), VNH4
(grey) and VUrea(white) as % of total uptake, and a decreasing trend
VUreafrom north to south. Latitudes for the different zones are STZ
(34–42.2◦S), SAZ (42.2–44.2◦S), PFZ (42.2–50.1◦S) and the AZ (50.1–57.5◦S).
of 0.41 ± 0.11 (Table 3). Average euphotic zone VNO3, VNH4
and VUrea were 0.07 ± 0.07, 0.03 ± 0.1 and 0.04 ± 0.03 d−1
respectively (Fig. 6). In the AZ (n = 3), ρNO−3, ρNH−4 and ρurea also remained below 50 nmol l−1d−1 (Table 1). Mean ∫ = ρN for the AZ was 6.46 ± 4.21 mmol m−2d−1 (Table 1), with up to 50 % being derived from ∫ρNO−3 (3.43 ± 2.68 mmol m−2d−1)(Table 3). Mean f -ratio in the AZ was 0.45 ± 0.11 (Table 3). Specific nitrogen uptake rates in the AZ were similar to those observed in the PFZ (Fig. 5).
4 Discussion
In this section we discuss nitrogen uptake dynamics across four different hydrographic regions in the Atlantic sector of the Southern Ocean. We highlight regional differences in up-take rates, f −ratios and community size structure and in-vestigate how these change in relation to MLD, temperature, nutrients and surface dissolved iron concentrations. We com-pare our data with other15N estimates of production in the Southern Ocean, as well as with 234Th based estimates of carbon export measured during the BGH cruise.
4.1 Regional comparisons of nitrogen uptake 4.1.1 The Subtropical Zone
Relatively high ∫ρN in the STZ (8.18 ± 6.8 mmol N m−2d−1) was dominated by ∫ρurea (∼79 %), with Vureabeing ten times higher than VNO3or VNH4, (Fig. 5),
indicating significant regenerated production, as reflected by low f -ratios (0.24 ± 0.22). It is however unlikely that all the urea uptake is through phytoplankton production, as urea is easily assimilated by heterotrophic bacteria (Kirchman,
2954 W. R. Joubert et al.: Nitrogen uptake by phytoplankton in the Atlantic sector
861
862
Figure 6. Comparison between 234Th carbon export (at 100 m) (grey bars) and „new 863
production‟ estimates (black triangles) in units mmol C m-2
d-1 during BGH. f-ratio is
864
indicated in brackets. New production calculated from ∫ρNO3 and the C:N ratio. It shows the 865
difference in magnitude of these proxies of carbon export. 234Th data from Planchon et al, 866
(2011). Latitudes for the different zones are STZ (34 – 42.2oS), SAZ (42.2 – 44.2oS), PFZ 867 (42.2 – 50.1oS) and the AZ (50.1 – 57.5oS). 868 869 870 871 872 873 874 875 876 877 878 879 880 STZ SAZ PFZ AZ
Fig. 6. Comparison between234Th carbon export (at 100 m) (grey bars) and “new production” estimates (black triangles) in units mmol C m−2d−1 during BGH. f -ratio is indicated in brackets. New production calculated from ∫ρNO3and the C:N ratio. It shows the difference in magnitude of these proxies of carbon export.234Th data from Planchon et al. (2011). Latitudes for the different zones are STZ (34–42.2◦S), SAZ (42.2–44.2◦S), PFZ (42.2–50.1◦S) and the AZ (50.1–57.5◦S).
2000) which can contribute up to 25 % of nitrogen uptake (Fouilland et al., 2007). Low new production rates in this region are likely due to limiting surface NO3concentrations
(<0.05 µmol l−1). Phytoplankton community structure was consistent with a typically regenerated-based community (Tremblay et al., 2000) with picophytoplankton dominating by ∼51 % (Fig. 4). This is consistent with previous results of low f -ratios in the Indian (f = 0.07 ± 0.03) (Thomalla et al., 2011) and Pacific basins (Sambrotto and Mace, 2000) (Table 2). These results imply that this region of the Southern Ocean is dominated by urea re-cycling within the microbial loop, with little carbon export, little atmospheric CO2 “draw-down”, and conservation of nitrogen in surface
waters (LeFevre et al., 1998; Smetacek et al., 2004). 4.1.2 The Subantarctic Zone
Station S2 in the SAZ exhibited only slightly higher total
∫ρN rates compared to those observed in the STZ, however this station showed a greater contribution of ρNO−3 (49.4 %), which increased the f -ratio from 0.24 to 0.49 (Table 3).
VNO3(0.12 d
−1)at this station was double that found in other
regions (Fig. 5) along with the highest concentrations of
chl-a(>0.5 µg l−1), POC (>7 µmol l−1)and PON (>1 µmol l−1)
(Fig. 3c, e, f). Specific uptake rates are known to pro-vide information on the potential for macronutrient, light or iron limited growth, with higher values being characteristic of faster growth rates in nutrient and light replete environ-ments. These high VNO3 values thus suggest possible
allevi-ation of iron stress (Lucas et al., 2007), along with sufficient light availability (MLD = 45.2 ± 17.1). It has been shown for oligotrophic regions that new production is enhanced within mesoscale eddy activity through the vertical injection of nu-trients into the euphotic layer (Strass et al., 2002;
Green-wood, 2007; Levy et al., 2009). This station was on the edge of a mesoscale hydrographic feature, “anticyclone M” (Arhan et al., 2011), observed just north of the SAF (Fig. 2). The proposed mechanism for the enhanced production and higher f -ratios at this station is enhanced vertical nutrient in-jection (including iron) at the edges of the anticyclone (Levy et al., 2009) along with an improved light environment asso-ciated with persistent shallow and stable mixed layers associ-ated with the warm core eddy (Llido et al., 2005). Mesoscale eddies such as these provide important areas for local but significant POC export and biological CO2 draw-down in
an overall HNLC Southern Ocean. ∫ρN rates in the SAZ of the Atlantic measured in this study (10.3 mmol m−2d−1)
were slightly higher than those measured in the Australian sector in late spring/early summer (4.4 ± 0.3 mmol m−2d−1)
(Savoye et al., 2004) and were comparable to the Indian sec-tor in late summer (12.7 ± 7.9 mmol m−2d−1)observations
(Thomalla et al., 2011) (Table 3). 4.1.3 The Polar Front Zone
Total ∫ρN rates in the PFZ were the lowest of the four re-gions (Table 3), with low f -ratios of 0.41±0.11. ∫ρurea and
Vureawere substantially lower than in the STZ and SAZ to the
north (Fig. 5). High concentrations of ammonium and urea (Table 2) were observed in the PFZ indicating very active regeneration processes. Dilution of the isotopic15NH+4 and
15N-urea uptake due to high regenerated nutrients released
by bacteria and zooplankton grazers can potentially lead to an underestimation of the uptake rates of these substrates and consequently an overestimation of the f -ratio. Early work in the Scotia Sea showed that ammonium uptake can be under-estimated by a factor of 2–3 in summer (Glibert et al., 1982). Although no NH+4 regeneration experiments were conducted during the cruise, one can expect that underestimation of regenerated uptake would further reduce the f -ratio’s pre-sented here. Although our cruise was in late austral sum-mer, deep mixed layers in this region (MLD = 68.7 ± 18.9 m) relative to the 1 % light depths (61 ± 11 m) make light a po-tentially limiting factor to primary production and to NO−3 uptake in particular considering its high light demand in comparison to NH+4 and urea uptake (Lucas et al., 2007; Cochlan, 2008). In addition, low surface Fe concentrations
<0.2 nmol l−1(Chever et al., 2010) likely limit new produc-tion (Timmermans et al., 1998) promoting the dominance of small cells as size confers a competitive advantage for nu-trients at low concentrations (Leynart et al., 2004). Smaller cells are however more susceptible to grazing by microzoo-plankton (Raven, 1986), which controls their biomass and at the same time contributes to potential regenerated production through NH+4 excretion (Glibert and Garside, 1992). Size-fractionated chlorophyll concentrations showed the PFZ to be dominated by nanophytoplankton (54 %, Fig. 4).
Several authors have found an increase in diatom con-centration to be associated with the PF and attribute this
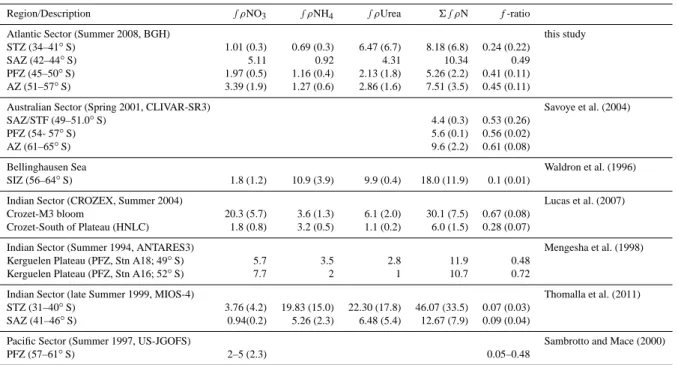
Table 3. Comparison of depth integrated values of15N uptake (mmol m−2d−1)by phytoplankton in various regions of the Southern Ocean.
Region/Description ∫ρNO3 ∫ρNH4 ∫ρUrea 6 ∫ρN f-ratio
Atlantic Sector (Summer 2008, BGH) this study
STZ (34–41◦S) 1.01 (0.3) 0.69 (0.3) 6.47 (6.7) 8.18 (6.8) 0.24 (0.22)
SAZ (42–44◦S) 5.11 0.92 4.31 10.34 0.49
PFZ (45–50◦S) 1.97 (0.5) 1.16 (0.4) 2.13 (1.8) 5.26 (2.2) 0.41 (0.11) AZ (51–57◦S) 3.39 (1.9) 1.27 (0.6) 2.86 (1.6) 7.51 (3.5) 0.45 (0.11)
Australian Sector (Spring 2001, CLIVAR-SR3) Savoye et al. (2004)
SAZ/STF (49–51.0◦S) 4.4 (0.3) 0.53 (0.26)
PFZ (54- 57◦S) 5.6 (0.1) 0.56 (0.02)
AZ (61–65◦S) 9.6 (2.2) 0.61 (0.08)
Bellinghausen Sea Waldron et al. (1996)
SIZ (56–64◦S) 1.8 (1.2) 10.9 (3.9) 9.9 (0.4) 18.0 (11.9) 0.1 (0.01)
Indian Sector (CROZEX, Summer 2004) Lucas et al. (2007)
Crozet-M3 bloom 20.3 (5.7) 3.6 (1.3) 6.1 (2.0) 30.1 (7.5) 0.67 (0.08) Crozet-South of Plateau (HNLC) 1.8 (0.8) 3.2 (0.5) 1.1 (0.2) 6.0 (1.5) 0.28 (0.07)
Indian Sector (Summer 1994, ANTARES3) Mengesha et al. (1998)
Kerguelen Plateau (PFZ, Stn A18; 49◦S) 5.7 3.5 2.8 11.9 0.48
Kerguelen Plateau (PFZ, Stn A16; 52◦S) 7.7 2 1 10.7 0.72
Indian Sector (late Summer 1999, MIOS-4) Thomalla et al. (2011)
STZ (31–40◦S) 3.76 (4.2) 19.83 (15.0) 22.30 (17.8) 46.07 (33.5) 0.07 (0.03) SAZ (41–46◦S) 0.94(0.2) 5.26 (2.3) 6.48 (5.4) 12.67 (7.9) 0.09 (0.04)
Pacific Sector (Summer 1997, US-JGOFS) Sambrotto and Mace (2000)
PFZ (57–61◦S) 2–5 (2.3) 0.05–0.48
to an increase in Si(OH)4 (Laubscher et al., 1993;
Bath-mann et al., 1997; Smetacek et al., 1997; Tremblay et al., 2002). Although it is possible for diatoms to fall within the nanophytoplankton size range, substantial increases in Si(OH)4 were only found south of the SACCF (Fig. 3b).
Thus, although the percentage of microphytoplankton in-creased from 0 % in the SAZ to 15 % in the PFZ, the con-tinued dominance by nanophytoplankton (54 %) was likely due to Si(OH)4 limitation of diatom growth and low
sur-face Fe concentrations (<0.2 nmol l−1, Chever et al. 2010) favouring smaller cells. Similarly, low Si(OH)4
concentra-tions have been shown to play an important role in regulating nitrate uptake (Dugdale and Wilkerson, 1998; Sambrotto and Mace, 2000) such that the low Si(OH)4concentrations in this
region may have contributed to the low NO−3 uptake rates (1.97 mmol m−2d−1)and f -ratios found here. Our ∫ρN
rates in the Atlantic PFZ (5.26 mmol m−2d−1)were similar to those in the Australian sector (5.6 mmol m−2d−1)and the HNLC Crozet sector (6 mmol m−2d−1), but lower than the bloom region associated with naturally Fe fertilized Crozet (30.1 mmol m−2d−1) and Kerguelen (11.9 mmol m−2d−1)
Islands (Table 3). High concentrations of regenerated nutri-ents, low f -ratios and nanophytoplankton dominated com-munities implies an inefficient biological pump for this re-gion which appears to be controlled by nutrient (Fe and Si(OH)4)and light co-limitation and microzooplankton
graz-ing.
4.1.4 The Antarctic Zone
A slight increase in ∫ρN was observed in the AZ (7.5 mmol m−2d−1)relative to the PFZ (5.3 mmol m−2d−1). The contribution of ∫ρNO−3 to total ∫ρN increased with a si-multaneous increase in f -ratios to 0.45 indicating a slightly higher potential for carbon export. As with the SAZ, high ambient regenerated nutrient concentrations (Table 2) im-ply active regeneration processes occurring in the surface, however a decrease regenerated uptake rates, particularly urea uptake (Fig. 5) were observed relative to regions fur-ther north. An underestimation of the regenerated produc-tion in this region, could thus lead to an overestimate of the
f-ratio. Although Si(OH)4concentrations increase south of
the SACCF (Fig. 3b), lowest chlorophyll concentrations are found in the region between the SACCF and the SBdy and it is only south of the Sbdy that chlorophyll concentrations increase (Fig. 3c). Although the mixed layer tends to deepen (MLD = 93.9 ± 14.7 m) in the AZ, so too does the 0.1 % light depth (96 ± 12 m), making inadequate light the unlikely pri-mary contributor to limited production. More likely, low sur-face Fe concentrations (Chever et al., 2010) characteristic of the late summer season are limiting phytoplankton growth despite sufficient irradiance (see also Boyd et al., 2001; Lu-cas et al., 2007). ∫ρN from this study (7.5 mmol m−2d−1)
was in a similar range to the ∫ρN (9.6 mmol m−2d−1) of the permanently open AZ in the Australian sector (Savoye et al., 2004). As expected however, these open ocean ∫ρN rates are up to 60 % lower than those observed during bloom
2956 W. R. Joubert et al.: Nitrogen uptake by phytoplankton in the Atlantic sector conditions in the Seasonal Ice Zone (SIZ) of the
Belling-hausen Sea (18.0 ± 11.9 mmol m−2d−1)(Table 3). Lower
open ocean ∫ρN rates compared to the SIZ can be ascribed to the lack of dissolved iron inputs from melting ice (Sed-wick and DiTullio, 1997; Gao et al., 2003; Grotti et al., 2005) and a less favourable light environment through deep mixed layer depths (93.9 ± 14.7 m) (Smith and Nelson, 1986). Al-though there is a slight increase in production and f -ratios in the AZ, relative to the PFZ, the ice free regions of this sec-tor appear to have a relatively low potential for carbon export particularly in the late summer season due predominantly to Fe limitation.
4.2 15N estimates and234Th export flux
Carbon export derived from234Th deficits at 100 m revealed
a north-south gradient, with the highest export fluxes (up to 6 mmol C m−2 d−1)found south of the APF (Fig. 6,
Plan-chon et al., 2011). Although the latitudinal trend in f -ratio estimates of carbon export were not as clear, with high ex-port being associated with the eddy in the SAZ, there was a similar tendency for carbon export to increase with latitude (Fig. 6). New production estimates of carbon export were however 2–20 times greater in magnitude (Fig. 6) than234Th derived estimates. Reasons for this are numerous. Firstly, the two methods used to estimate carbon export are not intended to measure the same process. Although the rates are expected to be comparable in a steady state system or when averaged over large enough time and space scales, there is otherwise no a priori reason why the rates should be identical, bearing in mind f -ratio estimates of new production is potentially overestimated as the f -ratio is only estimated from ρNO−3. Stable isotope incubations measure NO−3 uptake at a discrete site over 12–24 h in the euphotic layer (typically <60 m) and may therefore not be representative of mesoscale averages.
234Th deficit derived estimates of carbon export (at 100 m)
on the other hand encompass large spatial scales of 10 s to 100 s of kilometres (Buesseler et al., 1992) and a time period of ∼31 days. Hence, in this instance234Th derived carbon fluxes more than likely represents a considerable averaging of episodically lower fluxes when compared to the short-term
15N incubations. Furthermore,234Th carbon flux estimates
are derived by considering the POC/234Th ratio of particles
>50 µm and may well ignore a significant export flux within the <50 µm fraction. During BGH however, the POC/234Th ratios of particles >50 µm and <50 µm were not very differ-ent. New production estimates, on the other hand do not dis-criminate on a size basis and represents the potential export of both dissolved and particulate material. This is consistent with other observations in both the Indian (Mengesha et al., 1998) and Pacific sector (Savoye et al., 2004) of the Southern Ocean and highlights the important role of this ocean in the global carbon cycle.
5 Conclusions
This paper presents15N-labelled nitrogen uptake measure-ments in the Atlantic Southern Ocean in late austral summer, 2008. ρN in the oligotrophic STZ was dominated by ρurea, resulting in low f -ratios (f = 0.24). Size fractionated
chl-adata is dominated by picophytoplankton (>50 %) and also indicative of a community based on regenerated phytoplank-ton production. It is unlikely that the measured NH−4 and urea uptake rates reflect only regenerated production in the STZ, given that the uptake estimates based on15N uptake does not account for heterotrophic bacterial activity. This probably results in an overestimation of urea uptake and un-derestimation of the f -ratio in the STZ. However, given the low concentrations of NO−3 in the surface waters of the STZ (<0.05 µmol l−1)and the dominance of urea recycling within
the microbial loop, with little carbon export. The greatest
∫ρN was observed in the SAZ and ascribed to enhanced nu-trient supply and favourable light conditions associated with an anticyclonic eddy. Higher f -ratios were observed in the SAZ (f = 0.49), Polar Frontal Zone (PFZ, f = 0.41) and Antarctic zone (AZ, f = 0.45 ) relative to the STZ (f = 0.24) and indicate a higher contribution of ρNO−3 relative to to-tal ρN and higher export potential in regions further south. New production estimates of carbon export (calculated from
ρNO−3 and the C:N ratio) were lowest in the STZ (7.3 ± 0.43 mmol C m−2d−1), compared to 30.4 mmol C m−2d−1 in the SAZ, 16.3 ± 1.03 mmol C m−2d−1 in the PFZ and
28.2 ± 25.8 mmol C m−2 d−1 in the AZ. These carbon
ex-port estimates are comparable to observations carried out in the other sectors of the Southern Ocean (Waldron et al., 1995; Sambrotto and Mace, 2000; Savoye et al., 2004; Lu-cas et al., 2007). Increasing trends in ambient water column nutrient and surface iron concentrations corresponded with higher ∫ρNO−3 rates. Higher f -ratios south of the SAF re-flects this, however, we suspect this to be an overestimation of the f -ratio given the elevated regenerated nutrient concen-trations which indicate active regeneration processes assum-ing regeneration of nitrate in the euphotic layer. The rela-tively low total ρN rates are ascribed to late summer season sampling when nutrients are depleted prior to the winter re-supply. Comparison of our f -ratio based estimates of car-bon export with those from234Th data collected during the cruise revealed a similar tendency for carbon export to in-crease with latitude but no clear correlation was observed. In addition, new production estimates were 2–20 times greater in magnitude and likely the result of the different integration time scales for the two different methods.
Acknowledgements. We thank the captain, officers and the crew
of the R/V Marion Dufresne for their invaluable assistance in completing the BGH survey. We acknowledge Frank Dehairs and Anne-Julie Cavagna for providing the unpublished 234Th data collected during the cruise. We also thank Annick Masson, Audrey Guenneugues for providing the macronutrient, chl-a and POC data. This work was supported by the Institut National des
Sciences de L’Univers of the Centre National de la Recherche Scientifique, the French Polar Institute (Institut Polaire Emile Victor), the French Research Institute for Exploitation of the Sea, the National Agency for Research Funding (ANR), and the University of Brest/IUEM. This work was also funded through the Southern Ocean Carbon – Climate Observatory (SOCCO) programme and the CSIR Parliamentary Grant. S. J. Thomalla was supported through a SOCCO post doctoral fellowship funded by ACCESS and NRF/SANAP.
Edited by: F. Dehairs
References
Arhan, M., Speich, S., Messager, C., Dencausse, G., Fine, R. A., and Boye, M.: Anticyclonic and cyclonic eddies of subtropical origin in the subantarctic zone south of Africa, J. Geophys. Res., in press, doi:10.1029/2011JC007140, 2011.
Arrigo, K. R.: 2005. Marine microorganisms and global nutrient cycles, Nature, 437, 349–355, doi:10.1038/nature04158, 2005. Arrigo, K. R., Van Dijken, G. L., and Bushinsky, S.: Primary
pro-duction in the Southern Ocean, 1997–2006, J. Geophys. Res., 113, C08004, doi:10.1029/2007JC004551, 2008.
Baar, H. J. W. de Boyd, P. W., Coale, K. H., Landry, M. R., At-suhsi, T., Assmy, P., Bakker, D. C. E., Bozec, Y., Barber, R. T., Brzezinski, M. A., Buesseler, K. O., Boy´e, M., Croot, P. L., Ger-vais, F., Gorbunov, M. Y., Harrison, P. J., Hiscock, W. T., Laan, P., Lancelot, C., Law, C., Levasseur, M., Marchetti, A., Millero, F. J., Nishioka, J., Nojiri, Y., Oijen, T. van, Riebesell, U., Ri-jkenberg, M. J. A., Saito, H., Takeda, S., Timmermans, K. R., Veldhuis, M. J. W., Waite, A., and Wong, C. S.: Synthesis of Iron Fertilization Experiments: From the Iron Age in the Age of Enlightenment, in: The Oceans in a High-CO2World, edited
by: Orr, J. C., Pantoja, S., and P¨ortner, H.-O., special issue of J. Geophys. Res. Ocean., 110, 1–24, 2005.
Banse, K.: Low seasonality of low concentrations of surface chloro-phyll in the Subantarctic water ring: underwater irradiance, iron and grazing, Prog. Oceanogr., 37, 241–291, 1996.
Bathmann, U. V., Scharek, R., Klaas, C., Dubischar, C. D., and Smetacek, V.: Spring development of phytoplankton biomass and composition in major water masses of the Atlantic sector of the Southern Ocean, Deep-Sea Res. Pt. II, 44, 51–67, 1997. Behrenfeld, M. J.: Abandoning Sverdrups’s critical depth
hypothe-sis on phytoplankton blooms, Ecology, 91, 997–989, 2010. Beker B., Boye, M., Ras, J., Gelay, A., and Claustre, H.:
Distribu-tion patterns of taxonomy and pigments during the austral sum-mer in the southeastern Atlantic and the Southern Ocean south of South Africa, Biogeosciences Discuss., in prep, 2011. Bianchi, M., Feliatra, F., Treguer, P., Vincendeau, M.-A., and
Mor-van, J.: Nitrification rates, ammonium nitrate distribution in up-per layers of the water column and in sediments of the Indian sector of the Southern Ocean. Deep-Sea Res. Pt. II, 44, 1017– 1032, 1996.
Blain, S., Treguer, P., Belviso, S., Bucciarelli, E., Denis, M., Desabre, S., Fiala, M., Jezequel, V. M., Lefevre, J., Mayzaud, P., Marty, J.-C., and Razouls, S.: A biogeochemical study of the island mass effect in context of the iron hypothesis: Kerguelen Island, Southern Ocean, Deep-Sea Res. Pt. I, 48, 163–187, 2011.
Boyd, P. W.: The role of iron in the biogeochemistry of the South-ern Ocean and equatorial Pacific: a comparison of in situ iron enrichments, Deep-Sea Res. Pt. II, 49, 1803–1821, 2002. Boyd, P. W., Crossley, A. C., DiTullio, G. R., Griffiths, F. B.,
Hutchins, D. A., Queguiner, B., Sedwick, P. N., and Trull, T. N.: 2001. Control of phytoplankton growth by iron supply and irradiance in the Subantarctic Ocean: Experimental results from the SAZ Project, J. Geophys. Res. 106, 31573–31583, 2001. Boyd, P. W., Jickells, T., Law, C. S., Blain, S., Boyle, E. A.,
Buesseler, K. O., Coale, K. H., Cullen, J. J., de Baar, H. J. W., Follows, M., Harvey, M., Lancelot, C., Levasseur, M., Owens, N. P. J., Pollard, R., Rivkin, R. B., Sarmiento, J., Schoe-mann, V., Smetacek, V., Takeda, S., Tsuda, A., Tumer, S., and Watson, A. J.: Mesoscale iron enrichment experiments 1993– 2005: Synthesis and future directions, Science, 315, 612–617, doi:10.1126/science.1131669, 2007.
Buesseler, K. O., Bacon, M. P., Cochran, J. K., and Livingston, H. D.: Carbon and nitrogen export during the JGOFS North At-lantic Bloom Experiment estimated from 234Th:238U disequi-libria, Deep-Sea Res. Pt. I, 39, 1115–1137, 1992.
Buesseler, K.O ., Benitez-Nelson, C. R., Moran, S. B., Burd, A., Charette, M., Cochran, J. K., Coppola, L., Fisher, N. S., Fowler, S. W., Gardner, W. D., Guo, L. D., Gustafsson, O., Lamborg, C., Masque, P., Miquel, J. C., Passow, U., Santschi, P. H., Savoye, N., Stewart, G., and Trull, T.: An assessment of particulateor-ganic carbon to thorium-234 ratios in the ocean and their impact on the application of 234Th as a POC flux proxy, Mar. Chem., 100, 213–233, 2006.
Caldeira, K. and Duffy, P. B.: The role of the Southern Ocean in up-take and storage of anthropogenic carbon dioxide, Science, 297, 620–622, 2000.
Chever, F., Bucciarelli, E., Sarthou, G., Speich, S., Arhan, M., Pen-ven, P., and Tagliabue, A.: Physical speciation of iron in the Atlantic sector of the Southern Ocean, along transect from sub-tropical domain to the Weddell Sea Gyre, J. Geophys. Res., 115, C10059, doi:10.1029/2009JC005880, 2010.
Chisholm, S. W. and Morel, F. M. M. M.: What controls phyto-plankton production in nutrient-rich areas of the open sea?, Lim-nol. Oceanogr., 36, U1507–U1511, 1991.
Clark, D., Rees, A. P., and Joint, I. R.: Ammonium regeneration and nitrification rates in the oligotrophic Atlantic Ocean: im-plications for new production estimates, Limnol. Oceanogr., 53, 52–62, 2008.
Cochlan, W. P.: Nitrogen uptake in the Southern Ocean, in: Ni-trogen in the Marine Environment, edited by: Capone, D. G., Bronk, D. A., Mulholland, M., and Carpenter, E., Elsevier Press, 561–588, 2008.
Coale, K. H. and Bruland, K. W.:234Th:238Ur disequilibria within the California Current, Limnol. Oceanogr., 30, 22–33, 1985. Comiso, J. C., McClain, C. R., Sullivan C. W., Ryan, J. P., and
Leonard, C. L.: Coastal Zone Color Scanner pigment concentra-tion in the Southern Ocean and relaconcentra-tionship to geophysical sur-face features, J. Geophys. Res., 98, 2419–2451, 1993.
Cullen, J. J.: On models of growth and photosynthesis in phyto-plankton. Deep-Sea Res., 3, 667–683, 1990.
de Boyer Monte’gut, C., Madec, G., Fischer, A. S., Lazar, A., and Iudicone, D.: Mixed layer depth over the globalocean: An exam-ination of profile data and a profile-based climatology, J. Geo-phys. Res., 109, C12003, doi:10.1029/2004JC002378, 2004.
2958 W. R. Joubert et al.: Nitrogen uptake by phytoplankton in the Atlantic sector
Dugdale, R. C. and Goering, J. J.: Uptake of new and regenerated forms of nitrogen in primary production, Limnol. Oceanogr., 12, 196–206, 1967.
Dugdale, R. C. and Wilkerson, F. P.: The use of15N to measure ni-trogen uptake in eutrophic oceans; experimental considerations, Limnol. Oceanogr., 31, 673–689, 1986.
Dugdale, R. C. and Wilkerson, F. P.: Low specific nitrate uptake rate – a common feature of high-nutrient, low-chlorophyll marine ecosystems, Limnol. Oceanogr., 36, 1678–1688, 1991.
Eppley, R. W. and Peterson, B. J.: Particulate organic matter flux and planktonic new production in the deep ocean, Nature, 282, 677–680, 1979.
Fouilland, E., Gosselin, M., Rivkin, R. B., Vasseur, C., and Mosta-jir, B.: Nitrogen uptake by heterotrophic bacteria and phyto-plankton in Arctic surface waters, J. Plankton. Res., 29, 369–376, 2007.
Froneman, P. W., Perissinotto, R., and McQuaid, C. D.: Seasonal variation in microzooplankton grazing in the region of the Sub-tropical Convergence, Mar. Biol., 126, 433–442, 1996.
Gao, Y., Fan, S., and Sarmiento, J. L.: Aeolian iron input to the ocean through precipitation scavenging: A modeling perspec-tive and its implication for natural iron fertilization in the ocean, J. Geophys. Res., 108, 4221, doi:200310.1029/2002JD002420, 2003.
Glibert, P. M. and Garside, C.: Diel variability in nitrogenous nu-trient uptake by phytoplankton in the Chesapeake Bay plume, J. Plankton. Res., 14, 271–288, 1992.
Glibert, P. M., Biggs, D. C., and McCarthy, J. J.: Utilization of ammonium and nitrate during austral summer in the Scotia Sea, Deep-Sea Res., 29, 837–850, 1982.
Goeyens, L., Semeneh, M., Baumann, E. M., Elskens, M., Shopova, D., and Dehairs, F.: Phytoplankton nutrient utilization and nutri-ent signature in the Southern Ocean, J. Mar. Sys., 17, 143–157, 1998.
Grasshoff, K., Ehrhardt, M., and Kremling, K.: Methods of seawa-ter analysis, Verlag Chemi Weinheim, New York, 1983. Greenwood, J. E., Feng, M., and Waite, A. M.: A one-dimensional
simulation of biological production in two contrasting mesoscale eddies in the south eastern Indian Ocean, Deep-Sea Res. Pt. II, 54, 1029–1044, 2007.
Grotti, M., Francesco, S., Carmela, I., and Roberto, F.: Trace met-als distributions in coastal sea ice of Terra Nova Bay, Ross Sea, Antarctica, Antarct, Science, 17, 290–300, 2005.
Kirchman, D. L.: Uptake and regeneration of inorganic nutrients by marine heterotrophic bacteria, in: Microbial Ecology of the Oceans, edited by: Kirchman, D. L., John Wiley and Sons, New York, 261–288, 2000.
Korb, R. E. and Whitehouse, M.: Contrasting primary production regimes around South Georgia: large bloom vs high nutrient low chlorophyll waters. Deep-Sea Res. Pt. I, 51, 721–738, 2004. Laubscher, R. K., Perissinotto, R., and McQuaid, C. D.:
Phyto-plankton production and biomass at frontal zones in the Atlantic sector of the Southern Ocean, Polar Biol., 13, 471–481, 1993. Le F`evre, J., Legendre, L., and Rivkin, R. B.: Fluxes of biogenic
carbon in the Southern Ocean: Roles of large microphagous zoo-plankton, J. Mar. Sys., 17, 325–345, 1998.
Le Moigne, F. A. C., Boye, M., Masson, A., Corvaisier, R., Grosst-effan, E., Gu´eneugues, A., Pondaven, P., and Nelson, D.: Bio-geochemical features of the subtropical southeastern Atlantic and
the Southern Ocean south off South Africa during the austral summer of the International Polar Year, Biogeosciences Discuss., in prep, 2011.
Levy, M., Klein, P., and Jelloul, M. B.: New production stimulated by high-frequency winds in a turbulent mesoscale eddy field, Geophys. Res. Lett., 36, L16603, doi:10.1029/2009GL039490, 2009.
Leynaert, A., Bucciarelli, E., Claquin, P., Dugdale, R. C., Martin-J´ez´equel, V., Pondaven, P., and Ragueneau, O.: Effect of iron deficiency on diatom cell size and silicic acid uptake kinetics, Limnol. Oceanogr., 49, 1134–1143, 2004.
Llido, J., Garcon, V., Lutjeharms, J. R. E., and Sudre, J.: Event-scale blooms drive enhanced primary productivity at the Subtropical Convergence. Geophys. Res. Lett., 32, L15611, doi:10.1029/2005GL022880, 2005.
Lucas, M. I., Seeyave, S., Sanders, S., Moore, M. C., Williamson, R., and Stinchcombe, M.: Nitrogen uptake response to a nat-urally Fe fertilised phytoplankton bloom during the 2004/2005 CROZEX study, Deep-Sea Res. Pt. II, 54, 2138–2173, 2007. Martin, J.: Glacial-interglacial CO2change: the iron hypothesis,
Paleoceanography, 5, 1–3, 1990.
Mengesha, S., Dehairs, F., Fiala, M., Elskens, M., and Goeyens, L.: Seasonal variation of phytoplankton community structure and ni-trogen uptake regime in the Indian Sector of the Southern Ocean, Polar Biol., 20, 259–272, 1998.
Metzl, N., Tilbrook, B., and Poisson, A.: The annual f CO2cycle and the air-sea CO2flux in the sub-Antarctic Ocean, Tellus B,
51, 849–861 1999.
Moore, J. K. and Abbott, M. R.: Surface chlorophyll concentrations in relation to the Antarctic Polar Front: seasonal and spatial pat-terns from satellite observations, J. Mar. Sys., 37, 69–86, 2002. Moore, C. M., Hickman, A. E., Poulton, A. J., Seeyave, S., and
Lucas, M. I.: Iron-light interactions during the CROZet natural iron bloom and EXport experiment (CROZEX): II – Taxonomic responses and elemental stoichiometry. Deep-Sea Res. Pt. II, 54, 2066–2084, 2007.
Orsi, A. H., Whitworth, T., and Nowlin, W. D.: On the meridional extent and fronts of the Antarctic Circumpolar Current, Deep-Sea Res., 42, 641–673, 1995.
Planchon, F., Cavagna, A. J., and Dehairs, F.: Dynamics of biogenic particles in the Southern Atlantic Ocean as revealed by234Th proxy along the Bonus-Good-Hope transect from Cape Basin to Northern Weddell gyre, Biogeosciences Dicuss., in prep, 2011. Pollard, R. T., Lucas, M. I., and Read, J. F.: Physical controls on
biogeochemical zonation in the Southern Ocean, Deep-Sea Res. Pt. II, 49, 3289–3305, 2002.
Price, N. M., Ahner, B. A., and Morel, F. M. M.: The equatorial Pa-cific Ocean: Grazer-controlled phytoplankton in an iron-limited ecosystem, Limnol. Oceanogr., 39, 520–534, 1994.
Raven, J. A.: Physicological consequences of extremely small size for autotrophic organisms in the sea, Can. Bull. Fish. Aquat. Sci., 214, 1–70, 1986.
Raven, J. A.: The iron and molybdenum use efficiencies of plant growth with different energy, carbon and nitrogen sources, New Phytol., 109, 279–288, 1988.
Savoye, N., Dehairs, F., Elskens, M., Cardinal, D., Kopczynska, E. E., Trull, T. W., Wright, S., Baeyens, W., and Griffiths, F. B.: Regional variation of spring N-uptake and new produc-tion in the Southern Ocean, Geophys. Res. Lett., 31, L03301,