Publisher’s version / Version de l'éditeur: Technical Report, 2011-02-01
READ THESE TERMS AND CONDITIONS CAREFULLY BEFORE USING THIS WEBSITE. https://nrc-publications.canada.ca/eng/copyright
Vous avez des questions? Nous pouvons vous aider. Pour communiquer directement avec un auteur, consultez la
première page de la revue dans laquelle son article a été publié afin de trouver ses coordonnées. Si vous n’arrivez pas à les repérer, communiquez avec nous à PublicationsArchive-ArchivesPublications@nrc-cnrc.gc.ca.
Questions? Contact the NRC Publications Archive team at
PublicationsArchive-ArchivesPublications@nrc-cnrc.gc.ca. If you wish to email the authors directly, please see the first page of the publication for their contact information.
NRC Publications Archive
Archives des publications du CNRC
For the publisher’s version, please access the DOI link below./ Pour consulter la version de l’éditeur, utilisez le lien DOI ci-dessous.
https://doi.org/10.4224/18263104
Access and use of this website and the material on it are subject to the Terms and Conditions set forth at
The Effect of Water Leakage on Human Thermoregulatory Response in Varying Weather States
Power, J.; Simões Ré, A.; Tipton, M.
https://publications-cnrc.canada.ca/fra/droits
L’accès à ce site Web et l’utilisation de son contenu sont assujettis aux conditions présentées dans le site LISEZ CES CONDITIONS ATTENTIVEMENT AVANT D’UTILISER CE SITE WEB.
NRC Publications Record / Notice d'Archives des publications de CNRC:
https://nrc-publications.canada.ca/eng/view/object/?id=02fe2712-b867-4e1d-8685-88c3b93985a9 https://publications-cnrc.canada.ca/fra/voir/objet/?id=02fe2712-b867-4e1d-8685-88c3b93985a9
National Research Council Canada Institute for Ocean Technology Conseil national de recherches Canada Institut des technologies oc ´eaniques
TR-2011-03
Technical Report
The Effect of Water Leakage on Human Thermoregulatory
Response in Varing Weather States
Power, J.; Simões Ré, A.; Tipton, M.,
February 2011
Power, J.; Simões Ré, A.; Tipton, M., 2011. The Effect of Water Leakage on Human Thermoregulatory Response in Varing Weather States. St. John's, NL : NRC Institute for Ocean Technology. Technical Report, TR-2011-03.
REPORT NUMBER
TR-2011-03
NRC REPORT NUMBER DATE
February 2011
REPORT SECURITY CLASSIFICATION
Unclassified
DISTRIBUTION
Unlimited
TITLE
THE EFFECT OF WATER LEAKAGE ON HUMAN THERMO REGULATORY RESPONSES IN VARYING WEATHER STATES
AUTHOR(S)
J. Power1, A. Simões Ré1, and M. Tipton2
CORPORATE AUTHOR(S)/PERFORMING AGENCY(S) 1
National Research Council of Canada – Institute for Ocean Technology, Canada
2University of Portsmouth, United Kingdom PUBLICATION
SPONSORING AGENCY(S)
Transport Canada
Program for Energy Research and Development
IOT PROJECT NUMBER
42_2264_16
NRC FILE NUMBER KEY WORDS
Immersion suit, immersion, deep body temperature, heat flow, skin temperature, water leakage, wind, waves. PAGES viii, 26 FIGS. 21 TABLES 5 SUMMARY
The thermal responses of volunteers, with 500mL of water underneath their immersion suits, were measured in conditions consisting of varying wind speeds, and wave heights. Twelve healthy males performed three, three hour immersions in Calm Water, Weather 1 (wind speed = 3.5 m·s-1, max wave height = 0.34m), and Weather 2 (wind speed = 4.6 m·s-1, max wave height = 0.64m) in a commercially available immersion suit. The two weather conditions produced a significantly greater increase in heat flow compared to Calm. There was no significance difference in heat flow between the two weather conditions. There was no significant difference in deep body temperature or MBT across all immersion conditions. There were no significant differences in metabolic heat production across all immersion conditions. Compared to previous work when the participants were dry underneath their immersion suits, heat flow and metabolic heat production were significantly greater with 500mL of water in the suit. It is recommended that future testing of humans in immersion suits incorporate the increased heat loss due to wind and waves, and the effort to ensure people stay dry inside of them to continue.
ADDRESS National Research Council
Institute for Ocean Technology Arctic Avenue, P. O. Box 12093 St. John's, NL A1B 3T5
National Research Council Conseil national de recherches Canada Canada Institute for Ocean Institut des technologies
Technology océaniques
THE EFFECT OF WATER LEAKAGE ON HUMAN THERMO
REGULATORY RESPONSES IN VARYING WEATHER STATES
TR-2011-03
J. Power, A. Simões Ré, and M. Tipton
TR-2011-03 iii
ACKNOWLEDGEMENTS
The research team would like to thank Transport Canada and the Program for Energy Research and Development for the continued financial support and interest in this work.
We would also like to thank all the exceptionally talented staff at NRC-IOT who were involved in this project for their hard work and effort. The project would never have been completed if it were not for their creative, insightful input and dedicated support.
Last, but certainly not least, we would like to extend a very big thank you to all the participants who volunteered for this study. All the participants were a pleasure to work with thanks to the positive, accommodating attitude they had during the experiment.
TR-2011-03 iv
TABLE OF CONTENTS
ACKNOWLEDGEMENTS... III LIST OF FIGURES ... VI LIST OF TABLES... VII GLOSSARY ...VIII 1.0 INTRODUCTION...1 1.1 Experiment Hypotheses...2 2.0 TEST SETUP ...2 2.1 Environmental Conditions...5 3.0 PARTICIPANTS...5 3.1 Immersion Suits...6 3.2 External Bladders ...6 4.0 INSTRUMENTATION ...7
4.1 Heat Flow Sensors...7
4.2 Gastrointestinal pills...9
4.3 Heart Rate Monitor...10
4.4 Metabolic Measurements ...10
4.5 Body Composition Measurements ...11
5.0 PROCEDURE ...12
5.1 Calculations ...14
5.1.1. Mean Skin Temperature and Mean Body Temperature ...14
5.1.2 Mean Skin Heat Flow...15
5.1.3 Metabolic Rate...15
5.1.4 Statistical Analyses...15
6.0 RESULTS ...15
6.1 Water leakage ...15
6.2 Mean Skin Temperature Change...16
6.3 Mean Gastro-intestinal Change ...16
6.4 Mean Body Temperature Change ...18
6.5 Mean Skin Heat Flow...19
6.6 Mean Metabolic Rate ...20
TR-2011-03 v
6.8 Mean Metabolic Rate – Dry vs. Wet...22
7.0 DISCUSSION ...23
8.0 RECOMMENDATIONS...25
TR-2011-03 vi
LIST OF FIGURES
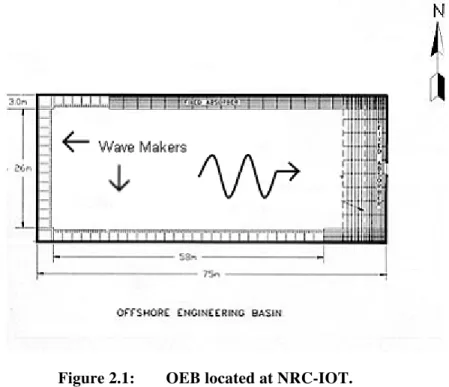
Figure 2.1: OEB located at NRC-IOT...3
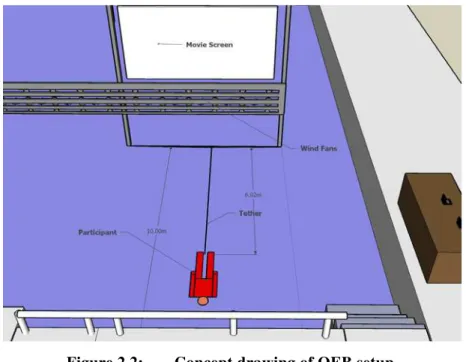
Figure 2.2: Concept drawing of OEB setup. ...4
Figure 2.3: Actual test setup...4
Figure 3.1: White’s Marine Abandonment Suit. ...6
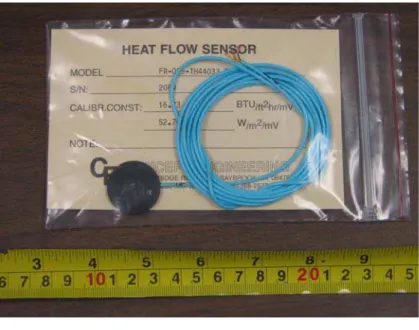
Figure 4.1: Heat flow sensor. ...7
Figure 4.2: Self contained data loggers connected to heat flow sensors (second logger is magnetically attached behind logger “Skin Temp A2” pictured in photo.) ...8
Figure 4.3: Logger package in the vest worn by a participant. ...8
Figure 4.4: CorTemp Ingestible Sensor pill. ...9
Figure 4.5: CorTemp Data Recorder...9
Figure 4.6: Polar Heart Rate monitor. ...10
Figure 4.7: Cardio Coach CO2...10
Figure 4.8: Tanita Body Composition Analyzer. ...11
Figure 4.9: Beta Technology Skin Fold Callipers...12
Figure 5.1: Heat flow sensor placement...13
Figure 6.1: Change in mean skin temperature over the course of the 3 hour immersions (Mean [SD]. n=10.). ...16
Figure 6.2: Mean change in TGI over the course of the 3 hour immersions. (Mean [SD]. n=8)...17
Figure 6.3: Mean change in mean body temperature over the course of the 3 hour immersions. (Mean [SD]. n=8) ...18
Figure 6.4: Mean skin heat flow at the end of the 3 hour immersions. (Mean [SD]. ** = P < 0.001. n = 10)...19
Figure 6.5 Mean metabolic rates during the last 30 minutes of the 3 hour immersions (Mean [SD]. n = 10). ...20
Figure 6.6: MSHF during the last 5 minutes of the 3 hour immersions for both wet and dry conditions. (Mean [SD]. ** = P < 0.001 . n = 12 “Dry”. n = 10 for “Wet”.) ...21
Figure 6.7: Mean metabolic rates during the last 30 minutes of the 3 hour immersions for both wet and dry conditions. (Mean ± SD. ** = P < 0.001. n = 12 “Dry”. n = 10 for “Wet”)...22
TR-2011-03 vii
LIST OF TABLES
Table 2.1: Environmental characteristics of each immersion condition...5
Table 3.1: Participant anthropometric data ...6
Table 4.1: Measurements acquired from the participants during the immersions...11
Table 5.1 Skin temperature and heat flow measurement site weighting values (4). ...14
Table 6.1: MSHF and M for 3 hour immersions in varying weather conditions for both dry (8) and wet conditions. (** = P < 0.001)...22
TR-2011-03 viii
GLOSSARY NRC National Research Council of Canada IOT Institute for Ocean Technology OEB Offshore Engineering Basin TC Transport Canada
PERD Program for Energy Research and Development REB Research Ethics Board
PFD Personal Flotation Device CSR Cold Shock Response LSA Life Saving Appliances
JONSWAP Joint North Sea Wave Analysis Project SD Standard Deviation
MST Mean Skin Temperature MBT Mean Body Temperature MSHF Mean Skin Heat Flow
TR-2011-03 1
THE EFFECT OF WATER LEAKAGE ON HUMAN THERMOREGULATORY RESPONSES IN VARYING WEATHER STATES
1.0 INTRODUCTION
A large number of individuals work or travel over cold water every day. Immersion in cold water represents a significant risk to those both at leisure and work in Arctic, and Sub Arctic waters. If an unprotected human is suddenly immersed in cold water, a series of physiological responses termed the “Cold Shock Response” (CSR) occur that are responsible for the majority of drowning deaths in cold water within the first few minutes of immersion (10). Even in
unprotected individuals, hypothermia (a drop in deep body temperature of 2ºC or more) does not usually occur before 30 minutes of immersion (6).
Life Saving Appliances (LSA), such as Personal Flotation Devices (PFD), liferafts and lifeboats, are required on any sea-faring vessel in order to improve the survival chances of those on board; the best approach to protecting people from the cold water is to keep them out of it. In an
emergency situation however, there is always a chance that the people will be immersed. In these situations, immersion suits can greatly increase the chance of a person being able to avoid the CSR, and prolong their survival time.
Current Transport Canada (TC) regulations require immersion suits to be carried on board all class 9 ships and higher, in a sufficient quantity for every person. Offshore oil installations follow a similar policy. The immersion suits are usually a one-piece suit system that provides thermal protection and buoyancy to the wearer (13).
The Canadian General Standards Board (CGSB) requires that immersion suits be tested for material strength, flame resistance and thermal protective properties. The thermal protective properties can be tested using either thermal manikins or human participants. For human participant tests (13), a rectal thermometer measures deep body temperature; the skin
temperatures of the index finger and large toe are also measured. The participant is immersed in calm, circulating water with a temperature between 0-2ºC for up to 6 hours. The test is
terminated if the participant’s deep body temperature drops 2ºC lower than baseline conditions, if the finger or toe skin temperature drops below 5ºC, or if the attending physician determines the participant should not continue.
A knowledge gap currently exists between the calm testing conditions used to determine thermal responses in immersion suits, and a real world scenario where an immersed person could
experience high wind speeds and waves. The results of previous work investigating the effects of rough weather conditions on human thermal responses reported that cooling rates of people increase in rough weather compared to calm water conditions in uninsulated immersion suits (2, 11). However other work has not supported these results (5,9). The discrepancies could be attributed to the tests being conducted in the external environment where the conditions across participants are inconsistent; or the studies were conducted in laboratories that could not recreate the rough environments often experienced in marine accidents.
TR-2011-03 2
The contradiction in the literature over the effects of wind and waves on the thermal responses during immersion provided the rationale for our earlier experimentation. Our previous work examined the effects of four separate environmental conditions on human thermal responses (7). Volunteers performed four separate, one hour immersions in the following conditions: calm water, wind only, waves only, and wind + waves. This work showed that the wind + wave immersion condition resulted in a ~37% increase in heat flow compared to calm conditions (7). Mean Body Temperature (MBT) was also significantly decreased in the wind + wave condition compared to calm (7).
In a subsequent experiment, we examined the effect of varying weather conditions (consisting of both wind and waves) on human thermal responses during three-hour immersions (8). Similar to our earlier findings, the conditions including wind and waves produced a significantly greater amount of heat flow compared to calm water. There was no significant difference in the amount of heat flow between the two weather conditions, even though one had larger wave heights and higher wind speeds than the other. The change in deep body temperature and oxygen
consumption of the participants were not significantly different across all the immersion
conditions. It was possible that it was subtle changes in peripheral blood flow and metabolic rate that enabled the participants to thermoregulate, resulting in the insignificant differences in the changes of deep body temperature across the immersion conditions. A change in either the water temperature, or immersed clothing insulation value, may have resulted in an increase in heat loss that could not be compensated for by the thermoregulatory responses of the participants.
The current study investigated the effects of adding 500mL of water beneath the immersion suits on participants’ thermoregulatory responses. Previous work by Tipton and Balmi has shown that 500mL of water sprayed over the torso to simulate water leakage can reduce system insulation by as much as 30% due in this case, to wetting of the clothing worn beneath the uninsulated immersion suit (12). By adding 500mL of water to the participant’s suits in the current experiment, we believed that this would increase the heat loss to the level where the thermoregulatory responses of the participants may not be able to compensate. 1.1 Experiment Hypotheses.
1. With 500mL of water added beneath an insulated immersion suit, heat flow will be significantly greater in weather conditions with the largest wave heights and greatest wind speeds compared to milder conditions, and calm conditions.
2. With 500mL of water added beneath the suit, conditions with higher wind speeds and wave heights will cause a significantly greater decrease in deep body temperature compared to conditions with lower wind speeds and wave heights during 3 hour immersions.
2.0 TEST SETUP
All experimental trials were conducted in the Offshore Engineering Basin (OEB), located at the National Research Council of Canada’s Institute for Ocean Technology (NRC-IOT), in St. John’s, Newfoundland, Canada. The OEB is a large basin of water measuring 65m long, 26m
TR-2011-03 3
wide, with a water depth of 2.8m. On the West and South sides of the OEB are hydraulically powered wave makers (168 in total), with passive wave absorbers fitted on the East and North sides of the tank. The waves ran uni-directional from the west bank of wave makers, and travelled east.
Figure 2.1: OEB located at NRC-IOT.
For the current round of experimental trials, the setup of the OEB was altered to allow for a suitable, safe testing area for the participants as well as the installation of a bank of 11 analog controlled wind fans.
A scaffolding system ran approximately 10m south from the north side of the OEB and
terminated onto a 4m by 4m platform. At the beginning of the scaffolding system, a set of stairs was attached to allow the participants to walk from the scaffolding into the water with little physical exertion. Prior to entering the water, a loop of Taigon tubing was secured around the participant’s feet. The Taigon tubing was attached to a tether by a break away clip that was controlled by the participants. The tether was connected to a pulley system that allowed the research team to manoeuvre the participants into the correct test location (6m east of the wind fans), with no physical effort required by the volunteers. A safety line connected to the stairway was secured to the buddy line of the participant’s immersion suit.
TR-2011-03 4
Figure 2.2: Concept drawing of OEB setup.
TR-2011-03 5
2.1 Environmental Conditions
Table 2.1 provides the wind speeds, maximum wave heights, water temperature, and air temperature of each immersion condition. A single irregular, 20-minute JONSWAP wave
spectrum was used throughout the test program. The spectrum was generated from data collected from a wave buoy deployed on the Southwest edge of the Grand Banks off the east coast of Newfoundland, Canada. Once the spectrum was generated, the portion that contained waves of a maximum height of 0.67m and lower was used for the test program. The reason for this was two-fold: the first was to use a portion of the spectrum that contained waves that the OEB
wavemakers were capable of generating; the second was that once the wave period reaches a certain value, the wave length is long enough that the human participant experiences the wave as a swell, and simply becomes a particle riding on the surface of the water.
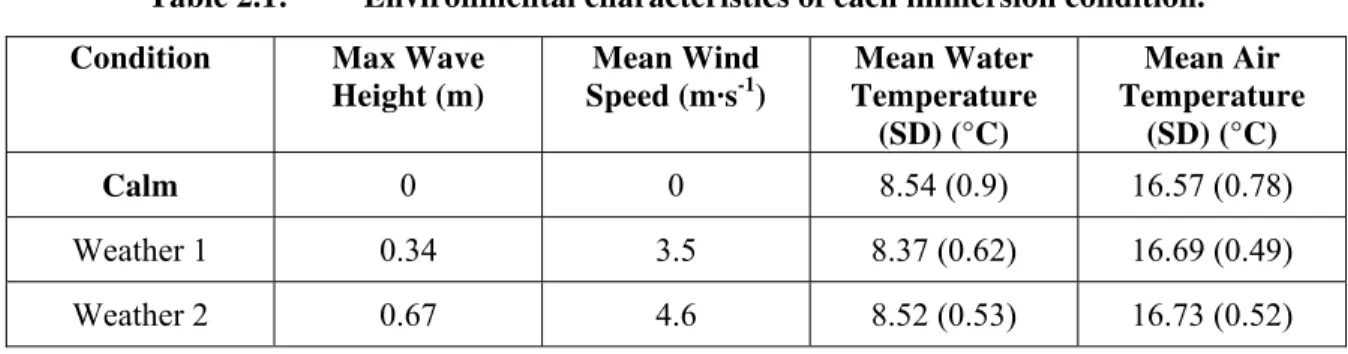
Table 2.1: Environmental characteristics of each immersion condition.
Condition Max Wave
Height (m) Mean Wind Speed (m·s-1) Mean Water Temperature (SD) (°C) Mean Air Temperature (SD) (°C) Calm 0 0 8.54 (0.9) 16.57 (0.78) Weather 1 0.34 3.5 8.37 (0.62) 16.69 (0.49) Weather 2 0.67 4.6 8.52 (0.53) 16.73 (0.52)
In order to reduce the risk of injury to the participant from physical contact with equipment, the wind field was calibrated prior to any human immersions. An anemometer was placed in the location where the participant would be during the trial (6m east of the wind machines), with a second mounted on the underside of the scaffolding section directly behind the participant’s location. The wind field was calibrated with the two anemometers in place, and then the participant’s location anemometer was removed for all the immersions. The same drive signal voltage that provided the correct wind speeds for each condition was used throughout the immersions; with the wind speeds verified by the second anemometer.
The OEB does not contain a refrigeration system and has no active way to maintain a set water temperature. In order to maintain a water temperature below 15°C (current TC criteria for cold water), the OEB was periodically drained and refilled with water from the local municipal drinking source. This was effective in maintaining a temperature of ~8°C throughout the test program.
3.0 PARTICIPANTS
A required sample size of 11 participants was determined using a power calculation (95% confidence interval, σ = 0.5, β = 0.3), however 12 healthy individuals volunteered for the study. All participants gave their written informed consent to participate, and NRC’s Research Ethics Board (REB) approved the protocol (REB#: 2009-67). Before starting any of the experimental
TR-2011-03 6
trials, the participants underwent a medical screening by a certified doctor to determine if they were physically fit to participate. Table 3.1 provides the anthropometric data of the participants:
Table 3.1: Participant anthropometric data
n = 12 Age Height (cm) Weight (kg) Body Fat % Surface
Area (m2)
Mean 25.6 181.0 82.7 18.8 2.0
SD 5.6 4.7 10.2 3.1 0.2
3.1 Immersion Suits
White’s Marine Abandonment Suit was selected for use during this round of experiments, pictured in Figure 3.1.
Figure 3.1: White’s Marine Abandonment Suit.
3.2 External Bladders
In order to allow the participants to urinate throughout the 3 hour immersion, an external bladder was attached to them. The external bladder consisted of a condom catheter, a urine collection bag, and the absorbent powder from the Travel John disposable urinal (Reach Global Industries, Irvine, CA, USA) in the bag. The external bladder was worn by the participants underneath their clothing, and allowed them to urinate throughout the immersion.
TR-2011-03 7
4.0 INSTRUMENTATION 4.1 Heat Flow Sensors
Heat flow sensors manufactured by Concept Engineering (Old Saybrook, CT, USA) were used to measure both heat flow and skin temperature at 12 different sites on the body based on the Hardy and DuBois weighting formula (4), with a slight modification as no measurements were taken from the hand. The sites used were: the right foot; left shin; right calve; right quadriceps; left hamstring; left abdominal; right lower back; left scapula; right pectoral; underside of the right forearm; top of left forearm; and the forehead.
Figure 4.1: Heat flow sensor.
The heat flow sensors were connected to self contained data loggers manufactured by ACR data systems (Surrey, BC, Canada). Two separate types of ACR data loggers were used: a logger that could measure the heat flow, and a second that was able to measure skin temperature. The loggers were self-contained and the data collected during the immersion was stored and downloaded immediately after the trial was completed. Heat flow and skin temperature were measured once every 8 seconds.
TR-2011-03 8
Figure 4.2: Self contained data loggers connected to heat flow sensors (second logger is
magnetically attached behind logger “Skin Temp A2” pictured in photo.)
The logger and heat flow sensor system were protected from mechanical stress during the immersion by being attached to a plastic guard by Velcro, and then sealed inside a splash-proof bag. The logger packages were then placed inside a vest worn by the participants over their test clothing, seen in Figure 4.3.
TR-2011-03 9
4.2 Gastrointestinal pills
Gastro-intestinal temperature (TGI) was measured using CorTemp Ingestible Sensor pills
manufactured by HQ Inc (Palmetto, FL, USA). The pills measure 22.4mm long with a diameter of 10.9mm, and contain a temperature sensor.
Figure 4.4: CorTemp Ingestible Sensor pill.
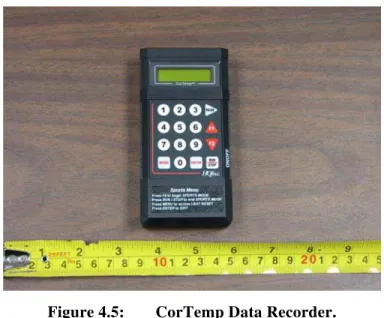
The pills transmitted the readings wirelessly to the CorTemp Data Recorder (also manufactured by HQ Inc.) that was housed inside the vest worn by the participants. This was the same vest that contained the data loggers packages.
Figure 4.5: CorTemp Data Recorder.
In turn, the data recorder stored the measurements from the pills and transmitted the values wirelessly in real time to a base station computer. This allowed the research team to monitor the TGI of the participants to ensure that no one experienced a drop of more than 2°C. TGI was
TR-2011-03 10
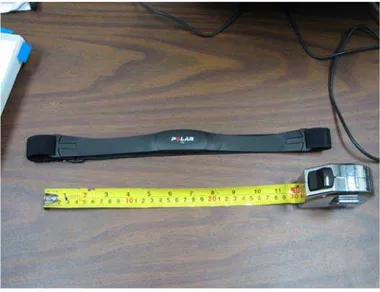
4.3 Heart Rate Monitor
Heart rate was measured using a Polar Heart Rate monitor manufactured by Polar Inc. (Lake Success, NY, USA). The heart rate monitor consists of a band worn around the chest, with conducting gel applied to the back of the band.
Figure 4.6: Polar Heart Rate monitor.
The polar heart rate monitor measured the heart rates of the participants and was recorded wirelessly by the CorTemp Data Recorder. The CorTemp Data Recorder then transmitted the heart rate data wirelessly, in real time, to a shore-based computer where the research team could monitor it. The heart rate was measured and recorded once every 20 seconds.
4.4 Metabolic Measurements
V·E , V·O2 , and V·CO2 measurements were made every 15 seconds using a Cardio Coach CO2,
manufactured by KORR Medical Technologies (Salt Lake City, UT, USA.) Participants wore disposable latex face masks that allowed their exhaled gases to travel through a ~12m tube to the Cardio Coach CO2 located on the shore.
TR-2011-03 11
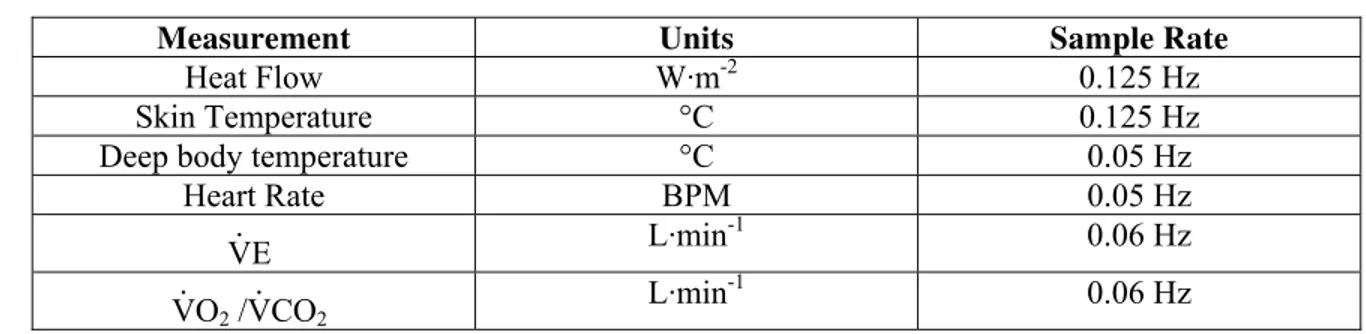
Table 4.1 summarizes the different measuring devices, respective sample rates, and units of measure.
Table 4.1: Measurements acquired from the participants during the immersions.
Measurement Units Sample Rate
Heat Flow W·m-2 0.125 Hz
Skin Temperature °C 0.125 Hz
Deep body temperature °C 0.05 Hz
Heart Rate BPM 0.05 Hz
V·E L·min
-1 0.06 Hz
V·O2 /V·CO2 L·min
-1 0.06 Hz
4.5 Body Composition Measurements
Participant’s body fat percentage was measured using two separate methods:
Method 1: A body composition analyzer manufactured by Tanita Corporation of America Inc. (Arlington Heights, IL, USA). Before each immersion, the participants had two measurements taken using the body composition analyzer: the first measurement was using the scale with the person’s profile set to “normal”, the second with the profile set to “athlete”. Given the rather broad description of “athlete” by the manufacturer, the research team recorded both readings for body fat percentage from the analyzer.
Figure 4.8: Tanita Body Composition Analyzer.
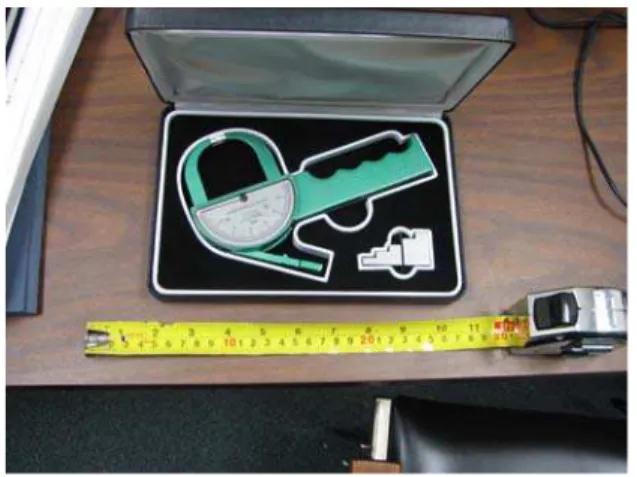
Method 2. Skinfold thickness measurements were also taken on each participant. Skin fold thickness was measured using skin fold callipers manufactured by Beta Technology (Santa Cruz, CA, USA). After the participants performed their last immersion, skin fold thickness was
TR-2011-03 12
measured at the locations according to the Durnin and Womersly (3) method for estimating body fat percentage.
Figure 4.9: Beta Technology Skin Fold Callipers.
5.0 PROCEDURE
Participants were instructed to refrain from consuming alcohol from the night before a test, and not to consume caffeine at least 3 hours before arriving at the facility. Upon arrival at the facility for their test, participants were tested to see if they still had a gastro-intestinal pill present from a previous trial. If they did not have a pill, they ingested a new one with a small amount of water at room temperature. If a pill was already present in the participant’s body, they did not consume a second and continued on with the protocol.
The participants put on a pair of swim trunks, and then attached the external bladder themselves. A research team member attached the 12 heat flow sensors to the participants in the locations illustrated in Figure 5.1:
TR-2011-03 13
Figure 5.1: Heat flow sensor placement.
Once the heat flow sensors were applied, the participants changed into a clothing ensemble based on CGSB testing standards (11). The ensemble consisted of wool socks, cotton sweat pants, cotton undershirt, swim trunks, and a long sleeved cotton shirt. The participants then proceeded to the testing area where they partially donned the White’s Marine Abandonment suit up to their waist.
Two team members sprayed 500g (500 mL) of water at room temperature onto the participants. The 500g of water was divided into two separate spray bottles, 250g in each. 250g of water was applied to the front of the torso, covering from the waist to the shoulders, and the other amount was applied to the back in a similar fashion. The long sleeved cotton shirt worn by the
participants was completely saturated after the 500g of water was applied, with any excess water run off from the clothing being caught in the partially donned immersion suit. Once wetting of the clothing was completed, the participants fully donned the immersion suit, metabolic mask, and then 5 minutes of baseline data were collected while they sat quietly on a chair. After this, the participants descended the scaffolding stairs into the water and remained submerged up to their neck for two minutes. They then exited the water, stood for one minute to allow excess water to run off, and were weighed on a M200 Digital Weight Indicator manufactured by
Western Scale Co. Limited (Port Coquitlam, B.C., Canada). After the weighing, the participant’s feet were looped through the plastic tether, and the gas sample line was connected to the
metabolic mask. The participants descended the stairs into the water, and a research team member used the rope to manoeuvre the participant into the test position. Once in position, the three hour trial began.
Upon completion of the test, the participant left the water via the stairs, and stood for one minute to allow excess water to run off. The participants were then weighed again on the same scale. This weighing method is used by the CGSB to determine water ingress into immersion suits (13).
TR-2011-03 14
Post weighing, the data were downloaded from the loggers and the participants were then de-instrumented and rewarmed in a circulating water bath filled with 40°C water. Once the
participant’s deep body temperature approached pre-immersion values, they exited the bath and changed into their street clothing. The participants were then offered hot beverages and snacks while they completed the exit questionnaire. After their well being was assured, the participants were allowed to exit the facility.
5.1 Calculations
5.1.1 Mean Skin Temperature and Mean Body Temperature
Mean Skin Temperature (MST) was calculated by weighting the measurements obtained from the 12 heat flow sensors by the values based on the work by Hardy and DuBois (4). The weighting values used in this report are given in
Table 5.1 Skin temperature and heat flow measurement site weighting values (4).
Due to the lack of the hand measurements, the final collapsed Mean Skin Temperature (MST) value was divided by 0.95. The formula used for calculating MST was:
MST(°C) = (∑ (Measurement Site * Weighting Value))/0.95
Measurement Site Weighting Value
Right Foot 0.07 Left Shin 0.065 Right Quadricep 0.095 Left Abdominal 0.0875 Right Pectoral 0.0875 Right Underarm 0.07 Forehead 0.07 Right Calve 0.065 Left Hamstring 0.095
Right Lower Back 0.0875
Left Shoulder 0.0875
TR-2011-03 15
Previous work by Burton (1) has shown that Mean Body Temperature (MBT) is a combination of both deep body temperature (TGI in the present experiment) and MST. MBT is calculated as
the following:
MBT(°C) = 64% (TGI)°C + 36% (MST)°C
The change in MBT and MST was determine by averaging the values from a 5 minute segment at the beginning of the 3 hour immersion, and then subtracting from that value the calculated MBT and MST during a 5 minute segment at the end of the 3 hour immersion.
5.1.2 Mean Skin Heat Flow
Mean Skin Heat Flow (MSHF) was calculated using the same methods described in section 5.1.1 for MST.
5.1.3 Metabolic Rate
V· O2 for each condition was calculated by averaging the values measured during last 30 minutes of the immersion. V· O2 was used to calculate the metabolic rate (M) for the participants using the following formula:
M· (W·m-2) = ((V· O2 * 21.1 *1000)/(60 * (AD)). 5.1.4 Statistical Analyses
The Shapiro Wilks test was used to test for normal distribution. A within subject, repeated measures study design was used for this experiment, and a between subject design was used when comparing the data to previous results (*). Analysis of variance (ANOVA) was performed on all collected results. Tamahrene T2 post hoc tests were performed to determine significance, with a P value of less than 0.05 considered as significant.
6.0 RESULTS
Two of the twelve participants requested to end the Weather 2 immersions after 90 minutes. The data for these two participants are not included any of the analysis. The measurements of two participant’s gastro-intestinal pills were suspect, and were not included in any analysis for deep body temperature and MBT. A retrospective power calculation was performed, and a sample size of n = 8 was sufficient for reporting results at a 95% confidence interval.
6.1 Water leakage
Participants weighed an average of 130g less after completing immersions in the Calm
conditions, 30g less after Weather 1, and 130g more after Weather 2. It is unlikely that 130g of water leaked into the suits during the Weather 2 immersions, as none of the participants reported feeling any water ingress into the suit during the tests. Since the clothing worn by the
participants was not measured before and after each immersion, we cannot confirm that no water leaked into the suit. We believe the extra 130g of water was due to excess water being trapped in the pockets created between the black neoprene and the suit itself (Figure 3.1) that was not
TR-2011-03 16
expelled completely after the three hour immersions. The larger waves in Weather 2 may have resulted in a greater amount of water entering the pocket compared to the other immersion conditions, due to periodic wave splashing over the anterior surface of the participants. 6.2 Mean Skin Temperature Change
Change in mean skin temperature is given in Figure 6.1
Figure 6.1: Change in mean skin temperature over the course of the 3 hour immersions (Mean
[SD]. n=10.).
There were no significant differences in the change in MST across all immersion conditions. MST decreased -2.76°C in Calm; -3.34°C in Weather 1; and -3.61°C in Weather 2.
6.3 Mean Gastro-intestinal Change Change in TGI is given in Figure 6.2
-5.00 -4.50 -4.00 -3.50 -3.00 -2.50 -2.00 -1.50 -1.00 -0.50 0.00
Calm Weather 1 Weather 2
Immersion Condition
TR-2011-03 17
Figure 6.2: Mean change in TGI over the course of the 3 hour immersions. (Mean [SD]. n=8).
There were no significant differences in the change in TGI across all immersion conditions. The
decrease in Calm was -0.41°C; -0.38°C in Weather 1; and -0.29°C in Weather 2. -1.0 -0.9 -0.8 -0.7 -0.6 -0.5 -0.4 -0.3 -0.2 -0.1 0.0
Calm Weather 1 Weather 2
Immersion Condition
T
GI
TR-2011-03 18
6.4 Mean Body Temperature Change
Change in mean body temperature during the 3 hour immersions is given in Figure 6.3.
Figure 6.3: Mean change in mean body temperature over the course of the 3 hour immersions.
(Mean [SD]. n=8)
There were no significant differences in the change in MBT across all immersion conditions. The decrease in Calm was –1.34°C; -1.28°C in Weather 1; and –1.49°C in Weather 2
-2.0 -1.8 -1.6 -1.4 -1.2 -1.0 -0.8 -0.6 -0.4 -0.2 0.0
Calm Weather 1 Weather 2
Immersion Condition
TR-2011-03 19
6.5 Mean Skin Heat Flow
The effects of the immersion conditions on MSHF at the end of the 3 hour immersions aregiven in Figure 6.4
Figure 6.4: Mean skin heat flow at the end of the 3 hour immersions. (Mean [SD]. ** = P <
0.001. n = 10).
Both the Weather 1 and Weather 2 conditions produced a significantly increase in MSHF
compared to the Calm condition. The Calm condition produced a MSHF of 79.45 W·m-2; 102.06 W·m-2 in Weather 1; and 107.48 W·m-2 in Weather 2. There was no significant difference in MSHF between Weather 1 and Weather 2.
0.00 20.00 40.00 60.00 80.00 100.00 120.00 140.00 160.00
Calm Weather 1 Weather 2
Immersion Condition
Heat Flow (W·m-2)
**
TR-2011-03 20
6.6 Mean Metabolic Rate
The effects of the immersion conditions on metabolic rate (M) during the last 30 minutes of the 3 hour immersions is given in Figure 6.5.
Figure 6.5 Mean metabolic rates during the last 30 minutes of the 3 hour immersions (Mean [SD].
n = 10).
There were no significant differences in metabolic rate during the last 30 minutes of the
immersions across all weather conditions. Mean metabolic rate during the last 30 minutes of the Calm water immersions was 79.66 W·m-2; 89.34 W·m-2 in Weather 1; and 93.01 W·m-2 in Weather 2. 0.00 20.00 40.00 60.00 80.00 100.00 120.00 140.00 160.00
Calm Weather 1 Weather 2
Immersion Condition
TR-2011-03 21
6.7 Mean Skin Heat Flow – Dry vs. Wet
A comparison of MSHF between the current experiment (500mL of water beneath the immersion suit) and our previous experiment (3 hour immersions in varying weather conditions in dry immersion suits (8)) is given in Figure 6.6. For the experiment with 500mL of water underneath the immersion suit (“Wet”), the water temperature was approximately 2.5°C lower; the air temperature 0.5°C higher. A different set of participants (n = 12) was used for the previous experiment (“Dry”).
Figure 6.6: MSHF during the last 5 minutes of the 3 hour immersions for both wet and dry conditions. (Mean [SD]. ** = P < 0.001 . n = 12 “Dry”. n = 10 for “Wet”.)
MSHF was significantly greater for all the Wet conditions compared to Dry. For the Dry
conditions, MSHF during the last 5 minutes of the immersions were 62.96 W·m-2 for calm; 76.75 W·m-2 for Weather 1; and 79.53 W·m-2 for Weather 2. For the Wet conditions, the MSHF during the last 5 minutes of the immersions were 79.45 W·m-2 for Calm; 102.06 W·m-2 for Weather 1, and 107.48 W·m-2 for Weather 2.
0.00 20.00 40.00 60.00 80.00 100.00 120.00 140.00 160.00
Calm Weather 1 Weather 2
Immersion Condition MS HF (W·m-2 ) Dry Wet ** ** **
TR-2011-03 22
6.8 Mean Metabolic Rate – Dry vs. Wet
Similar to Figure 6.6, a comparison of the metabolic rate between the current experiment (“Wet”) and the previous (“Dry” (8)) is given in Figure 6.7.
Figure 6.7: Mean metabolic rates during the last 30 minutes of the 3 hour immersions for both wet and dry conditions. (Mean ± SD. ** = P < 0.001. n = 12 “Dry”. n = 10 for “Wet”)
Metabolic rates were significantly greater for all the Wet conditions compared to Dry. For the Dry conditions, the mean metabolic rate during the last 30 minutes of the Calm water
immersions was 55.84 W·m-2, 57.86 W·m-2 for Weather 1, and 62.63 W·m-2 for Weather 2. For the Wet conditions, the mean metabolic rate during the last 30 minutes of the Calm water immersions was 79.66 W·m-2; 89.34 W·m-2 in Weather 1; and 93.01 W·m-2 in Weather 2.
Table 6.1: MSHF and M for 3 hour immersions in varying weather conditions for both dry (8)
and wet conditions. (** = P < 0.001).
Dry (n =12) Wet (n = 10)
Calm Weather 1 Weather 2 Calm Weather 1 Weather 2
MSHF** (W·m-2) 62.96 76.75 79.53 79.45 102.06 107.48 M** (W·m-2) 55.84 57.86 62.63 79.66 89.34 93.01 0.00 20.00 40.00 60.00 80.00 100.00 120.00 140.00 160.00
Calm Weather 1 Weather 2
Immersion Condition M (W/m^2) Dry Wet ** ** **
TR-2011-03 23
A different set of participants was used for each experiment (“Dry” and “Wet”), though the anthropometrics of each group were similar.
7.0 DISCUSSION
The results collected from the present experiment do not support the hypotheses. With 500mL of water in the suits, immersion conditions with faster wind speeds and higher wave heights did not produce a significantly greater drop in deep body temperature compared to calm conditions. While there was a significant increase in heat flow in the conditions with wind and waves compared to calm (as previous observed (8)), there was no significant difference between Weather 1 and Weather 2.
Our previous work examined the effects of wind and waves on the thermal responses of humans (7,8). The findings of the current experiment support our previous work: immersions with wind and waves will produce significantly greater increases in heat flow compared to calm water. This is in agreement with the earlier work of Ducahrme and Brooks that showed increasing wave heights produced significantly greater increases in heat flow compared to calm conditions when using uninsulated immersion suits (2). Similar to our earlier work (8), even with 500mL of water added to the suit, there was no significant difference in MSHF between Weather 1 and Weather 2, even though the latter condition had greater wind speeds and wave heights compared to the former.
MSHF and M· for immersions in varying weather conditions with the participants both dry and wet are given in Table 6.1. The water temperature was 2.5°C lower in the wet undergarments experiment, and the air temperature was 0.5°C higher. 500mL of water beneath the immersion suit resulted in a near equivalent level of MSHF in the calm condition as that experienced by a different group of dry participants in the weather conditions. This suggests that having leakage over the torso can cause a similar increase in heat flow as that caused by being immersed (dry) in wind and waves.
Even though there was a significant increase in MSHF in the two weather conditions, this did not result in a significant change in deep body temperature (Figure 6.2). The lack of a significant change in deep body temperature across immersion conditions in the present study is similar to that seen in our previous work (8), and the work by other authors. The earlier work of Hayes et al. found that wave motion did not significantly increase the rate of body cooling, compared to calm conditions, when using uninsulated immersion suits (5).
The lack of significant change in deep body temperature may have been the result of an
increased thermoregulatory response, including vasoconstriction and shivering. MST at the end of the three hour immersions was 28.07°C for Calm; 26.68°C for Weather 1; and 26.39°C for Weather 2.
Along with increased vasoconstriction, an increase in metabolic rate may have helped to prevent any significant changes in deep body temperature. However, across all immersion conditions, we measured no significant differences in metabolic rate (Figure 6.5). Compared to our previous experiment (8), the metabolic rates were significantly higher for the wet conditions than the dry
TR-2011-03 24
(Figure 6.7). MSHF was significantly greater in the wet conditions compared to the dry (Figure 6.6); however no significant changes in deep body temperature were observed in either
experiment. The increased metabolic rate of the participants helped compensate for the greater heat flow.
The current body of work is in agreement with some previous studies, but contradicts others. Previous studies (2,5) have shown that weather conditions will have no effect on deep body temperature, compared to calm immersions, which is supported by this current study. However, previous studies have shown that immersions with simulated weather conditions can indeed cause a drop in deep body temperature in work coveralls (9), and Tipton has shown that
predicted survival times can be reduced by as much as 30% in participants wearing uninsulated immersion suits, in simulated weather conditions, compared to calm water (11). Our findings are in agreement with Tipton and Balmi’s earlier work that showed 500mL of water in an
uninsulated immersion suit will significantly increase skin heat flow (12). Compared to our previous dry tests, 500mL of water increased heat flow by 29.0% in Calm, 34.6% in Weather 1, and 35.1% in Weather 2.
Two factors in the current study may have limited the magnitude of the thermal responses seen by the participants. The temperature of the water in the North Atlantic can drop below 0°C, and the air temperature can drop below –10°C. Our water temperature was about 8.5°C and our air temperature was approximately 16.6°C, both of which can be considered warm compared to the North Atlantic. Additionally, the suits worn by the participants were of a very high quality, and have an immersed clothing insulation value of 1.0 Clo in similar tests when there was no water present in the suit (7).
While there was no significant change in deep body temperature across all immersion conditions, the inclusion of wind and waves did significantly increase the amount of heat lost to the
environment. Adding 500mL of water beneath the immersion suit did not result in a significant increase in MSHF in Weather 2 compared to Weather 1. The thermal gradient and immersed clothing insulation value of the immersion suits allowed our participants to thermoregulate, although this required significantly more effort on their part with 500mL of water in the suit. The conditions tested in the current experiment did not cause a significant decrease in deep body temperature, as the extra heat loss was compensated for by the thermoregulatory responses of the participants. The addition of water to the suit will have moved the participants closer to their thermoregulatory limit, and a decrease in water/air temperature, or a further decrease in suit insulation may be enough to push them beyond their ability to compensate with
thermoregulatory mechanisms. Future work should examine immersion in colder water and air temperatures, establishing a larger thermal gradient, and suits with reduced clothing insulation values to determine the threshold for the ability to thermoregulate.
It is concluded, that in conditions where the body can thermoregulate, small, if any, difference will be seen in deep body temperature. The addition of wind, waves or water in the immersion suit will undoubtedly shift those conditions to levels where thermoregulation may no longer be possible, and result in a significant fall in deep body temperature. Therefore, it is important that when testing humans and immersion suits, to test them in conditions as realistic as possible, or to
TR-2011-03 25
predict the effects that the conditions will have. People may be able to successfully
thermoregulate (perhaps with greater “effort”) in benign test conditions, but more turbulent environments that include wind and waves may provide an additional amount of physiological stress that overcomes their ability so to do, resulting in an unexpected poor level of performance. 8.0 RECOMMENDATIONS
The following recommendations are based on the results collected from this set of experimental trials.
1) When conducting assessments with humans (active thermoregulatory system) it is important to assess each side of the thermal balance equation, i.e. heat loss and heat production. An active thermoregulatory system may mean that in two different conditions (e.g. level of clothing insulation) very similar deep body temperatures are observed because this is a regulated variable. In this case the difference will be in the demand placed on the body to achieve this regulated change in body temperature in terms of the intensity of vasoconstriction or shivering evoked and consequent levels of discomfort. Thus, in circumstances where the body can thermoregulate, the definitive variable may not be body temperature.
2) In theory, in more severe conditions than those used in the present tests, wind and waves can increase the level of thermal stress beyond the point where it is possible to
thermoregulate (maintain a stable deep body temperature). In such situations it is important to consider the added effects of wind and wave conditions when predicting survival time, and when certifying the performance of immersion suits. Certifying
immersion suits in “calm, circulating water” will result in a significant underestimation of their level of performance, leading to surprisingly poor performance in open water
following an accident.
3) Water leakage over the torso in immersion suits can cause an equivalent level of heat flow as that caused by wind and waves. Ensuring that people remain dry in their immersion suit significantly increases their chance of survival. If it is not possible to make sure people will remain completely dry in their immersion suits, rigorous testing in conditions representative of the area of operation must be conducted to ensure that an accurate amount of water leakage is calculated. It should then be determined if this leakage, when appropriately distributed, could potentially result in an unacceptable level of performance.
4) Future work should examine the effects of colder water and air temperatures. A higher thermal gradient between the immersed participants and the environmental conditions may result in them not being able to successfully thermoregulate and maintain a stable deep body temperature.
TR-2011-03 26
9.0 REFERENCES
1) Burton, A.C. Human Calorimetry: The average temperature of the tissues of the body. J of Nutr, 1935. 9: p. 261-80.
2) Ducharme, M.B., and Brooks, C.J. The effect of wave motion on dry suit insulation and the responses to cold water immersion. Aviat Space Environ Med, 1998. 69(10): p. 957-64. 3) Durnin, J.V.G.A., and Womersley, J. Body fat assessed from total body density and its
estimation from skinfold thickness: measurements on 481 men and women aged from 16 to 72 years. Brit J Nutr. 1974. 32: p. 77-97.
4) Hardy, J.D., and DuBois, E.F. The technic of measuring radiation and convection. J of Nutr, 1938. 15: p. 461-75.
5) Hayes, P.A., Sowood, P.J., and Cracknell, R. Reactions to cold water immersion with and without waves. RAF Institute of Aviation Medicine Report, 1985.
6) Hayward, J.S., and Eckerson, J.D. Physiological responses and survival time predictions for humans in ice-water. Aviat Space Environ Med, 1984. (553): p. 206-11.
7) Power, J.T., Simões Ré, A.J., MacKinnon, S.N., Brooks, C.J, and Tipton, M.J. The
evaluation of human thermal responses in wind and waves. TR-2008-10. Institute For Ocean Technology, 2008. 38p.
8) Power, J.T., Simões Ré, A.J., and Tipton, M.J. The evaluation of human thermo-regulatory responses to vary weather states. TR-2009-18. Institute for Ocean Technology, 2009. 41p. 9) Steinman, A.M., Hayward, J.S., Nemiroff, M.J., and Kubilis, P.S. Immersion hypothermia: comparative protection of anti-exposure garments in calm versus rough seas. Aviat Space Environ Med, 1987. 58(6): p.550-8.
10) Tipton, M.J. The initial responses to cold-water immersions in man. Clin Sci (Lond), 1989. 77(6): p.581-8.
11) Tipton, M.J. Immersion fatalities: Hazardous responses and dangerous discrepancies. . J R Nav Med Serv, 1995. 81(2): p. 101-7.
12) Tipton, M.J. and Balmi, P.J. The effect of water leakage on the results obtained from human and thermal manikin tests of immersion protective clothing. Eur J Appl Physiol Occup Physiol, 1996; 72(5-6): p. 394-400.