Publisher’s version / Version de l'éditeur:
Materials and Structures, 43, pp. 1-10, 2010-10-01
READ THESE TERMS AND CONDITIONS CAREFULLY BEFORE USING THIS WEBSITE. https://nrc-publications.canada.ca/eng/copyright
Vous avez des questions? Nous pouvons vous aider. Pour communiquer directement avec un auteur, consultez la
première page de la revue dans laquelle son article a été publié afin de trouver ses coordonnées. Si vous n’arrivez pas à les repérer, communiquez avec nous à PublicationsArchive-ArchivesPublications@nrc-cnrc.gc.ca.
Questions? Contact the NRC Publications Archive team at
PublicationsArchive-ArchivesPublications@nrc-cnrc.gc.ca. If you wish to email the authors directly, please see the first page of the publication for their contact information.
NRC Publications Archive
Archives des publications du CNRC
This publication could be one of several versions: author’s original, accepted manuscript or the publisher’s version. / La version de cette publication peut être l’une des suivantes : la version prépublication de l’auteur, la version acceptée du manuscrit ou la version de l’éditeur.
For the publisher’s version, please access the DOI link below./ Pour consulter la version de l’éditeur, utilisez le lien DOI ci-dessous.
https://doi.org/10.1617/s11527-010-9635-3
Access and use of this website and the material on it are subject to the Terms and Conditions set forth at
Coupled AC impedance and thermo-mechanical analysis of freezing phenomena in cement paste
Sato, T.; Beaudoin, J. J.
https://publications-cnrc.canada.ca/fra/droits
L’accès à ce site Web et l’utilisation de son contenu sont assujettis aux conditions présentées dans le site LISEZ CES CONDITIONS ATTENTIVEMENT AVANT D’UTILISER CE SITE WEB.
NRC Publications Record / Notice d'Archives des publications de CNRC: https://nrc-publications.canada.ca/eng/view/object/?id=de30db62-e0f6-48b9-a116-a124f3780e2e https://publications-cnrc.canada.ca/fra/voir/objet/?id=de30db62-e0f6-48b9-a116-a124f3780e2e
http://www.nrc-cnrc.gc.ca/irc
Couple d AC im pe da nc e a nd t he rm o-m e c ha nic a l a na lysis of fre e zing phe nom e na in c e m e nt pa st e
N R C C - 5 1 4 2 0
S a t o , T . ; B e a u d o i n , J . J .
O c t o b e r 2 0 1 0
A version of this document is published in / Une version de ce document se trouve dans:
Materials and Structures, 43, pp. 1-10, October 01, 2010, DOI: 10.1617/s11527-010-9635-3
The material in this document is covered by the provisions of the Copyright Act, by Canadian laws, policies, regulations and international agreements. Such provisions serve to identify the information source and, in specific instances, to prohibit reproduction of materials without
written permission. For more information visit http://laws.justice.gc.ca/en/showtdm/cs/C-42
Les renseignements dans ce document sont protégés par la Loi sur le droit d'auteur, par les lois, les politiques et les règlements du Canada et des accords internationaux. Ces dispositions permettent d'identifier la source de l'information et, dans certains cas, d'interdire la copie de
Coupled AC impedance and
thermo-mechanical analysis of freezing phenomena
in cement paste
Taijiro Sato, James J. Beaudoin
Institute for Research in Construction, National Research Council Canada Tel: (613) 993-0089
Fax: (613) 954-5984
Email: Taijiro.Sato@nrc-cnrc.gc.ca URL: http://irc.nrc-cnrc.gc.ca/
Keywords: AC Impedance, Cement Paste, Freezing and Thawing
Abstract
Freezing and thawing properties of cement paste were studied using an AC Impedance Spectroscopy (ACIS) technique coupled with the thermomechanical analysis (TMA). The measurements from the ACIS were analyzed in association with the length change of the cement paste determined by TMA. The micro-scale behavior of cement paste observed by the ACIS technique was well correlated with the residual expansion of cement paste after the freezing and thawing cycle. The efficacy of the ACIS technique for assessing the durability of cement paste to frost action was confirmed.
1 Introduction
Portland cement binders are susceptible to freezing and thawing cycles and can undergo significant damage resulting in large expenditures for the repair and replacement of structural concrete. The mechanisms causing the damage by the freezing and thawing cycles are complicated and have been the subject of extensive studies (Powers and Helmuth 1953; Litvan 1972; Bager and Sellevold 1986). One of the most common techniques to study the behavior of a cement paste during the freezing and thawing cycles is to monitor its length change (Helmuth 1960). It was observed that the length of cement paste changed when subjected to the freezing and thawing cycles due to the ice formation in capillary pores and the movement of the pore water. The length change of the cement paste provided useful information on the durability of cement paste, including
hysteresis of the paste caused by the freezing and thawing cycles.
An Alternating Current Impedance Spectroscopy (ACIS) technique has been intensively applied in studying micro-scale properties of cement paste (McCarter, Garvin and Bouzid 1988, Xie et al. 1993). It is gaining wider application owing to its advantages e.g. rapid data acquisition, continuous measurement and the
attractiveness of a non-destructive testing process. The ACIS technique involves the measurement of an electrical signal resulting from an applied perturbation, or external driving force. The responses in electrical signal that the ACIS monitors are of particular interest and value in understanding the micro-scale structures of cement paste under various conditions such as freezing. Olson et al. (1995)
cement paste during cooling from temperature down to –50°C. Perron and Beaudoin (2002) used the ACIS technique to investigate the cement paste subjected to the freezing at –80°C. Sato and Beaudoin (2003) further applied the ACIS technique to study the freezing phenomena of cement paste reinforced with wollastonite micro-fibers. However, the interpretation of the ACIS results
associated with the length change of cement paste was not thoroughly investigated and fully understood.
This paper presents the results of the simultaneous measurement of length change and the impedance spectra of Portland cement paste subjected to the freezing and thawing cycles. An interpretation of the ACIS results is made in association with the results of length change. The efficacy of the ACIS technique for investigating the durability of cement paste to frost action is also examined.
2 AC Impedance Spectroscopy
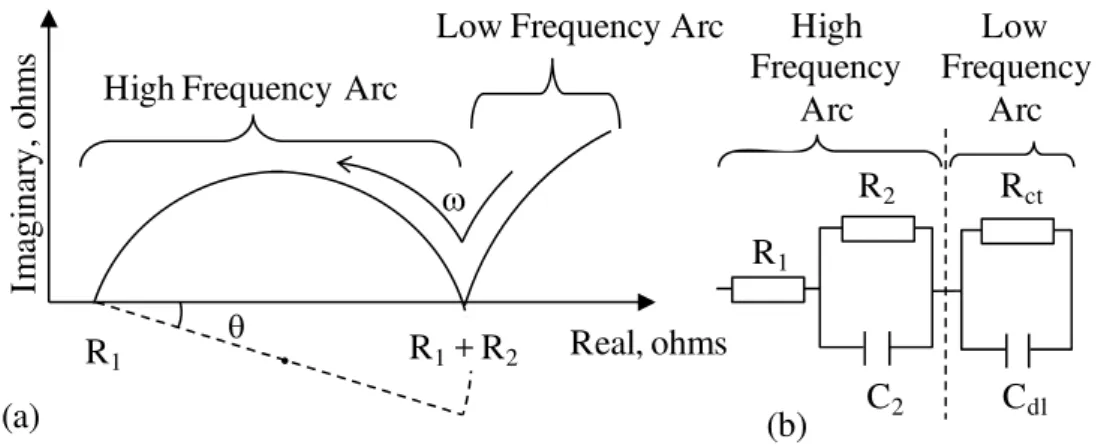
The basic theories of ACIS have been described in detail by McCarter and Brousseau 1990, Christensen et al. 1994, and Macphee, Sinclair and Cormack 1997. An impedance, Z is a measurement of the overall opposition of a circuit to current and determined by its components such as resistance, capacitance and inductance. The resistance, R is constant regardless of frequency, however the capacitance, C and inductance, L vary with frequency, which causes a phase shift between the current and voltage. Therefore, the impedance is generally expressed as a plot of Z’ versus – Z”. A typical impedance spectrum for cement paste is
illustrated on the real versus imaginary plane in Fig. 1(a). A single arc in the high-frequency range and a portion of a second arc in a relatively low-high-frequency range are shown. The high-frequency arc (HFA) is attributed to the bulk cement paste impedance effect and the low frequency arc is due to the cement paste – electrode surface capacitance effect (Xie et al. 1993). The projected intercepts R1 (at the high-frequency end, in the MHz range) and R1 + R2 shown in Fig. 1 (a) are indicative of characteristics of cement paste microstructure. A slight change within the microstructure can be detected by analyzing those parameters, which is the unique property of the ACIS technique. Analysis of the impedance spectrum involves modeling with an equivalent circuit as shown in Fig. 1(b) where R and C are a resistor and capacitor, respectively. The equivalent circuit is a method for modelling the resulting ACIS measurement by a combination of resistors,
capacitors and inductors. In other words, an electric circuit with a combination of those three basic components should be modelled so that the impedance of the equivalent electric circuit fits the resulting ACIS measurement. The values of R1 and R2 can be determined from the equivalent circuit modelled to fit the ACIS measurement.
3 Experimental
3.1 Materials and Sample Preparation
Ordinary Portland cement (OPC) was supplied by Lafarge. The cement paste samples were prepared with w/c 0.35, 0.40, 0.50 and 0.60, and were hydrated in
100% RH condition for 1, 3, 7 and 28 days. A cylindrical specimen, 9.64 mm in diameter and 19.05 mm in length, was cast into a plastic tube mould with two stainless steel electrodes on which electric wires were soldered as shown in Fig. 2(a). The specimen was demoulded on the day following the casting and cured for the desired hydration period.
3.2 The Coupled ACIS – TMA Experiment
The unique coupled AC impedance Spectroscopy (ACIS) – thermomechanical analysis (TMA) experiment was set up for this study as shown in Fig. 2(b), to obtain both datasets simultaneously from the same specimen. The ACIS measurement was obtained using the 1260 Solartron Gain-Phase Analyzer and was fit to the equivalent circuits using the ZView software.
The TMA was performed using a TA Instruments Thermomechanical Analyzer 2940. The test specimens were inserted into the TMA with two electric wires extended outside the temperature control chamber of the TMA and connected to the ACIS at the other end. The temperature regime of a freezing and thawing cycle was as follows: 1) Equilibrate the chamber at +5°C; 2) Hold isothermal condition at +5°C for 10 minutes; 3) Decrease the temperature by 2°C/min to – 80°C; 4) Hold isothermal condition at –80°C for 10 minutes; 5) Increase the temperature by 2°C/min to +20°C.
The freezing and thawing cycle was based on the temperature measured by the thermocouple of the TMA installed in the temperature control chamber, next to the specimen as shown in Fig. 2 (b). This thermocouple measured the air
temperature in the chamber as opposed to the temperature within the specimen. For a calibration purpose, a cast-in thermocouple was installed into the specimen and the temperature within the specimen was measured during the freezing and thawing cycle. It was found that there was a slight difference between air temperature and the temperature within the specimen. The analysis of the TMA results, however, was conducted based on the air temperature of the chamber because of the following two reasons: the exact definition of the specimen temperature is rather ambiguous because of the multi-phase nature of cement paste; and the previous studies on volume change of cement paste during freezing and thawing cycle were often based on the air temperature.
It should also be noted that the specimen in the temperature control chamber was not sealed. However, the drying effect of specimen on the resulting length change was considered to be limited because of the following reasons: the temperature control chamber that encloses the specimen is relatively small; and the saturated vapor pressure in the chamber would become significantly small as the
temperature decreases to –80°C. The amount of water dried from the sample should therefore be significantly small. On thawing, more water might evaporate from the sample, as the temperature increases from –80°C to room temperature. However, the hysteresis of length change is largely influenced by the amount of water frozen during the freezing and the drying effect during thawing on the hysteresis was considered to be minimum.
During one cycle of freezing and thawing, the ACIS was taken every 74 seconds within a frequency range of 100 Hz – 5 MHz. Each ACIS result was then fit to a
corresponding equivalent circuit. The calibration of the ACIS was conducted prior to the study using an electrical circuit with known resistivity and conductivity.
4 Results and Discussion
4.1 Results and Discussion:
Parameters of the simultaneous measurement of length change and impedance spectra on freezing and thawing of cement paste and their correspondence
facilitates an assessment of the mechanism of frost action. A typical set of results for cement paste of w/c 0.50 at 7-day hydration, is discussed first to illustrate the insight provided by the coupled method.
4.1.1 TMA
Figure 3 is a typical TMA result showing the length change versus temperature of a cement paste of w/c 0.50 at 7-day hydration subjected to a freezing and thawing cycle. A brief description of the curve is given here for interpretation of the impedance spectra results. Between points A and B in the figure, the specimen continued to contract until point B approximately at –7°C, indicating that the depression of the freezing point occurred, due to the water contained in the pores of a porous body that has a lower freezing temperature (Litvan 1972). A sudden expansion occurred between points B and C, indicating that the nucleation of ice was initiated in the relatively larger capillary pores. The growth of ice crystals in the supercooled water is extremely rapid, and therefore the greater the degree of supercooling, the greater is the initial expansion (Powers and Helmuth 1953). The
specimen continued to expand as the temperature decreased further between points C and D. The ice crystals in the large capillary pores continued to form. At point D where the slope started to change slightly, the water in the most of the large capillary pores froze while the water in the small capillary pores and gel pores remained supercooled. At point E, the freezing of the water in some of the smaller capillary pores was also completed. It should be noted that there was a portion of water including the gel water that never froze during the entire freezing process. Between points E and F, the specimen contracted as the temperature further decreased upon the completion of freezing. The total expansion caused during the freezing can be defined by the length shown in Fig. 3, which is the vertical distance between F and the linear extension of A – B. The total expansion represents the total amount of water frozen, or freezable water, in the cement paste specimen.
On thawing, an expansion of the specimen occurred as the temperature increased between points F and G. The contraction occurred between points G and H. The thawing of the ice crystals did not necessarily occur at the same temperature as the freezing. It was explained by Helmuth (1960) that a temperature at which ice melts is higher than the temperature at which it became frozen because it only melts when the temperature corresponding to the size of each particular capillary is reached. It was also suggested by Setzer (1997) that the freezing temperature would be much more depressed than the thawing temperature, because the radius of the ice nucleus on freezing is much smaller than the radius of the ice particle on thawing. This would cause significant difference between the freezing and
The freezing and thawing curves take different paths and an effect of the hysteresis resulting from the freezing and thawing cycle can be defined as an irreversible or residual expansion as shown in Fig. 3. The residual expansion caused by inelastic volume change of cement paste, indicates the extent of the damage the cement paste has experienced after a freezing and thawing cycle, and reflects the durability of cement paste to freezing and thawing (Litvan 1972). Therefore the less residual expansion, the more durable is the cement paste to frost action.
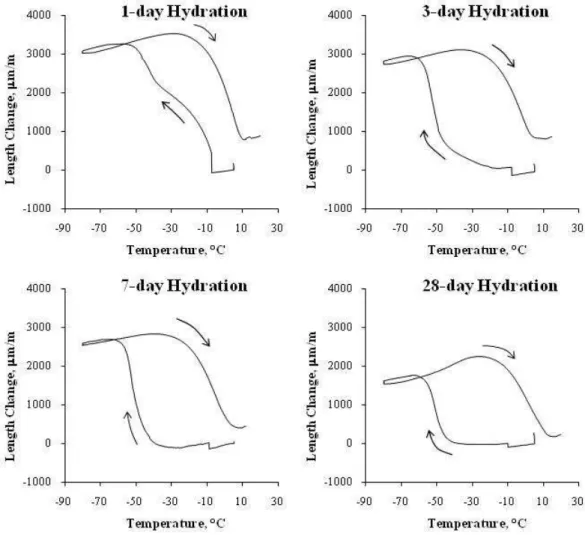
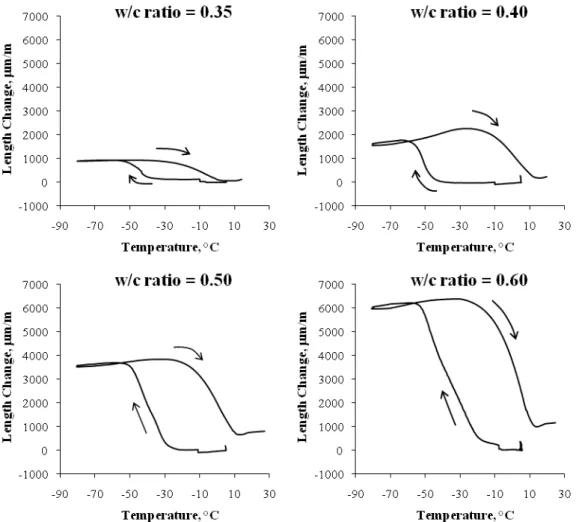
Figure 4 illustrates the TMA result of cement paste of w/c 0.40 at 1-day, 3-day, 7-day and 28-7-day hydration and Figure 5 illustrates the TMA result of cement paste of w/c 0.35, 0.40, 0.50 and 0.60, at 28-day hydration, subjected to a freezing and thawing cycle. It is indicated that the total expansion decreased with the degree of hydration as shown in Fig. 4. As hydration took place, the amount of water which has not reacted with cement became less; thus less freezable water in the capillary pores to cause the total expansion. Also the total expansion increased with w/c as shown in Fig. 5. With the higher w/c, there is more freezable water and thus greater total expansion.
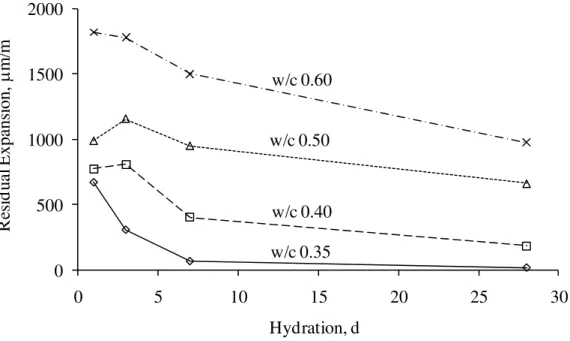
The residual expansion was also influenced by the degree of hydration and w/c. Figure 6 illustrates the residual expansion versus hydration period for cement paste of w/c 0.35, 0.40, 0.50 and 0.60. The general trend shown in the figure is that the residual expansion decreased with increasing degree of hydration and decreasing w/c. A more hydrated cement paste would have less freezable water and higher strength. Therefore, it would be more resistant to the internal stress caused by the ice formation and the resulting residual expansion. Furthermore, as
the degree of hydration increases, the amount of capillary water decreases due to the reaction with cement; therefore there is less damage to the cement paste in terms of the residual expansion. The residual expansion also decreased as w/c decreased. This correlates with the amount of water in the capillary pores. The lower the w/c, the lower is the amount of water in the capillary pores, therefore less residual expansion.
4.1.2 ACIS
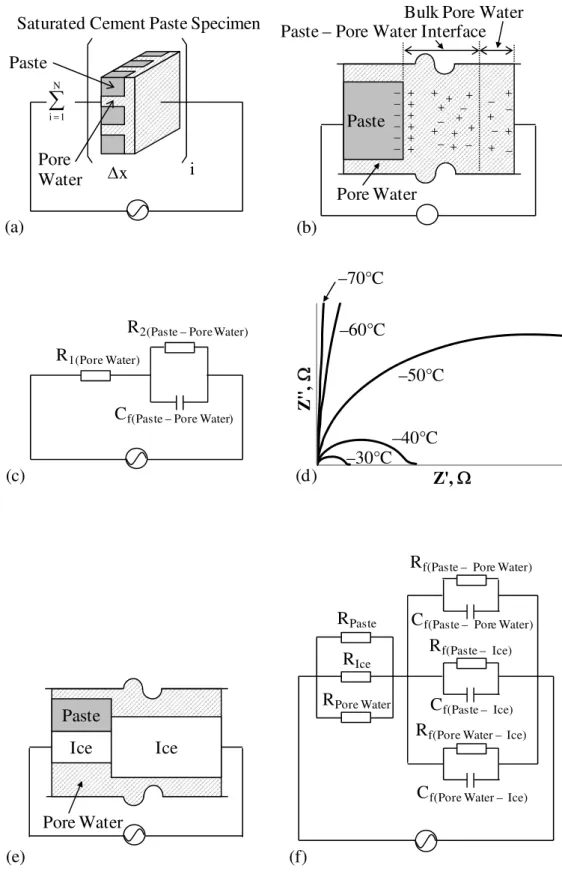
Xie et al. (1993) suggested a model of a saturated cement paste specimen consisting of N elements connected in series as shown in Fig. 7(a). Based on the detailed configuration of the paste – pore water interface shown in Fig. 7(b), the equivalent circuit was proposed as shown in Fig. 7(c), where R1 was the resistance of the bulk pore water and R2 and Cf were the resistance and capacitance of the paste – pore water interface of cement paste, respectively.
Figure 7(d) shows the selected raw impedance results at different temperatures for the cement paste of w/c 0.50 at 7-day hydration subjected to freezing. The figure is scaled to the values of R2 which are significantly larger than those of R1. The equivalent circuit must be reconfigured when the cement paste is subjected to freezing. When the ice formation occurs, the paste – pore water interface becomes the interface of a combination of paste, unfrozen pore water and ice, as shown in Fig. 7(e). From the configuration shown in Fig. 7(e), a circuit model can be expressed as shown in Fig. 7(f). However the impedance results of the cement paste subjected to freezing were the single semi-circles as shown in Fig. 7(d). Therefore, the circuit model suggested in Fig. 7(f) can be reduced to the circuit
model shown in Fig. 7(c). This is rationalized as follows. For the system of three resistors in parallel in the left-hand side of Fig. 7(f), R1 remains RPore Water, since the Rpaste, RIce >> RPore Water. Therefore, R1 is indicative of the resistance of the unfrozen pore water. For the right-hand side of Fig. 7(f), R2 should be either
Rf(Paste – Pore Water) or Rf(Pore Water – Ice), since Rf(Paste – Ice) >> Rf(Paste – Pore Water), Rf(Pore
Water – Ice). As shown in Fig. 7(d), the R2 of the cement paste drastically increased
as the temperature decreased. This can be explained by the drastic decrease in the area of the paste – pore water interface. Therefore, R2 is indicative of the
resistance of the interface between the paste and pore water. Consequently, Cf is the capacitance of this interface.
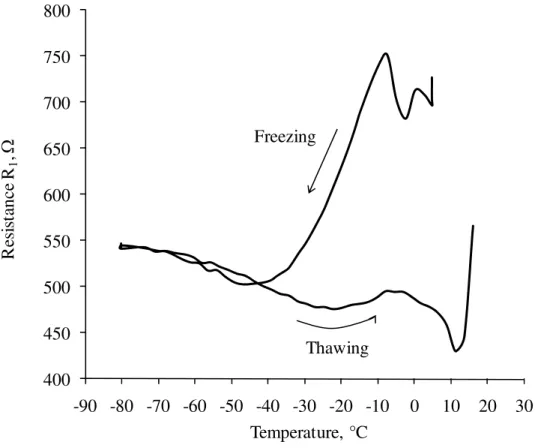
Figure 8 is a plot of resistance R1 versus temperature for a cement paste of w/c 0.50 at 7-day hydration subjected to the freezing and thawing cycle. R1 began to decrease at –7°C, which correlates with the observation in Fig. 3 where the ice formation began at –7°C. R1 continued to decrease with the temperature. This can be explained as follows. The pore water of cement paste before the freezing occurred, contained the dissolved substances such as alkalis which acted as the electrolytes. The ice formed during the freezing process excluded these substances and resulted in a higher concentration of salts in the unfrozen pore water.
Therefore, the charge was carried more easily and resulted in a lower electrical resistance. At approximately –40°C, R1 stopped decreasing and increased slightly as the temperature decreased to –80°C. It should be noted that R1 represents the resistance of the unfrozen water either in the capillary pores or in the gel pores. It was suggested in Fig. 3 that the freezing of the water in the relatively larger capillary pores was completed at approximately –40°C. This implies that R1 below –40°C is indicative of the resistance of the unfrozen water in the smaller
capillary pores. Both Powers and Helmuth (1953) and Litvan (1972) suggested the diffusion of gel water theory where the gel water migrates into the capillary pores due to the thermodynamic disequilibrium between the ice in the capillary pores and the supercooled water in the surrounding gel pores which creates the vapor pressure difference. The ionic concentration of the unfrozen water in the capillary pores would decrease because of the water migrated from the gel pores. This may account for an increase in R1 between –40°C and –80°C. On thawing, R1 stayed relatively lower than its value on freezing above –40°C. It was observed in Fig 3 that there was a temperature difference between freezing and thawing. The ice did not melt at the same temperature as it froze. This would account for the lower R1 on thawing above –40°C in Fig. 8. Also it should be noted that R1 did not return to its value before freezing occurred even after the melting completed at room
temperature. This can be explained by the residual expansion observed in length change. The micro-scale structure of cement paste changed due to the residual expansion resulting in formation of additional cracks and deformed pores. The ionic concentration and dispersion of the pore water might not necessarily return to its original state due to the micro-scale change in the structure after the freezing and thawing cycle. It should be noted that the overall analysis of R1 can be
susceptible, especially if R2 is considerably larger than R1.
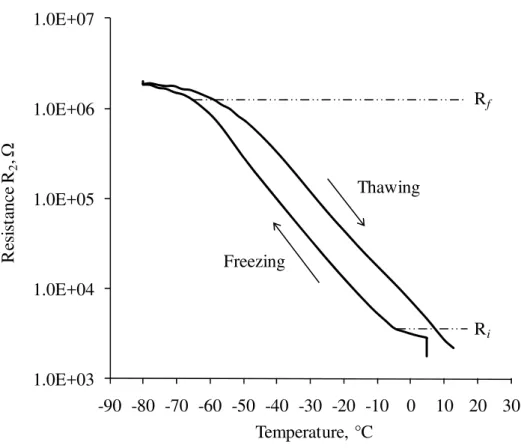
Figure 9 is a plot of resistance R2, on a logarithmic scale, versus temperature for a cement paste of w/c 0.50 at 7-day hydration subjected to the freezing and thawing cycle. R2 increased as soon as the temperature started decreasing. Its rate of change increased indicating the beginning of the freezing of the water in the large capillary pores. Then R2 continued to increase as the area of the paste – pore water interface decreased because of the continuing ice formation in the capillary pores.
R2 did not indicate differences between the freezing in the large capillary pores and the freezing in the smaller capillary pores as apparently was the case for the TMA measurements or R1. The rate of change of R2 on freezing decreased approximately at –65°C, indicating that the freezing of the water was complete. This correlates with the observation in the TMA measurement shown in Fig. 3. On thawing, R2 began decreasing as soon as the temperature started increasing, whereas the thawing did not occur until about –30°C as observed in Fig. 3. Those results imply that there is some melting or phase change occurring before point G in Fig. 3. The pores where the melting has occurred may have been so small that the contraction caused by melting between F and G was counteracted by the expansion of the specimen itself.
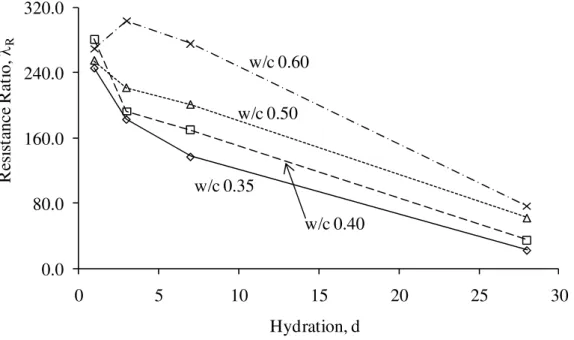
An increase in the resistance R2 between –7°C and –65°C was caused by the decreased area of the paste – unfrozen pore water interface; that is, the increased ice formation. A resistance ratio, λR can then be introduced as follows; λR = Rf / Ri, where Ri and Rf are the resistance at beginning and completion of freezing of water, respectively. For all of the cement paste specimens, Ri and Rf were determined by taking the value of R2 at the temperature where its rate of change increased in the beginning of the freezing and where its rate of change decreased at the end of the freezing, respectively. Those temperatures correlated with the temperature of point B and E from the TMA results. The λR can provide the information regarding how much ice formation has taken place and how it would affect the durability of the cement paste to frost action. Figure 10 illustrates the resistance ratio, λR versus hydration period for cement paste of w/c 0.35, 0.40, 0.50 and 0.60. The general trend shown in the figure was that the resistance ratio, λR decreased with increasing degree of hydration and decreasing w/c. A more
hydrated cement paste would have less amount of water in the capillary pores because of the reaction with cement. Therefore the area of the paste – unfrozen pore water interface was also smaller in the more hydrated paste when subjected to freezing. Moreover, the lower the w/c, the lower is the amount of water in the capillary pores, therefore the area of the paste – unfrozen pore water interface was also smaller. Those observations from the resistance ratio, λR determined by the ACIS technique were well correlated with those from the residual expansion determined by the length change. The cement pastes that are susceptible to damage in the freezing and thawing cycle had in fact a larger residual expansion. The ACIS technique for assessing the durability of cement paste to frost action appears to be promising.
5 Conclusions
The ACIS technique was coupled with the thermomechanical analysis method to study the micro-scale properties of cement paste subjected to a freezing and thawing cycle. The coupled technique provided valuable comparison between the mechanical and electro-chemical properties of cement paste. The parameters obtained from the ACIS were analyzed in association with the length change of the cement paste during the freezing and thawing circle. The equivalent circuit was reconfigured for the frost action and it was suggested that two elements of resistance, R1 and R2 represent the resistance of the unfrozen pore water and the resistance of the paste – pore water interface, respectively. Also the resistance ratio, λR was defined in order to quantify the susceptibility of the cement paste to
the frost action. The results of the resistance ratio, λR were well correlated with the residual expansion determined by the length change of the cement paste which is an indicative of the durability to the frost action. In this study, the efficacy of the ACIS technique for assessing the durability of the cement paste to frost action was confirmed. It should be possible to assess the resistance of cement paste against frost action using the impedance technique alone should length change measurements not be possible.
References
Bager DH and Sellevold EJ (1986) Ice Formation in Hardened Cement Paste, Part I – Room Temperature Cured Pastes with Variable Moisture Contents. Cem. Concr. Res., 16, 709-720.
Christensen BJ, Coverdale RT, Olson RA, Ford SJ, Garboczi EJ, Jennings HM and Mason TO (1994) Impedance Spectroscopy of Hydrating Cement-Based Materials: Measurement, Interpretation, and Application. J. Am. Ceram. Soc., 77, 11, 2789–804.
Helmuth RA (1960) Capillary Size Restrictions on Ice Formation in Hardened Portland Cement Paste. 4th Int. Symp. Chem. Cem., Washington D.C. USA, 855-869.
Litvan GG (1972) Phase Transitions of Adsorbates: IV. Mechanism of Frost Action in Hardened Cement Paste. J. Am. Ceram. Soc., 55, 1, 38-42.
McCarter WJ, Garvin S and Bouzid N (1988) Impedance measurements on cement paste. J. Mater. Sci. Lett., 7, 1056-1057.
McCarter WJ and Brousseau R (1990) The A.C. Response of Hardened Cement Paste. Cem. Concr. Res., 20, 891-900.
Macphee DE, Sinclair DC and Cormack SL (1997) Development of an Equivalent Circuit Model for Cement Pastes from Microstructural Considerations. J. Am. Ceram. Soc., 80, 11, 2876–84.
Olson RA, Christensen BJ, Coverdale RT, Ford SJ, Moss GM, Jennings HM, Masonand TO and Garboczi EJ (1995) Interpretation of the Impedance Spectroscopy of Cement Paste via Computer Modeling. J. Mater. Sci., 30(20), 5078-5086.
Perron S and Beaudoin JJ (2002) Freezing of Water in Portland Cement Paste – an AC Impedance Spectroscopy Study. Cem. Concr. Compos. 24, 467-475.
Powers TC and Helmuth RA (1953) Theory of Volume Changes in Hardened Portland Cement Paste during Freezing. Portland Cement Association. Research and Development Laboratories, Bulletin; 46, 285-297.
Sato T and Beaudoin JJ (2003) An AC Impedence Spectroscopy Study of Freezing Phenomena in Wollastonite Micro-fiber Reinforced Cement Paste. Role of Cement Science in Sustainable Development - Proceedings of the International Symposium (Scotland, UK, Sep. 3-4, 2003), 379-388.
Setzer MJ (1997) Action of Frost and Deicing Chemicals: Basic Phenomena and Testing. In: Marchand J, Pigeon M, Setzer M. (ed) Freeze-Thaw Durability of Concrete, E & FN Spon, London, UK, 3-22.
Xie P, Gu P, Xu Z and Beaudoin JJ (1993) A Rationalized A.C. Impedance Model for
Microstructural Characterization of Hydrating Cement Systems. Cem. Concr. Res., 23, pp.359-367.
(a) Im ag in ar y, ohm s ω High Frequency Arc
R1 R1+ R2 Real, ohms
Low Frequency Arc
θ (b) Rct Cdl R2 C2 R1 High Frequency Arc Low Frequency Arc
Fig. 1: (a) Schematic of a high frequency arc and (b) a simplified equivalent circuit
(a) Plastic Tube Mould Cap Paste Cast-in Electrodes Electric Wires
TMA
ACIS
Electric Wires Liquid Nitrogen Tank Temperature Control Chamber Specimen (b) ThermocoupleFig. 2: (a) Cement paste cast with the two electrodes and (b) the unique coupled ACIS – TMA experimental set up
-1000 0 1000 2000 3000 4000 5000 -90 -80 -70 -60 -50 -40 -30 -20 -10 0 10 20 30 L engt h C ha nge, μm/m Temperature, °C
A
B
D
E
F
C
G
H
Total Expansion Residual Expansion Freezing ThawingFig. 3: A typical plot of length change versus temperature obtained from the TMA measurement for a cement paste specimen of w/c 0.50 at 7-day hydration subjected to a freezing and thawing cycle. The plot is explained in the text using Points A ~ H.
Fig. 4: Length change versus temperature for cement paste specimens of w/c ratio 0.40 at 1-day, 3-day, 7-day and 28-day hydration
Fig. 5: Length change versus temperature for cement paste specimens of w/c ratio 0.35, 0.40, 0.50 and 0.60 at 28-day hydration
0 500 1000 1500 2000 0 5 10 15 20 25 30 R es id u al E xpans ion, μm/m Hydration, d w/c 0.35 w/c 0.40 w/c 0.50 w/c 0.60
(a) Paste
Pore
Water Δx i
Saturated Cement Paste Specimen
∑
= N 1 i Paste (b) + + + + + + + + + + + + ++ + – – – – + + + + – – – – – – – – – –Paste – Pore Water Interface Bulk Pore Water
Pore Water Pore Water (e) Paste Ice Ice R1(Pore Water)
R2(Paste – Pore Water)
Cf(Paste – Pore Water)
(c)
Cf(Pore Water – Ice) Rf(Pore Water – Ice)
Rf(Paste – Ice)
Cf(Paste – Ice) Rf(Paste – Pore Water)
Cf(Paste – Pore Water)
RIce RPore Water RPaste (f) Z '', Ω Z', Ω –30°C –40°C –50°C –60°C (d) –70°C
400 450 500 550 600 650 700 750 800 -90 -80 -70 -60 -50 -40 -30 -20 -10 0 10 20 30 R esi st an ce R 1 , Ω Temperature, °C Freezing Thawing
Fig. 8: Resistance R1 versus temperature for a cement paste specimen of w/c 0.50 at 7-day
1.0E+03 1.0E+04 1.0E+05 1.0E+06 1.0E+07 -90 -80 -70 -60 -50 -40 -30 -20 -10 0 10 20 30 R esi st an ce R2 , Ω Temperature, °C Rf Ri Freezing Thawing
Fig. 9: Resistance R2, on a logarithmic scale, versus temperature for a cement paste specimen of
0.0 80.0 160.0 240.0 320.0 0 5 10 15 20 25 30 R esi st an ce R at io , λR Hydration, d w/c 0.35 w/c 0.40 w/c 0.50 w/c 0.60