HAL Id: cea-02549087
https://hal-cea.archives-ouvertes.fr/cea-02549087
Submitted on 21 Apr 2020
HAL is a multi-disciplinary open access
archive for the deposit and dissemination of
sci-entific research documents, whether they are
pub-lished or not. The documents may come from
teaching and research institutions in France or
abroad, or from public or private research centers.
L’archive ouverte pluridisciplinaire HAL, est
destinée au dépôt et à la diffusion de documents
scientifiques de niveau recherche, publiés ou non,
émanant des établissements d’enseignement et de
recherche français ou étrangers, des laboratoires
publics ou privés.
Dynamic Measurements of Physical Quantities in
Extreme Environment using Fiber Bragg Grating
Yohan Barbarin, A. Lefrançois, Sylvain Magne, V. Chuzeville, M. Balbarie, L.
Jacquet, F. Sinatti, A. Osmont, J. Luc
To cite this version:
Yohan Barbarin, A. Lefrançois, Sylvain Magne, V. Chuzeville, M. Balbarie, et al.. Dynamic
Measure-ments of Physical Quantities in Extreme Environment using Fiber Bragg Grating. 25th International
Conference on Optical Fiber Sensors, Apr 2017, Jeju, South Korea. pp.103234K, �10.1117/12.2265670�.
�cea-02549087�
*yohan.barbarin@cea.fr; phone +33 5 65 10 55 99
Dynamic Measurements of Physical Quantities in Extreme
Environment using Fiber Bragg Grating
Y. Barbarin
a*, A. Lefrançois
a, S. Magne
b, V. Chuzeville
a, M. Balbarie
a, L. Jacquet
a, F. Sinatti
a,
A. Osmont
aand J. Luc
aa
CEA, DAM, GRAMAT, F-46500 Gramat, France;
bCEA, LIST, Laboratoire Capteurs,
Architectures Electroniques, F-91191 Gif-sur-Yvette, France
ABSTRACT
Fiber Bragg Gratings (FBGs) are used to measure shock velocity, detonation velocity, shock wave profile or pressure profile in inert and energetic materials. Such thin probe, with a diameter below 150 µm, can be inserted directly into materials without disturbing the physical phenomena. Chirped FBGs are used to track the shock wave in the grating using wavelengths. The velocity (few km/s) and shock wave profile measurements are realized by recording the CFBG’s reflected spectral width. Pressure measurements at few GPa levels use dynamic spectrometers, two approaches are compared: parallel acquisition using an Arrayed-Waveguide-Grating and time-multiplexing by wavelength-to-time conversion using dispersion.
Keywords: Fiber Bragg Grating, Shock, High pressure, High Explosives, Velocimetry, Dynamic Spectrometer
1. INTRODUCTION
In the fields of shock and energetic materials, experimental material quantities are required to feed Equations Of States (EOS) and be able to run complex hydrodynamic simulations. Transient physics, like a Shock to Detonation Transition (SDT), are of high interest. The main physical quantities ideally recorded continuously during such a fast experiment are shock position and velocity, detonation velocity, shock wave transverse profile, longitudinal pressure profile and possibly temperature at different locations. Typical shock and detonation velocities are in the range of few km/s, the pressure levels induced are in the range of [1 – 10] GPa. The acquisition time lasts few µs or tens of µs at a rate of 100 MHz or higher. These physical measures need obviously to be experimentally acquired with a minimum of intrusivity. Classically, electrical measurements are used. For detonation velocity and detonation wave profile measurements, Electrical Shorting Pins (ESPs) are commonly used. This is a discrete chronometric measurement; the pins’ diameter is ~1mm and it is rarely implanted into the High Explosives (HE). The response time of such sensor can however be below 5 ns. Pressure levels are measured electrically in few points with thin-film gauges [1]. The pressure gauge’s material can be adapted to cover various ranges: i.e. Carbon [0 – 4] GPa, Manganin [0 – 100] GPa. The response time of such gauge depends on their thickness and can be as fast as 50 ns for the 50-µm thick ones. The main drawbacks of this technique are that pressure gauges are sensible to electromagnetic (EM) fields and that their footprint of few mm2 is relatively intrusive. Shocks velocities can be extracted by monitoring surfaces using optical interferometry [2]. Millimeter wave [3] are also used to measure inside the materials but the material permittivity needs to be known and the measurement is averaged radially over few millimeters depending on the antenna design. In this paper we present that Fiber Bragg Grating (FBG) can also be used to measure these physical values with low intrusivity and EM immunity.
2. SHOCK WAVE AND DETONATION VELOCITY MEASUREMENT
2.1 Concept and description of the system
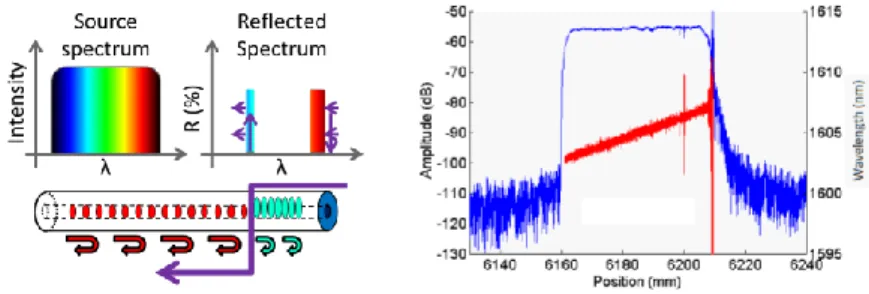
The concept of the detonation and shock velocity measurement using a Chirped FBG is illustrated in Figure 1 a). In the CFBG, a reflected wavelength corresponds to a position on the grating. When a detonation propagates, the front wave pressure is above the silica damage level and as a direct consequence, the FBG is shortened [4]. Nevertheless, when a shock propagates below the silica damage level, this part of the spectrum can be shifted outside the source spectrum. In both conditions, when measuring the intensity of the reflected spectrum during the shock, a ramp-down signal type is obtained tracking the shock-wave. The measurement system is presented in Figure 1. b). As explained in [5], the optical distortions in the optical spectrum are compensated by measuring the optical spectrum before the experiment. To avoid
*yohan.barbarin@cea.fr; phone +33 5 65 10 55 99
possible light parasites, the reflected signal is filtered in the C-band. For more accuracy, the CFBG are characterized just before the experiments by an OFDR from LUNA Technologies to extract the CFBG chirp [6].
Figure 1. a) Detonation & shock velocity measurement using a CFBG b) the CFBG measurement system.
2.2 Experimental results
Over the last years, many dynamic measurements of detonation velocity profiles were performed at CEA Gramat using long Chirped Fiber Bragg Gratings. CFBG are generally glued in the center of the HE in a small hole or pasted outside along a HE’s edge. Over time, CFBGs have been tailored to our needs and three grating lengths are typically used: 20, 50 & 100 mm. An example of a wedge test experiment to study SDT is shown in Figure 2. a). The HE is submitted to a plane sustained shock wave using a 98-mm diameter powder gun [3]. On the XT-Diagram (Figure 2. b), the three types of metrology overlap nicely. One can see two trends. The 1st trend occurs when the HE is shocked; the wavelengths are shifted outside the source bandwidth. The 2nd trend appears when the HE is detonating shortening the CFBG. The XT-diagram can then be derived to plot the velocity profile and get the steady state velocity (7952 ± 167 m/s).
Figure 2. a) Wedge test experiment to study SDT on a melt-cast HE [3]. b) XT-diagram where the different measurements systems are compared (CFBG, ESPs and radio-interferometry).
3. SHOCK WAVE TRANSVERSE PROFILE MEASUREMENT
Using a different fiber orientation, the shock wave or detonation wave curvature can be measured with the same system. The CFBG is placed perpendicularly and crosses slightly the center as illustrated in Figure 3. a). Classical measurement uses discrete ESPs or a streak-camera at the end of the HE cylinder. To plot the curvature as function of the HE’s depth, the detonation profile measurements are done at constant velocity, which can be measured with a second CFBG. An experimental result is plotted in Figure 3. b) for a 80-mm diameter melt-cast HE. The CFBG was inserted perpendicularly in the HE and placed close to the end of the cylinder. At the end of the cylinder, 24 ESPs were positioned in cross shape. The fit over the ESPs’ timing results overlaps nicely with the continuous measurement obtained by a single CFBG in the HE.
Figure 3. a) Detonation profile measurement using a CFBG. At a constant detonation velocity, the time axis is translated to a depth. b) Experimental comparison of detonation profile measurements by ESPs and CFBG.
*yohan.barbarin@cea.fr; phone +33 5 65 10 55 99
4. DYNAMIC HIGH PRESSURE PROFILE MEASUREMENT BY SPECTROMETRY
4.1 Concept and CFBG design
The pressure profile measurement is illustrated in Figure 4. a). When placing a CFBG along the shock direction, the reflected wavelengths shift towards the lower wavelengths as function of pressure. The CFBG is not as “chirped” as in velocity measurements but enough to localize the front-wave in the material of study. When a shock at a constant pressure level propagates, the initial FBG width decreases at the speed of the shock front-wave and the wavelengths are blue shifted by the same amount until the FBG is completely shocked. More complexed pressure profiles can be measured, but it requires the support of hydrodynamic numerical simulations. The shock coupling between the material of study and silica depends on the material properties and the 2D geometry of the shock. We have characterized in [7] the transfer function at pressure levels up to 8 GPa for an Al target and a CFBG integrated in a 0.4-mm hole with a glue layer. The function is not linear and decreases with pressure. This is explained by the material properties but the fiber integration plays an important role. The CFBGs’ central wavelength is set at the end of the L-band near 1605 nm to cover a pressure range of [0 – 8] GPa, an OFDR characterization of such CFBG is plotted in Figure 4. b).
Figure 4. a) High pressure profile measurement using a CFBG. b) type of CFBG: 48-mm long, at 1605 nm & 4-nm wide.
4.2 AWG-based dynamic spectrometer and dispersive dynamic spectrometer
Two dynamic spectrometers are discussed: an AWG-based spectrometer and one based on wavelength-to-time conversion using dispersion. The first spectrometer is described in Figure 5.a) and is based on a customized 40-channels arrayed waveguide grating (AWG) which was described in [7]. The AWG filters the wavelengths in 40 discrete channels spaced by 200 GHz (approximately 1.6 nm @1550 nm). The device is then connected to fibers which brings the wavelength signals to discrete photoreceivers. The photoreceivers used have a bandwidth of DC – 400 MHz or 10 kHz – 2 GHz. The dispersive spectrometer is described in Figure 5.b) and was demonstrated for such application in [8]. The source is a femtosecond laser with a repetition rate of 100 MHz. The wide optical spectrum of this source allows sensing wide FBG’s wavelength shifts and its repetition rate sets the spectrometer’s sampling rate. The CFBG spectrum is converted to time by dispersion using a long SMF28 fiber. The fiber length gives the “span” of the spectrometer. The spectrum evolution is multiplexed in time therefore a very fast detection (bandwidth > 30 GHz) is required to get a high wavelength resolution. For instance, at 100 MHz repetition rate and for a “span” of 30-nm (~18 km SMF28 fiber), the resolution is ~0.1 nm. This is an order of magnitude better than the AWG.
Figure 5. a) Dynamic AWG-based spectrometer. b) Dynamic dispersive spectrometer.
4.3 Experimental results
To compare the two dynamic spectrometers, two CFBGs were inserted together in a hole of 0.7 mm in the center of a target. The experimental setup is a symmetric impact with Al (6061T6) impactor and target like in [7]. For this experiment, the impact velocity was 314 m/s. The shock level was measured to be (2.08 ± 0.11) GPa by two pressure
*yohan.barbarin@cea.fr; phone +33 5 65 10 55 99
gauges [2]. The time evolutions of the CFBGs’ spectra are plotted in Figure 6 a) and b). A 2D hydrodynamic simulation of the experiment has also been executed with EOS for Al, Silica and the glue used. The Silica pressure profile over time was then the input of a CFBG model based on transfer matrices computed using Matlab. This optical model uses for now linear coefficients for the fiber compression and group index increase. The result of the optical simulation is plotted in Figure 6. c). When the shock propagates into the CFBG, its initial width decreases and new signals appears. Two spectral zones are visible in the simulated and the AWG plots. It is explained by the hydrodynamic simulation which shows a lack of coupling in the tail of the shock due to the glue layer. It is much less pronounced for the dispersive spectrometer where low intensity signal is seen at lower wavelength (~1586 nm) despite the improved resolution. Mostlikely, its CFBG is located more in the center of the hole and probes lower pressure levels than the AWG’s CFBG.
Figure 6. Time evolution of the FBGs’ spectra measured by a) the AWG spectrometer and b) dispersive spectrometer. c) Simulation evolution of the FBGs’ spectra using hydrodynamic simulation data for a shock at 314 m/s (2.25 GPa in Al)
CONCLUSION
We presented various optical measurement systems using CFBGs as probes to study shocks and HEs. CFBGs can offer EM immunity, continuous and local measurements directly in the material with low intrusivity which all together is not the case for classical technics (ESPs, strain gauges, streak camera, radiointerferometry, etc.). The use of chirped FBGs provides a positioning of the shock along the fiber. The measurements of shock or detonation velocities as well as shock wave profiles are now well established. The dynamic measurement of shock pressure profiles is more complexed and requires more developments with the support of hydrodynamic simulations. The AWG system offers a direct measurement of the spectrum evolution but its resolution is limited by design. The dispersive spectrometer has a much greater resolution at a sufficient speed, though the wavelength-to-time conversion stage can be optimized.
REFERENCES
[1] Duan Z. et al. “Foil-like manganin gauges for dynamics high pressure measurements”, Meas. Sci. Tech. vol. 22, pp. 1-5 (2011)
[2] Devlaminck J. et al. “Digital signal processing for velocity measurements in dynamical material’s behaviour studies”, Review Of Scientific Instruments 85, 035109 (2014)
[3] Chuzeville V. et al. "Detonation initiation of heterogeneous melt-cast high explosives“ Proc. Europyro 2015, p.485, (2015)
[4] Benterou J.J. et al. “In-sity continuous detonation velocity measurements using fiber-optic Bragg grating sensors”, Proc. 34th International Pyrotechnics Seminar, 1, 309-322, (2007)
[5] Barbarin Y. et al. “Optimization of detonation velocity measurements using a chirped fiber Bragg grating”, Proc. SPIE 9480, Fiber Optic Sensors and Applications XII, 94800S (2015)
[6] Magne S. et al. "Chirped Fiber Bragg gratings for distributed detonation velocity measurements," in Photonics and Fiber Technology, paper BM5B.3 (2016)
[7] Barbarin Y. et al. “Dynamic High Pressure Measurements Using a Fiber Bragg Grating Probe and an Arrayed Waveguide Grating Spectrometer”, Proc. SPIE 9960-35, (2016)
[8] Rodriguez G. et al. “Coherent pulse interrogation system for fiber Bragg grating sensing of strain and pressure in dynamic extremes of materials”, Optics Express 14219, (2015)
![Figure 2. a) Wedge test experiment to study SDT on a melt-cast HE [3]. b) XT-diagram where the different measurements systems are compared (CFBG, ESPs and radio-interferometry)](https://thumb-eu.123doks.com/thumbv2/123doknet/12947595.375628/3.893.151.742.500.667/figure-experiment-diagram-different-measurements-systems-compared-interferometry.webp)