HAL Id: hal-00553782
https://hal.archives-ouvertes.fr/hal-00553782
Submitted on 17 Oct 2015
HAL is a multi-disciplinary open access
archive for the deposit and dissemination of
sci-entific research documents, whether they are
pub-lished or not. The documents may come from
teaching and research institutions in France or
abroad, or from public or private research centers.
L’archive ouverte pluridisciplinaire HAL, est
destinée au dépôt et à la diffusion de documents
scientifiques de niveau recherche, publiés ou non,
émanant des établissements d’enseignement et de
recherche français ou étrangers, des laboratoires
publics ou privés.
lower stratosphere as seen by the CALIPSO lidar
Jean-Paul Vernier, Jean-Pierre Pommereau, Larry W. Thomason, Jacques
Pelon, Anne Garnier, Terry Deshler, Julien Jumelet, Johannes K. Nielsen
To cite this version:
Jean-Paul Vernier, Jean-Pierre Pommereau, Larry W. Thomason, Jacques Pelon, Anne Garnier, et
al.. Overshooting of clean tropospheric air in the tropical lower stratosphere as seen by the CALIPSO
lidar. Atmospheric Chemistry and Physics, European Geosciences Union, 2011, 11 (18), pp.9683-9696.
�10.5194/acp-11-9683-2011�. �hal-00553782�
www.atmos-chem-phys.net/11/9683/2011/ doi:10.5194/acp-11-9683-2011
© Author(s) 2011. CC Attribution 3.0 License.
Chemistry
and Physics
Overshooting of clean tropospheric air in the tropical lower
stratosphere as seen by the CALIPSO lidar
J.-P. Vernier1,2, J.-P. Pommereau2, L. W. Thomason1, J. Pelon2, A. Garnier2, T. Deshler3, J. Jumelet2, and J. K. Nielsen4
1NASA Langley Research Center, Hampton, VA 23666, USA
2LATMOS, CNRS-INSU, UMR8190, Universit´e de Versailles St. Quentin, Universit´e de Paris 6, France 3Department of Atmospheric Science, University of Wyoming, USA
4Danish Meteorological Institute, Copenhagen, 2100, Denmark
Received: 12 August 2010 – Published in Atmos. Chem. Phys. Discuss.: 6 January 2011 Revised: 18 May 2011 – Accepted: 3 September 2011 – Published: 20 September 2011
Abstract. The evolution of aerosols in the tropical upper
troposphere/lower stratosphere between June 2006 and Oc-tober 2009 is examined using the observations of the space borne CALIOP lidar aboard the CALIPSO satellite. Super-imposed on several volcanic plumes and soot from an ex-treme biomass-burning event in 2009, the measurements re-veal the existence of fast-cleansing episodes in the lower stratosphere to altitudes as high as 20 km. The cleansing of the layer, which extends from 14 to 20 km, takes place within 1 to 4 months during the southern tropics convective season that transports aerosol-poor tropospheric air into the lower stratosphere. In contrast, the convective season of the Northern Hemisphere summer shows an increase in the parti-cle load at the tropopause consistent with a lofting of air rich with aerosols. These aerosols can consist of surface-derived material such as mineral dust and soot as well as liquid sul-fate and organic particles. The flux of tropospheric air dur-ing the Southern Hemisphere convective season derived from CALIOP observations is shown to be 5 times at 16 km and 20 times at 19 km larger, respectively, than that associated with flux caused by slow ascent through radiative heating. These results suggest that convective overshooting is a ma-jor contributor to troposphere-to-stratosphere transport with concomitant implications for the Tropical Tropopause Layer top height, the humidity, the photochemistry and the thermal structure of the layer.
Correspondence to: J.-P. Vernier ([email protected])
1 Introduction
Most natural and human-made short- and long-lived trace gases controlling stratospheric chemistry and radiative bal-ance are emitted at the surface and rapidly lifted up in the tropics by convective systems. They reach the maximum out-flow of convective systems near 14 km within a few hours (Gettelman and Forster, 2002), from where they are trans-ported upward across the Tropical Tropopause Layer (TTL) into the stratosphere and distributed globally by the Brewer-Dobson circulation (Holton et al., 1995). Two mechanisms contribute to the transport across the TTL: a slow ascent on a time scale of 6 to 9 months up to 20 km by radiative heat-ing of air masses (Holton, 1995; Corti et al., 2005; Yang et al., 2008; Fueglistaler et al., 2008) and fast convective overshooting updrafts above land thunderstorms as proposed by Danielsen (1982, 1993). Convection associated with the Asian monsoon during the Northern Hemisphere summer may also contribute to the latter mechanism bypassing trop-ical areas (Dunkerton, 1995; Gettelman et al., 2004; Randel et al., 2010; Fu et al., 2006).
Due to the time required to ascend through the TTL by slow radiative heating, very short-lived chemically active species should be deactivated and the air is expected to be dehydrated at the cold point tropopause. Although recog-nized to occur episodically (Danielsen, 1982, 1993), fast convective overshooting of adiabatically cooled air is gen-erally believed to occur too infrequently to be significant in the overall mass flux (Fueglistaler et al., 2008 and ref-erences therein). However, recent observations adjacent to or above continental tropical convective systems during re-cent European balloon and high altitude aircraft campaigns,
HIBISCUS (Pommereau et al., 2011) and TROCCINOX (Chaboureau et al., 2007) in Brazil, SCOUT-O3 in north-ern Australia (Brunner et al., 2009) and SCOUT-AMMA in West Africa (Cairo et al., 2010), have shown that convective overshoots are more common than previously thought. They can reach altitudes as high as 19 km and thus strongly impact the thermal structure of the TTL (Pommereau et al., 2011; Cairo et al., 2010). Moreover, during these field campaigns, the air was not found to be dehydrated as often assumed, but instead associated with water vapor enhancements after evaporation of the injected ice crystals (Nielsen et al., 2007; Chaboureau et al., 2007; Corti et al., 2008; Khaykin et al., 2009), a process relatively well captured by cloud resolving models (CRM) (Jensen et al., 2007; Chaboureau et al., 2007; Grosvenor et al., 2007).
Although the frequent occurrence of such events over trop-ical continents is becoming more widely accepted, their con-tribution to troposphere-to-stratosphere transport at global scale is still debated. There are indications however that it might be more significant than previously thought. For instance, the Tropical Rainfall Measurements Mission-Precipitation Radar (TRMM-PR) indicates that at least 1 % of storm turrets reach the TTL (Liu and Zipser, 2005), partic-ularly over Africa (Zipser et al., 2006; Liu and Zipser 2009). Since TRMM-PR are only sensitive to large hydrometeors produced in the core of deep convective systems, this per-centage could be significantly underestimated.
Trace gases measurements in the UT/LS such as CH4
con-centration from HALOE, N2O from ODIN-SMR, N2O and
CO from AURA-MLS, show maxima in the lower strato-sphere over tropical continents (Ricaud et al., 2007; Schoe-berl et al., 2006), indicative of fast vertical transport over these areas. Finally, the high-resolution aerosols profiles of the CALIOP lidar observations show an apparent aerosol cleansing of the TTL and lower stratosphere during the Northern Hemisphere winter that may be linked to convec-tive overshooting (Vernier et al., 2009).
Except for infrequent strong volcanic eruptions (Mc-Cormick et al., 1995), the sources of aerosols in the trop-ical Upper Troposphere and Lower Stratosphere are poorly understood. In situ particle measurements have shown that the production of Aitken nuclei (r < 50 nm) is very high in the tropics compared to the mid-latitudes due to gas-to-particles conversion of SO2 and other gas precursors (e.g.
DMS) (Brock et al., 1995). High altitude aircraft particle composition and volatility measurements have indicated the presence of aerosols, largely made of a sulfate-organic mix-ture, and, to a smaller extent, black carbon and other car-bonaceous materials (Froyd et al., 2009; Spackman et al., 2011; Bormann et al., 2010). But CALIPSO and SAGE II have also demonstrated that even small volcanic eruptions contribute significantly to the sulfate load of the tropical lower stratosphere (Vernier et al., 2011b). The lifetime of aerosols in the upper troposphere is controlled by convection by which they can be removed and precipitated to the ground
(i.e. “washout”). Since at least 1 % of tropical convective systems reach the TTL (Liu and Zipser, 2005), the process might be an important sink of aerosols below the tropopause in this region (Hamill et al., 1997).
The objective of this paper is to further examine the CALIOP clean air events from the beginning of the mis-sion in June 2006 until October 2009, and their possible re-lation with convection in the tropics. Section 2 provides a description of CALIOP aerosols observations in the UT/LS, followed in Sect. 3 by a comprehensive analysis of the verti-cal and latitudinal clean air propagation during the Northern Hemisphere (NH) fall-winter-spring in 2007–2008. This pe-riod is the optimum pepe-riod as it is least affected by volcanic or fire events of any period in the CALIOP record. The ori-gin of the clean air is investigated in Sect. 4. Section 5 pro-vides an estimate of tropospheric air mass fluxes at the global scale derived from the observed cleansing compared to the contribution of slow ascent by radiative heating, and Sect. 6 discusses alternative microphysical and dynamical processes which could also contribute to the observations. The conclu-sions are summarized in Sect. 7.
2 Cleansing of the UT/LS as seen by CALIOP
The CALIPSO mission, a collaboration between the National Aeronautics and Space Administration (NASA) and the Cen-tre National d’Etudes Spatiales (CNES), is dedicated to the study of clouds and aerosols from the troposphere to the stratosphere (Winker et al., 2010). As a part of the A-Train constellation, the satellite is in polar orbit at 705 km, provid-ing measurements at 01:30 and 13:30 LT with a repeat cycle of 16 days. Since June 2006, the CALIOP lidar measures backscatter profiles at 532 nm and 1064 nm, and depolariza-tion at 532 nm with a vertical resoludepolariza-tion of around 200 m in the stratosphere (Hostetler et al., 2006). Because of the low signal-to-noise ratio on individual profiles, the detection of aerosols in the stratosphere requires averaging. A method for deriving the Scattering Ratio (SR) (Eq. 1) has been de-veloped by Vernier et al. (2009). The procedure is based on averaging 532 nm nighttime-only measurements in one de-gree latitude bands (∼300 profiles) and further arranged into a regular grid of 1◦ latitude × 2◦ longitude and 200 m in altitude for the CALIPSO 16-day repeat cycle. To rectify a known CALIOP calibration deficiency that is particularly im-portant in the UT/LS, all data are corrected using the recali-bration technique described in Vernier et al. (2009). Artifacts in the CALIOP SR time series created by sudden changes in the GEOS-5 temperature at 36–39 km, the aerosol free altitude layer used for adjusting the calibration, have been removed by replacing the GEOS-5 temperatures with those of the ECMWF ERA-INTERIM reanalysis found to better match the temperatures observed by MLS/Aura (Schwartz et al., 2008). In addition, a mask for the South Atlantic Anomaly (SAA) has been applied with which all 532 nm
profiles showing dark noise greater than 100 photons in this area have been discarded (Hunt et al., 2009). Finally, clouds below 20 km have been filtered on the same grid by remov-ing all pixels for which the mean volume depolarization ratio (δ) is greater than 5 % using Eq. (2).
SR =βpart+βmol βmol (1) δ =β//+β⊥ β⊥ (2) where βmoland βpartrepresent the molecular and particulate
backscatter (note that the sum of both corresponds to the to-tal backscatter as reported by the CALIOP lidar). β⊥is the
perpendicular backscatter at 532 nm measured by CALIOP which is sensitive to aspherical particles such as ice crystals.
β//is the parallel backscatter at 532 nm.
Shown in Fig. 1 is the resulting evolution of the CALIOP zonal mean SR between 14–30 km within the 20◦N–20◦S
tropical band (after removing the SAA) from the beginning of the mission in June 2006 until October 2009. This is com-plemented by Fig. 2, which represents the time/latitude cross sections of the same quantity at four potential temperature levels: 380 K (17 km), 420 K (18.5 km), 460 K (20 km) and 500 K (21.5 km). The blank section in February–March 2009 on both figures is due to an interruption of the CALIOP mea-surements.
Several volcanic events with a Volcanic Explosivity Index (VEI) of 4, listed in Table 1, can be seen in the tropics in Fig.1 as well as at mid-latitudes (Fig. 2) with SR values greater than 1.2. The largest feature is associated with the eruption of the Soufriere Hills volcano (index 1 in Figs. 1 and 2) on Montserrat Island in the Caribbean on 20 May 2006. The plume remained in the tropics at 18–20 km (460 K) for 4–5 months before starting to ascend into the tropical stratosphere eventually reaching 25 km more than a year later. A second volcanic feature, less intense, is seen in October–December 2006 after the eruption of the Tavurvur (2) cone of the Rabaul volcano in Papua-New Guinea on 7 October. The lifetime of this plume is much shorter than the first one as it is rapidly transported to mid-latitudes at isentropic levels from 360 to 440 K (Fig. 2) and replaced by air of low aerosol concentra-tion in the tropics. Other volcanic plumes can be seen dur-ing the summers 2008 and 2009 in the Northern Hemisphere (NH) after the eruption of Kasatochi (5) in Alaska (US) on 7 August 2008 (Bourassa et al., 2010) and Sarychev (7) in Kamchatka (Russia) on 12 June 2009. Both plumes are fur-ther transported to the norfur-thern tropics, but more rapidly at lower (380 K) than at higher levels (460 K) (Fig. 2), creating an apparent ascent in the tropics (Fig. 1). The remaining fea-ture seen at 480–520 K (21 km) in March–April 2009 after the data gap (Figs. 1 and 2), with a SR between 1.10–1.20, is not the signature of a volcano but of soot particles (6) from an extreme biomass-burning episode near Melbourne in Vic-toria (southern Australia) on 7 February 2009 (Trepte et al., 2009). 1 2 3 4 5 6 7
Fig. 1. Mean CALIOP Scattering Ratio (SR) (contour steps 0.02)
between 14–30 km and 20◦S–20◦N from June 2006 to October 2009 after removing cloudy pixels of depolarization ratio at 532 nm greater than 5 %. The precision of the SR profiles is 2 %, the vertical resolution 200 m and the time resolution 16 days. Shown by white lines are temperature potential levels at 380, 420, 460 and 500 K. Each identified plume is indexed and listed in Table 1.
Table 1. List of volcanic eruptions with their corresponding
Vol-canic Explosivity Index (VEI) or fires that have produced a plume detected by CALIPSO during the 2006–2009 period.
Volcano/Fire Date Latitude VEI Soufri`ere Hills (1) 20-May-06 16◦N 4? Tavurvur (2) 7-Oct-06 4◦S 4? Jebel Al-Tair (3) 30-Sep-07 15◦N 4? Okmok (4) 12-Jul-08 55◦N 4 Kasatochi (5) 7-Aug-08 55◦N 4 Fire/Victoria (6) 7-Feb-09 37◦S Sarychev (7) 12-Jun-09 48◦N 4?
In addition to these events, aerosol layers (index M in Fig. 2) are also present at 360–400 K from June to Septem-ber, more intense in the Northern Hemisphere subtropics and at mid-latitudes, when no volcanic events could be identified in 2006 and 2008. These aerosol layers appear every year during the Asian monsoon period, extending from Western Asia to Eastern Mediterranean (Vernier et al., 2011a). The monthly mean latitude-height cross-sections between June and September in 2007 over Asia (not shown), indicates that they do not come from an old volcanic plume transported southward across the weak barrier afforded by the NH sum-mer jet stream (Chen, 1995; Dunkerton, 1995), but rather from the deep convective outflow of the Asian monsoon.
Besides those features, the “clean air” events are partic-ularly noteworthy. These events have a scattering ratio less than 1.04 that form near the base of the TTL (∼14 km) and propagate rapidly upward. Since the CALIOP lidar at 532 nm
1 1 1 2 3 3 4 5 5 5 6 7 7 7 M M M M 2
Fig. 2. Latitude-time cross-sections of CALIOP SR within 40 K (1.5 km) thick layers centred at 380 K (17 km), 420 K (18.5 km), 460 K
(20 km) and 500 K (21.5 km) from June 2006 until October 2009. The black dotted curve shows the timing of the uplift of clean air if it was due to slow ascent by radiative heating as calculated by Yang et al. (2008). Letter M corresponds to the aerosol feature associated with the Asian monsoon.
is primarily sensitive to particles with radii larger than 30 nm, a “clean air” event refers to air masses with low densities of such particles. The first event in early 2007 can be seen from 14 to 18 km (360–440 K), more pronounced in the tropics and that rapidly replaced the Tavurvur plume. A similar episode occurred during the same season in 2008, a year undisturbed by volcanoes and fires, the lower stratosphere being cleansed up to 19–20 km and remained relatively aerosol-free until the following year between 18 and 21 km (440–520 K). The ver-tical propagation of the clean air during the NH winter 2007– 2008 is compared in Fig. 2 to the theoretical ascent of the lowest bulb of clean air from 380 K to 500 K using Yang et al. (2008) estimations. The observed propagation is much more rapid than the one deduced from the radiative ascent model.
Though of higher resolution and free of clouds interfer-ence in the CALIOP data, the cleansing of the lower strato-sphere during the NH winter-spring, resulting in an aerosol annual cycle, was observed by SAGE II at 18 km between 1998–2005 (Thomason et al., 2008). It is also confirmed by independent balloon measurements in the tropics within the SCOUT-O3 project shown in Fig. 3 displaying: (i) the SR derived from the particle size distribution of an optical parti-cle counter (OPC, Deshler et al., 2003) during a flight in May 2008 from Teresina in Brazil at 5◦S, (ii) the mean SR pro-file measured by backscattersondes (BKS, Rosen and Kjome, 1991) flown in September 2008 at 12◦N in Niamey, Niger. Both are compared to the mean CALIOP SR within a box of
Fig. 3. Left: SR (red) derived from the aerosol size distribution of
a balloon-borne Optical Particle Counter at 5◦S in Brazil in May 2008; right: mean scattering ratio reported by BKS sondes at 12◦N in Niger in September 2008; both compared to CALIOP SR within a box of ±7◦latitude ±70◦longitude centred at the location of the balloon flight.
±7◦latitude ±70◦longitude centered at the respective bal-loon locations. Both balbal-loon data show a drop of SR between 17 and 20 km consistent with that reported by CALIOP. The peaks below 17 km in the BKS profile are due to the pres-ence of high altitude clouds that are discarded in the CALIOP analysis. The aerosol enhancement observed by CALIOP at and below 17 km in September 2008 is due to the debris of
Fig. 4. Latitude-height cross-sections of mean CALIOP SR from September 2007 to August 2008 every two months. Shown by white lines
are temperature potential levels at 380, 420, 460 and 500 K and by red lines the mean cloud top height (zonal mean depolarization ratio = 5 %).
the Alaskan volcano in the northern part of the ±7◦latitude box (at 360–400 K in Fig. 2).
Features such as volcanic or soot plumes are observed in the tropical and extra tropical UT/LS during the first 40 months of the CALIPSO mission providing unprecedented insight into their vertical and meridional transport. The Soufriere Hills plume is slowly transported in the middle stratosphere at an average velocity of 300 m months−1by the Brewer-Dobson circulation and displays features similar to that of the well known water vapor tape recorder (Rosenlof et al., 1995; Mote et al., 1996). The meridional transport of the plume in or out of the tropics is shown to depend on the altitude, faster at lower levels and becoming gradually in-hibited at increasing altitude until reaching the tropical pipe (Plumb, 1996). This is consistent with the drop of ozone variability at this level reported using circumnavigating long-duration balloon measurements by Borchi et al. (2007). On the other hand, the volcanic plumes in the TTL and tropical lower stratosphere are shown to disappear more quickly than expected based solely on meridional transport but are also influenced by clean air episodes especially pronounced be-tween 20◦S–10◦N during the Northern Hemisphere Winter at 14–20 km (Figs. 1 and 2). The only period undisturbed by additional aerosol input is the 2008 NH winter during which the clean air is observed to propagate rapidly in the TTL and lower stratosphere up to 19–20 km.
3 Location and vertical propagation of the cleansing
Since the low signal-to-noise ratio of CALIOP does not allow constructing SR maps between 15 and 20 km with a tempo-ral resolution of less than 2 months, and the Quasi Biennal Oscillation (QBO) was in its easterly phase during the winter 2008 with zonal wind speed of around −15 m s−1at 50 hPa (www.cpc.noaa.gov/data/indices/qbo.u50.index), an air mass in the tropical lower stratosphere was circumnavigating twice during this two-month period, making it difficult to deter-mine a possible longitudinal dependence of the cleansing.
We then choose to look at two-month cross-sections shown in Fig. 2 for October 2007 through September 2008 annotated with the mean zonal cloud top in red in Fig. 4. The zonal cloud top is determined using the mean zonal depolarization ratio (δ), derived from the statistics of cloudy/aerosols pixels separation as described in Sect. 2. From this figure, it can be seen that the cleansing of the UTLS starts in October/November 2007 and continues in December/January with SR values falling below 1.04 be-tween 14 km to 17 km. The low aerosol region propagates between 20◦S–5◦N in phase with the latitude of cloud tops. The cleanest period occurs in February–March where low SR values reach altitudes as high as 20 km, 2–3 km higher than cloud tops, making the whole TTL and the lower stratosphere virtually free of aerosol. Later in April–May, an isolated
2.5 m/s
Fig. 5. Evolution of the mean SR between 14–17 km from CALIPSO. Superimposed are, in red, the mean ITCZ latitudinal location as
revealed by the 10th and 90th percentile frequency of MCS and in white, that of cirrus clouds, given respectively by the TRMM PR and CALIPSO. The cloudy pixel from CALIPSO are determined using the depolarization ratio channel. The white arrows represent the mean meridionnal component of ECMWF wind field every 16 days.
bulb of clean air is seen at 18–20 km between 10◦N–20◦S above cloud tops, which remains at this level until Septem-ber 2008. Also seen in April–May is the presence of an aerosol layer at 16–17 km, between 10–30◦N, reinforced and extended to higher latitude in June–July, before the arrival of the Kasatochi plume.
To shed light on the relationship between cleansing episodes and deep convection, Fig. 5 shows the latitudi-nal evolution of the SR between 14–17 km together with the location of the Inter Tropical Convergence Zone (ITCZ) at 14 km as inferred from the TRMM Mesoscale Convec-tive Systems (MCS) position (red) and the CALIPSO cloud cover (white). White arrows show the mean meridional wind every 16 days derived from ECMWF at 100 hPa. The TRMM MCSs are selected by considering contiguous pre-cipitating areas greater than 2000 km2of radar signal larger than 20 dBZ reaching at least 14 km, with a minimum of 2 flashes as observed by the Lightning Imaging Sensor (LIS) also on TRMM. The flash discrimination is chosen to se-lect only MCSs with strong updrafts inducing hail formation and lightning. All MCSs are extracted with those four condi-tions from the TRMM database (http://trmm.chpc.utah.edu/) from June 2006 to February 2009 and sorted into 16-day bins comparable to CALIPSO. The limits of the ITCZ (red line) from these observations are derived using the 10th and 90th percentile of latitudinal position of MCSs. The CALIPSO cloud area is derived from the depolarization channel as de-scribed above (Fig. 4). As above, the bounds of clouds are defined by the 10th and 90th percentile latitudinal location of cloudy pixels. The term “cloudy pixels” represents all types of clouds observed by CALIPSO including storms, anvils and cirrus. During the NH winter, the clouds extend to higher latitude than the ITCZ defined by the MCSs location likely
due to the persistent thick cirrus cloud layer up to 10◦N in the West Pacific where the tropopause is the highest and coldest (Sassen et al., 2009). In contrast, the ITCZ area extends to higher latitudes than the clouds at 14–17 km in the summer of both hemispheres and particularly in the North. This is likely due to the less frequent clouds during CALIPSO over-passes at 01:40 a.m. and p.m. over land convective regions (monsoon in the north) whereas cloud cover exhibits a large diurnal cycle with a strong maximum around 16:00–17:00 h local (Liu and Zipser, 2005).
Aside from volcanic plumes during the NH winter 2006 (Tavurvur, 0–20◦S) and the NH summers of 2008 and 2009
(Kasatochi, Sarychev, 20–50◦N), the aerosols in the TTL
show an annual cycle. The maximum cleansing of the 14– 17 km layer is located in the middle of the ITCZ area in the Southern Hemisphere (5◦S–25◦S) during the northern win-ter but extends further north and south than the limits of the ITCZ area. As shown by the meridional wind arrows, this altitude level corresponds to the upper branch of the trade wind Hadley cell which is associated with the advection of airmasses from the ITCZ to the subtropics where there is no more convection. In contrast, it is the opposite in the North-ern Hemisphere summer, where a maximum aerosols load is observed between 20–40◦N in the northern part of the ITCZ area. Thus, the impact of convection on the TTL aerosols load may depends on the amount of aerosols available at the surface.
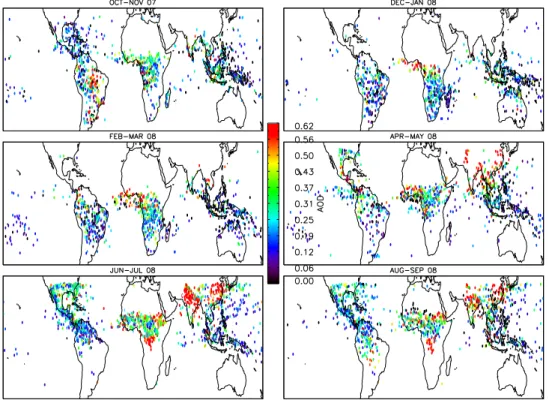
Fig. 6. Bimonthly maps from October 2007 to September 2008 of TRMM Mesoscale Convective Systems (MCS > 14 km) tagged with
MODIS Aerosol Optical Depth. The nearest AOD value of each MCS was extracted from MODIS AOD grids with a temporal and spatial resolution of 2 days and 3◦lon × 3◦lat. MCS that could not be tagged where no AOD value was available are in black. The AOD fields have been constructed using the MODIS Level 3 daily joint aerosol/water vapor/cloud product of the Terra space borne platform that cross the equator at 10:30 a.m. LT.
4 Modulation of the aerosol loading in the TTL by deep convection
As previously shown, the cleansing of the lower stratosphere is correlated with the southern tropics convective season, but if not anticorrelated with the Northern Hemisphere season. We evaluate the convective transport of low versus high aerosol loading of tropospheric air masses in the TTL by studying the geographical position of MCSs as seen by the TRMM radar relative to the amount of aerosols in the troposphere. Since deep convection is known to show a pronounced diurnal cycle of peak intensity in late afternoon (Liu and Zipser, 2005), we have used the Aerosol Optical Depth (AOD) from MODIS on the TERRA satellite platform at 10:30 a.m. LT. Figure 6 represents bimonthly maps from October 2007 to September 2008 of MCS locations reaching at least 14 km tagged with the nearest value of MODIS AOD in space and time. Since more than one day of observations is required to obtain a complete spatial coverage, two days mean AOD maps have been constructed with a spatial resolution of 3◦lon × 3◦lat from the MODIS level 3 daily joint aerosol/water vapor and cloud product. As shown by Liu and Zipser (2005), the maps indicate that deep convection is dominant over land
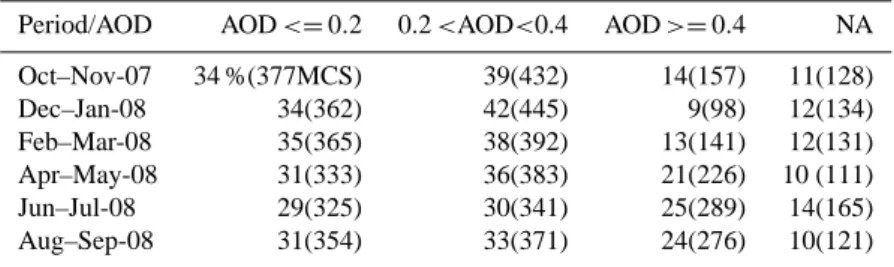
during the local summer convective season. The statistics of tagged-AOD MCSs is given in Table 2 for the different maps of Fig. 6. In October–November, the maximum of potential aerosols lofting occurs over East Amazonia next to the arid N-E Brazil, where a maximum CO in the lower stratosphere was also reported by Schoeberl et al. (2006). In December–January 2008, the convective activity is greatest above the continents of the Southern Hemisphere, in South America, South Africa, Indonesia and northern Australia. MCS occurred in relative clean environment (AOD < 0.4) 73 % of the time except in Central Africa where convection coincides with the beginning of biomass burning season as shown by the number of fires associated with CO emission (http://earthobservatory.nasa.gov/GlobalMaps/view.php? d1=MODAL2 M AER OD\&d2=MOD14A1 M FIRE). During this period, the Harmattan wind from the north-east advects Saharan dust towards MCSs in Western Africa. Later in the winter season (February–March 2008), the ITCZ and land convection have moved northward but still remain in clean tropospheric conditions with 76 % of MCS with AOD < 0.4. In early spring, in April–May, the aerosol loading associated with convection increases (MCS of AOD > 0.4) by 10 % compared to previous periods. This polluted convection occurs primarily in Western and Central
Table 2. Percentage (number) of Mesoscale Convective Systems (MCS) that was tagged with: AOD <= 0.2 (column 1), 0.2 < AOD < 0.4
(column 2) and AOD >= 0.4 (column 3). The last column shows the percentage of events that could not be tagged.
Period/AOD AOD <= 0.2 0.2 <AOD<0.4 AOD >= 0.4 NA Oct–Nov-07 34 %(377MCS) 39(432) 14(157) 11(128) Dec–Jan-08 34(362) 42(445) 9(98) 12(134) Feb–Mar-08 35(365) 38(392) 13(141) 12(131) Apr–May-08 31(333) 36(383) 21(226) 10 (111) Jun–Jul-08 29(325) 30(341) 25(289) 14(165) Aug–Sep-08 31(354) 33(371) 24(276) 10(121)
African regions of biomass burning and Saharan dust, but also in South East Asia when the monsoon onset is reaching the Bay of Bengal and Thailand. The highest level of aerosol associated with convection occurs during the NH summer (June–July 2008 and August–September 2008), where 25 % of MCSs are associated with AOD > 0.4 and 65 % of MCS tagged with extreme AOD values (>0.6) are located over Southeast Asia (NE China and NW India). As shown by Dey et al. (2010), polluted aerosols with dust dominate the pop-ulation of particles especially in northeast India and along the Indo-Ganges basin. Deep convection occurring over those regions could transport aerosols upwards, confirming the possible convective origin of an elevated layer observed during the Asian monsoon reported by Vernier et al. (2011a). To better quantify the impact of convection on the TTL aerosol load, we have created an Aerosol Index (AI, Eq. 3) that is the average of the tagged MCS-AOD occurring within a 16-days period in a particular latitude band. It is given by AI(t) = 1 N X n=1,N MCS(n,t) × AOD(n,t ), (3)
where n is the index of each MCS (N the total) occurring in the time and space resolution as described below. The AI has been computed from TRMM and CloudSat MCSs ex-tracted for the later one from the University of Utah database (http://trmm.chpc.utah.edu) by selecting convective events reaching 14 km of at least 500 km horizontal extension. Fig-ure 7 shows a comparison between this index and the mean CALIOP SR between 14 and 17 km. To emphasize the ef-fect of deep convection on the TTL aerosols, we have cal-culated the mean CALIOP SR within the ITCZ from the 10th and 90th percentile CALIPSO cloudy pixels (latitude band within the white line in Fig. 5). Since volcanic plumes from Tavurvur and Sarychev contaminate the years of 2006 and 2009, respectively (Figs. 1, 2 and 5), we focus on the 2007–2008 period. The annual cycle of TTL aerosols from CALIPSO is well matched by the AI deep convection-AOD model without significant phase lag using TRMM as well as CloudSat. However, the strong summer time CALIPSO SR
peak is not seen on the AI that rather shows a slight maxi-mum expending from April to November.
The relationship between AI and CALIPSO SR is reason-able, indicating that air masses transported by deep convec-tion from the relatively clean surfaces of the southern trop-ics (Congo, Amazonia and Indonesian Islands) may be in-deed responsible for the cleansing of the TTL during the NH winter. The contrast between the convective cleansing ob-served in the South and the reinforcement of aerosols in the TTL in the North is consistent with the increased AI during the NH summer by convective lofting of natural and anthro-pogenic aerosols during the Asian and African monsoon sea-sons (Fig. 7).
However, the rapid cleansing of the TTL up to 19–20 km during the SH convective season shows significantly higher vertical propagation than of the aerosol enhancement in the NH convective season that is limited to 16–17 km. This might be related to the influence of the aerosols on convec-tion intensity. Rosenfeld et al. (2008) suggested that the vig-orous convection as inferred from the Convective Available Potential Energy is maximum with AOD close to 0.25. This value is remarkably close to the lowest AI values reach (that represent also a mean AOD) in the Southern tropics during the NH winter when the cleansing is more intense, reaching as high as 19–20 km.
5 Impact of overshooting updrafts at the global scale
The mass flux of tropospheric air required for explaining the cleansing of the TTL during the SH convective season was tentatively derived from the drop of aerosol observed dur-ing the period November 2007–February 2008 (Fig. 5). Fig-ure 8 illustrates the conceptual model used to calculate the time constant of dilution and the total mass flux between the troposphere and the stratosphere corresponding to the up-drafts. As detailed in Appendix A, a mass conservation flux is applied to the rectangle on the top of the anvil to estimate the amount of clean tropospheric air required at a level z to cleanse up the lower stratosphere. Assuming a constant size distribution and similar composition for the aerosols populat-ing the UTLS, the CALIOP (SR-1) (SR-1 = βpart/βmol)can
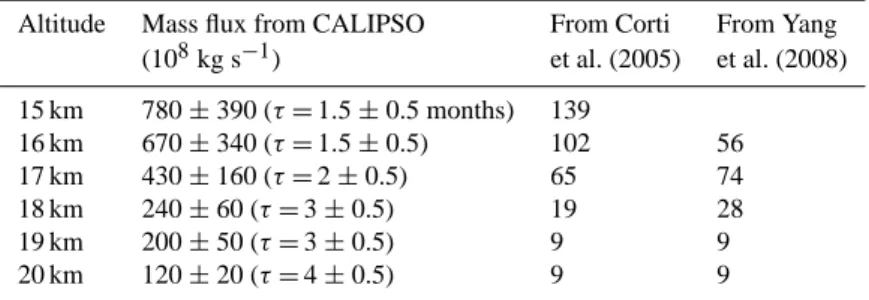
Table 3. Average mass flux in 108kg s−1 and time constant (τ ) in month, required for a (SR-1) decrease by 63 % in the TTL between 20◦S–0◦S between 15 km–20 km. Values are derived from the overshoot dilution model (Appendix A) and compared to radiative heating calculations by Corti et al. (2005) on yearly average basis and by Yang et al. (2008) during the NH winter only.
Altitude Mass flux from CALIPSO From Corti From Yang (108kg s−1) et al. (2005) et al. (2008) 15 km 780 ± 390 (τ = 1.5 ± 0.5 months) 139 16 km 670 ± 340 (τ = 1.5 ± 0.5) 102 56 17 km 430 ± 160 (τ = 2 ± 0.5) 65 74 18 km 240 ± 60 (τ = 3 ± 0.5) 19 28 19 km 200 ± 50 (τ = 3 ± 0.5) 9 9 20 km 120 ± 20 (τ = 4 ± 0.5) 9 9
be considered to be proportional to an aerosol mixing ra-tio. After applying the mass and aerosol mixing ratio flux conservation, the aerosol mixing ratio is shown to follow an e-folding law, where t , the time constant required for (SR-1) to decrease by 63 %, is directly proportional to the mass flux. The time t required for such reduction in CALIOP ob-servations ranges from 1.5 ± 0.5 months at 15 km, to 3 ± 0.5 months at 18 km, and 4 ± 0.5 months at 20 km (Table 3). The fluxes corresponding to the cleansing of each layer at global scale shown in Table 3, are 780 ± 390 × 108kg s−1at 15 km and 240 ± 60 × 108kg s−1at 18 km. Below 18 km, they are 5 to 12 times larger than those derived from radiative heat-ing calculations by Corti et al. (2005) and Yang et al. (2008). At the higher levels, at 18–20 km, they are even larger (up 20 times), showing that convective overshooting could be a large contributor to the cleansing of the lower tropical strato-sphere.
There are, however, some limitations in the validity of the method used in the above calculations. The conversion of the Scattering Ratio into an aerosol-mixing ratio required a constant phase function in time and altitude meaning that aerosol composition and size distribution remained the same. However, even if, as measured by Froyd et al. (2009) over Costa Rica, the aerosols above the tropopause are for 75 % made of sulphate-organic particles, 20 % of them were of carbonaceous material. Since organics particles are known to be more absorbing than scattering, this would imply that the phase function used in the conversion would not be con-servative below the tropopause. In addition the calculation applies only if aerosols are long lifetime tracers, insensitive to changes by microphysical processes. But since sulfate-organic particles are dominants in the convective SH region and microphysical processes have little impact on these as discussed below, the above limitations are expected to have little impact on the conclusions.
Fig. 7. CALIPSO mean SR between 14–17 km (black line) within
the “ITCZ area” delimited by the 10th and 90th percentile of the CALIPSO cloudy pixel product derived from the depolarization (Fig. 5). The Aerosol Indices are derived from TRMM (red solid line) and CloudSat (dotted red line) MCSs located between 20◦N– 20◦S.
6 Discussion
Although there is clear indication of the surface origin of the clean air and its transport in the lower stratosphere by con-vective updraft, other processes could potentially contribute for explaining them and the difference between the northern and Southern Hemispheres. They are briefly discussed be-low.
6.1 Cleansing mechanisms
Several mechanisms can be invoked which could potentially contribute to the cleansing of the aerosols in the TTL: (i) a decrease of the particles size by microphysical processes making them less efficient to scattering light; (ii) the capture of the aerosols by cirrus clouds followed by sedimentation; and (iii) a fast sedimentation of the particles.
6.1.1 Particle size reduction
A significant fraction of particles in the TTL seems to be composed of sulfate-organic mixing (Fryod et al., 2009). It
Fig. 8. Schematic of the TTL aerosol-cleansing model by
over-shooting towers.
has been shown by Steel and Hamill (1981) that sulfate par-ticles can growth significantly in the presence of water vapor at low temperature and thus result in SR-1 enhancements. The amplitude of the effect depends on the initial concentra-tion of the particles and the amount of nitric acid (HNO3)
available. Assuming an initial concentration of sulfate of 10 particles cm−3 and using water vapor, temperature and
HNO3observations from MLS/Aura, the Mie SR-1 increase
was shown to not exceed 10 % in the worst case, mainly be-cause of the very low HNO3concentration near the tropical
tropopause. The change in retrieved aerosols profiles is not significant.
6.1.2 Capture by cirrus clouds
Another process could be the capture of aerosol particles in cirrus clouds. Indeed, if aerosols served as condensation nu-clei for cirrus formation, they could be removed by the fur-ther sedimentation of cirrus ice crystals. However, as shown by high altitude aircraft sampling above Costa-Rica during the Pre-AVE campaign (Froyd et al., 2009), the aerosols above the tropopause associated to Amazonian convective systems are mainly sulfate-organic particles of <0.1 µm di-ameter resulting in very limited freezing (Froyd et al., 2010). However, this could be different in the Northern Hemisphere, since, in contrast, mineral dust and black carbon particles can act as efficient heterogeneous ice nuclei forming ice crystals (Froyd et al., 2010 and references therein). In conclusion, if such process contributes to the 16–17 km altitude limitation of the aerosols in Northern Hemisphere, it cannot explain the cleansing in the Southern Hemisphere during the convective season.
6.1.3 Aerosol sedimentation
Sulfate or sulfate-organic particles of 0.1–0.2 µm radius, as observed in the tropical lower stratosphere by the optical particle counter over Northern Brazil (Fig. 3) or Costa-Rica (Froyd et al., 2010), are falling at a rate of less than 0.1 km month−1at 18 km altitude. About ∼40 months would be required for them to drop from 18 to 14 km, which is far too slow for explaining the cleansing. However, this is not true for larger mineral dust particles of ∼1 µm diameter above the Asian sector (Anderson et al., 2003), which will be falling by 1 km month−1at 18 km, and thus could explain the limited altitude of the aerosols layer in the Northern Hemi-sphere during the monsoon season.
In conclusion, apart from the freezing and the sedimenta-tion of large mineral dust particles which might explain the absence of aerosols enhancements above 17 km during the Northern Hemisphere summer, there is no indication that the above processes could contribute significantly to the cleans-ing of the lower stratosphere in the Southern Hemisphere.
6.2 Vertical transport processes
Aside from deep convective updraft, other potential con-tributing processes include slow ascent by radiative heat-ing, vertical turbulent diffusivity and gravity waves. As al-ready shown, the ascent by radiative heating at a rate of less than 0.4 mm s−1or 1 km month−1(Yang et al., 2008) will re-quire 6–9 months for an air mass to reach 20 km from the tropopause, that is far too slow for explaining the observa-tions. It cannot contribute for more than 10 % to the zonal mean flux. The same conclusion applies to the average ver-tical turbulent diffusivity of 0.02 m2s−1derived by Mote et
al. (1998) from the total hydrogen profiles of the Halogen Occultation Experiment which would require about 5 yr for a one kilometre rise. Even with the upper bound equivalent diffusivity of 0.5 m2s−1derived by Pisso and Legras (2008) from balloon ozone and water vapor profiles measurements during the HIBISCUS campaign in Brazil, thus including tur-bulent diffusivity and gravity waves, it would take 2.5 months for a one-kilometer uplift. The only remaining explanation is thus frequent injections of clean tropospheric air by convec-tive overshooting that would progressively dilute the aerosols and clean the lower stratosphere. Since the overshooting fre-quency is known to decrease at increasing altitude (Liu and Zipser, 2005), the amplitude of dilution will also decrease with altitude, which is what is observed. This scheme is con-sistent with the observations of geyser-like injections of ice particles in the lower tropical stratosphere up to 19 km over land convective regions (Nielsen et al., 2007; Corti et al., 2008; Khaykin et al., 2009) implying a hydration process of the lower stratosphere, as well as the injection of adiabati-cally cooled air modifying its thermal structure (Pommereau et al., 2011). It would also be consistent with the larger N2O,
tropical continents in contrast to oceans, as well as their sea-sonal variation reported by Ricaud et al. (2007, 2009) or Schoeberl et al. (2008). It will imply a top TTL, the re-gion sharing tropospheric and stratospheric characteristics, around 20 km, higher than generally assumed (Fueglistaler et al., 2008). Finally, it will result in the fast transport of chemically reactive Very Short-Lived Species (VSLS) in the lower stratosphere with their possible impact on ozone chem-istry. However, if such deep overshooting events and the re-sulting hydration of the lower stratosphere are well captured by non-hydrostatic meso-scale cloud resolving model simu-lations (e.g. Chaboureau et al., 2007; Grosvenor et al., 2007; Jenssen et al., 2007), they are poorly, if at all, represented by global Chemistry Transport Models (CTM) forced by Nu-merical Weather Forecast (NWP) Models, enable to repro-duce the impact of such events at global scale.
7 Conclusions
The three-year CALIOP aerosols profiles in the tropics reveal the existence of a fast cleansing process of the lower strato-sphere up to 20 km. It is shown to take place in the Southern Hemisphere during the convective season, where overshoot-ing systems seen by the TRMM precipitation radar are occur-ring in clean regions of the troposphere over African, South-American rain forests and the Indonesian islands, as shown by the minimum MODIS Aerosols Optical Depth over these areas.
Such cleansing would be consistent with repeated injec-tions of relatively clean air by overshooting updrafts in the air masses circumnavigating within less than two months in the tropical lower stratosphere, resulting in the progressive dilution of aerosols present there. The tropospheric air flux by those events might be 5–20 times larger than that corre-sponding to the previously assumed slow ascent by radiative heating. The fast extension of the cleansing to the northern tropics and the southern sub-topical lower stratosphere dur-ing the same season is consistent with the advection of the clean air injected at this level in the ITCZ region by the up-per branch the Hadley cell. In contrast to the cleansing dur-ing the Southern Hemisphere summer, the aerosol increase observed in the Northern Hemisphere during the convective season, consistent with the large MODIS AOD within 10◦– 40◦N over South Asia, suggesting instead, an injection of desert mineral dust and soot from biomass burning, but lim-ited to around 16–17 km probably because of their fast sedi-mentation at higher altitude. The CALIPSO aerosols obser-vations suggest that convective overshooting might be a ma-jor contributor of troposphere-to-stratosphere transport, with the many implications on the TTL top height, hydration, pho-tochemistry and thermal structure of the lower stratosphere, a mechanism well captured by non-hydrostatic meso-scale models but missed by global meteorological and climatic models.
Appendix A
Overshoot updrafts mass flux
As shown by the conceptual overshoot model in Fig. 8, the mass flux conservation in the TTL can be written:
Dc−Ec+Dext−Eext=0 (A1)
where,
– Dc is the convective flow (D for Detrainment) (unit
kg m−1s−1)
– Ecis that extracted (E for Entrainment)
– Dextis the input from horizontal transport and
– Eextthe horizontal outflow.
Neglecting the weak transport from mid-latitudes to the tropics allows simplifying Eq. (A1) in:
Dc−E =0 (with E = Ec−Eext) (A2)
The change of aerosol mixing ratio, χ , due to the mixing with clean air can be expressed:
ρ · A ·∂χ
∂t =Dc·χc−E · χ (A3)
where ρ is the air density, A the surface of the layer, and χc
the aerosol mixing ratio in the convective cloud. The solution of Eq. (A3) is:
χ (t ) = (χ0−χc)e
Dc ρA·t+χ
c (A4)
where χ0is the initial aerosol mixing ratio in the layer and
χ (t )its change following an e-folding law, with τ = ρA/Dc
assuming that the aerosol-mixing ratio in the convective cloud is negligible (clean air, χc=0).
Since, τ is the time required for reducing the aerosol mix-ing ratio by 63 %, the inflow Fc within each 1 km thick layer between 15–20 km can be expressed:
Fc=D
0
c·1Z =
1ZρA τ
Assuming that the CALIPSO backscatter ratio (SR-1 =βmie
βray)
is proportional to the aerosol mixing ratio. The tropospheric air flux required for cleansing the TTL can be derived from the decrease of CALIOP mean SR from November 2007 to February 2008 between 20◦S–0◦S shown in Fig. 5 using Eq. (A4). The resulting fluxes are displayed in Table 1.
Acknowledgements. This work was part of the PhD thesis of
JPV financed by the Centre National la Recherche Scientifique at LATMOS/UVSQ in France now on a NASA Postdoctoral Program at Langley Research Center, administrated by Oak Ridge Associated Universities. The research was supported by the CNES CALIPSO and European SCOUT-O3 projects.
The CALIOP data were made available at the ICARE data center (http://www-icare.univ-lille1.fr/) and processed at NASA LaRC. The authors want also to thank the University of Utah for providing the TRMM and CloudSat MCS searching sys-tem (http://trmm.chpc.utah.edu/). The author wants to thank Kristina Ruhlman for making the conceptual view of overshoot in Fig. 7, Jay Kar for the processing of the Aerosol Optical Depth data from the CALIPSO level 2 products and P. Lucker for her help in the processing of the CALIPSO level 1 data. Finally, we gratefully acknowledge L. Pool for his microphysical calculation on the size-dependence of sulfate particles according to the temperature, nitric acid and water vapor mixing ratio.
Edited by: T. J. Dunkerton
The publication of this article is financed by CNRS-INSU.
References
Anderson, T. L., Masonis, S. J., Covert, D. S., Ahlquist, N. C., Howell, S. G., Clarke, A. D., and McNaughton, C. S.: Vari-ability of aerosol optical properties derived from in situ aircraft measurements during ACE-Asia, J. Geophys. Res., 108, 8647, doi:10.1029/2002JD003247, 2003.
Borchi, F. and Pommereau, J.-P.: Evaluation of ozonesondes, HALOE, SAGE II and III, Odin- OSIRIS and -SMR, and ENVISAT-GOMOS, -SCIAMACHY and -MIPAS ozone pro-files in the tropics from SAOZ long duration balloon measure-ments in 2003 and 2004, Atmos. Chem. Phys., 7, 2671–2690, doi:10.5194/acp-7-2671-2007, 2007.
Bourassa, A. E., Degenstein, D. A., Elash, B. J., and Llewellyn, E. J.: Evolution of the stratospheric aerosol enhancement following the eruptions of Okmok and Kasatochi: Odin-OSIRIS measurements, J. Geophys. Res., 115, D00L03, doi:10.1029/2009JD013274, 2010.
Borrmann, S., Kunkel, D., Weigel, R., Minikin, A., Deshler, T., Wilson, J. C., Curtius, J., Volk, C. M., Homan, C. D., Ulanovsky, A., Ravegnani, F., Viciani, S., Shur, G. N., Belyaev, G. V., Law, K. S., and Cairo, F.: Aerosols in the tropical and subtropical UT/LS: in-situ measurements of submicron particle abundance and volatility, Atmos. Chem. Phys., 10, 5573–5592, doi:10.5194/acp-10-5573-2010, 2010.
Brock, C. A., Hamill, P., Wilson, J. C., Jonsson, H. H., and Chan, K. R.: Particle formation in the upper tropical troposphere: A source of nuclei for the stratospheric aerosol, Science, 270, 1650–1653, 1995.
Brunner, D., Siegmund, P., May, P. T., Chappel, L., Schiller, C., M¨uller, R., Peter, T., Fueglistaler, S., MacKenzie, A. R., Fix, A., Schlager, H., Allen, G., Fjaeraa, A. M., Streibel, M., and Harris, N. R. P.: The SCOUT-O3 Darwin Aircraft Campaign:
rationale and meteorology, Atmos. Chem. Phys., 9, 93–117, doi:10.5194/acp-9-93-2009, 2009.
Cairo, F., Pommereau, J. P., Law, K. S., Schlager, H., Garnier, A., Fierli, F., Ern, M., Streibel, M., Arabas, S., Borrmann, S., Berthelier, J. J., Blom, C., Christensen, T., D’Amato, F., Di Don-francesco, G., Deshler, T., Diedhiou, A., Durry, G., Engelsen, O., Goutail, F., Harris, N. R. P., Kerstel, E. R. T., Khaykin, S., Konopka, P., Kylling, A., Larsen, N., Lebel, T., Liu, X., MacKen-zie, A. R., Nielsen, J., Oulanowski, A., Parker, D. J., Pelon, J., Polcher, J., Pyle, J. A., Ravegnani, F., Rivi`ere, E. D., Robin-son, A. D., R¨ockmann, T., Schiller, C., Sim˜oes, F., Stefanutti, L., Stroh, F., Some, L., Siegmund, P., Sitnikov, N., Vernier, J. P., Volk, C. M., Voigt, C., von Hobe, M., Viciani, S., and Yushkov, V.: An introduction to the SCOUT-AMMA stratospheric aircraft, balloons and sondes campaign in West Africa, August 2006: rationale and roadmap, Atmos. Chem. Phys., 10, 2237–2256, doi:10.5194/acp-10-2237-2010, 2010.
Chaboureau, J.-P., Cammas, J.-P., Duron, J., Mascart, P. J., Sitnikov, N. M., and Voessing, H.-J.: A numerical study of tropical cross-tropopause transport by convective overshoots, Atmos. Chem. Phys., 7, 1731–1740, doi:10.5194/acp-7-1731-2007, 2007. Chen, P.: Isentropic cross-tropopause mass exchange in
the extratropics, J. Geophys. Res., 100, 16661–16674, doi:10.1029/95JD01264, 1995.
Corti, T., Luo, B. P., Peter, P., V¨omel, H., and Fu, Q.: Mean ra-diative energy balance and vertical mass fluxes in the equatorial upper troposphere and lower stratosphere, Geophys. Res. Lett., 32, L06802, doi:10.1029/2004GL021889, 2005.
Corti, T., Luo, B. P., de Reus, M., Brunner, D., Cairo, F., Ma-honey, M. J., Martucci, G., Matthey, R., Mitev, V., dos Santos, F. H., Schiller, C., Shur, G., Sitnikov, N. M., Spelten, N., Voss-ing, H. J., Borrmann, S., and Peter, T.: Unprecedented evidence for overshooting convection hydrating the tropical stratosphere, Geophys. Res. Lett., 35, L10810, doi:10.1029/2008GL033641, 2008.
Danielsen, E. F.: A dehydration mechanism for the stratosphere, Geophys. Res. Lett., 9, 605–608, 1982.
Danielsen, E. F.: In situ evidence of rapid, vertical, irreversible transport of lower tropospheric air into the lower stratosphere by convective cloud turrets and by large scale up welling in tropical cyclones, J. Geophys. Res., 98, 8665–8681, 1993.
Deshler, T., Hervig, M. E., Hofmann, D. J., Rosen, J. M., and Liley, J. B.: Thirty years of in situ stratospheric aerosol size distribution measurements from Laramie, Wyoming (41N), us-ing balloon-borne instruments, J. Geophys. Res., 108, 4167, doi:10.1029/2002JD002514, 2003.
Dey, S. and Di Girolamo, L.: A climatology of aerosol op-tical and microphysical properties over the Indian subconti-nent from 9 years (2000–2008) of Multiangle Imaging Spec-troradiometer (MISR) data, J. Geophys. Res., 115, D15204, doi:10.1029/2009JD013395, 2010.
Dunkerton, T.: Evidence of meridional motion in the summer lower stratosphere adjacent to monsoon regions, J. Geophys. Res., 100, 16675–16688, 1995.
Froyd, K. D., Murphy, D. M., Sanford, T. J., Thomson, D. S., Wil-son, J. C., Pfister, L., and Lait, L.: Aerosol composition of the tropical upper troposphere, Atmos. Chem. Phys., 9, 4363–4385, doi:10.5194/acp-9-4363-2009, 2009.
and Herman, R. L.: Aerosols that form subvisible cirrus at the tropical tropopause, Atmos. Chem. Phys., 10, 209–218, doi:10.5194/acp-10-209-2010, 2010.
Fu, R., Hu, Y., Wright, J. S., Jiang, J. H., Dickinson, R. E., Chen, M., Filipiak, M., Read, W. G., Waters, J. W., and Wu, D. L.: Short circuit of water vapor and polluted air to the global stratosphere by convective transport over the Tibetan Plateau, P. Natl. Acad. Sci. USA, 103, 5664–5669, doi:10.1073/pnas.0601584103, 2006.
Fueglistaler, S., Dessler, A. E, Dunkerton, T. J., Folkins, I., Fu, Q., and Mote, P. W.: The tropical tropopause layer, Rev. Geophys., 47, RG1004, doi:10.1029/2008RG000267, 2008.
Gettelman, A. and de Forster, P. M.: A climatology of the Tropical Tropopause Layer, J. Met. Soc. Japan, 80, 911–924, 2002. Gettelman, A., Kinnison, D. E., Dunkerton, T. J., and Brasseur,
G. P.: Impact of monsoon circulations on the upper tropo-sphere and lower stratotropo-sphere, J. Geophys. Res., 109, D22101, doi:10.1029/2004JD004878, 2004.
Grosvenor, D. P., Choularton, T. W., Coe, H., and Held, G.: A study of the effect of overshooting deep convection on the wa-ter content of the TTL and lower stratosphere from Cloud Re-solving Model simulations, Atmos. Chem. Phys., 7, 4977–5002, doi:10.5194/acp-7-4977-2007, 2007.
Hamill, P., Jensen, E. J., Russell, P. B., and Bauman, J. J.: The life cycle of stratospheric aerosol particles, B. Am. Meteorol. Soc., 78, 1395–1410, 1997.
Holton, J. R., Haynes, P. H., McIntyre, M. E., Douglass, A. R., Rood, R. B., and Pfister, L.: Stratosphere-troposphere exchange, Rev. Geophys., 33, 403–439, 1995.
Hostetler, C. A., Liu, Z., Regan, J., Vaughan, M., Winker, D., Os-born, M., Hunt, W. H., Powell, K. A., and Trepte, C.: Caliop Al-gorithm Theoretical Basis Document (ATBD), Calibration and Level 1 Data Products, available at: https://www.calipso.larc. nasa.gov/resources/pdfs/PC-SCI-201v1.0.pdf, 2006.
Hunt, W. H., Winker, D. M., Vaughan, M. A., Powell, K. A., Lucker, P. L., and Weimer, C.: CALIPSO Lidar Description and Perfor-mance Assessment, J. Atmos. Oceanic Technol., 26, 1214–1228, 2009.
Jensen, E. J., Ackerman, A. S., and Smith J. A.: Can overshooting convection dehydrate the tropical tropopause layer?, J. Geophys. Res., 112, D11209, doi:10.1029/2006JD007943, 2007.
Khaykin, S., Pommereau, J.-P., Korshunov, L., Yushkov, V., Nielsen, J., Larsen, N., Christensen, T., Garnier, A., Lukyanov, A., and Williams, E.: Hydration of the lower stratosphere by ice crystal geysers over land convective systems, Atmos. Chem. Phys., 9, 2275–2287, doi:10.5194/acp-9-2275-2009, 2009. Liu, C. and Zipser, E. J.: Global distribution of convection
pene-trating the tropical tropopause, J. Geophys. Res., 110, D23104, doi:10.1029/2005JD006063, 2005.
Liu, C. and Zipser, E. J.: Implications of the day versus night dif-ferences of water vapor, carbon monoxide, and thin cloud ob-servations near the tropical tropopause, J. Geophys. Res., 114, D09303, doi:10.1029/2008JD011524, 2009.
McCormick, M. P., Thomason, L. W., and Trepte, C. R.: Atmo-spheric effects of the Mt. Pinatubo eruption, Nature, 373, 399– 404, doi:10.1038/373399a0, 1995.
Mote, P. W., Rosenlof, K. H., McIntyre, M. E., Carr, E. S., Gille, J. C., Holton, J. R., Kinnersley, J. S., Pumphrey, H. C., Russell, J. M., and Waters, J. W.: An atmospheric tape recorder: The
im-print of tropical tropopause temperatures on stratospheric water vapor, J. Geophys. Res., 101, 3989–4006, 1996.
Mote, P. W., Dunkerton, T. J., McIntyre, M. E., Ray, E. A., Haynes, P. H., Russel, III J. M.: Vertical velocity, vertical diffusion and dilution by midlatitude air in the tropical lower stratosphere, J. Geophys. Res., 103, 8651–8666, 1998.
Nielsen, J. K., Larsen, N., Cairo, F., Di Donfrancesco, G., Rosen, J. M., Durry, G., Held, G., and Pommereau, J. P.: Solid particles in the tropical lowest stratosphere, Atmos. Chem. Phys., 7, 685– 695, doi:10.5194/acp-7-685-2007, 2007.
Pisso, I. and Legras, B.: Turbulent vertical diffusivity in the sub-tropical stratosphere, Atmos. Chem. Phys., 8, 697–707, doi:10.5194/acp-8-697-2008, 2008.
Plumb, R.: A “tropical pipe” model of stratospheric transport, J. Geophys. Res., 101, 3957–3972, 1996.
Pommereau, J.-P., Garnier, A., Held, G., Gomes, A. M., Goutail, F., Durry, G., Borchi, F., Hauchecorne, A., Montoux, N., Coc-querez, P., Letrenne, G., Vial, F., Hertzog, A., Legras, B., Pisso, I., Pyle, J. A., Harris, N. R. P., Jones, R. L., Robinson, A. D., Hansford, G., Eden, L., Gardiner, T., Swann, N., Knudsen, B., Larsen, N., Nielsen, J. K., Christensen, T., Cairo, F., Fierli, F., Pirre, M., Mar´ecal, V., Huret, N., Rivi`ere, E. D., Coe, H., Grosvenor, D., Edvarsen, K., Di Donfrancesco, G., Ricaud, P., Berthelier, J.-J., Godefroy, M., Seran, E., Longo, K., and Fre-itas, S.: An overview of the HIBISCUS campaign, Atmos. Chem. Phys., 11, 2309–2339, doi:10.5194/acp-11-2309-2011, 2011. Randel, W. J., Park, M., Emmons, L., Kinnison, D., Bernath, P.,
Walker, K. A., Boone, C., and Pumphrey, H.: Asian Monsoon Transport of Pollution to the Stratosphere, Science, 328, 611– 613, doi:10.1126/science.1182274, 2010.
Ricaud, P., Barret, B., Atti´e, J.-L., Motte, E., Le Flochmo¨en, E., Teyss`edre, H., Peuch, V.-H., Livesey, N., Lambert, A., and Pommereau, J.-P.: Impact of land convection on troposphere-stratosphere exchange in the tropics, Atmos. Chem. Phys., 7, 5639–5657, doi:10.5194/acp-7-5639-2007, 2007.
Ricaud, P., Pommereau, J.-P., Atti´e, J.-L., Le Flochmo¨en, E., El Amraoui, L., Teyss`edre, H., Peuch, V.-H., Feng, W., and Chipperfield, M. P.: Equatorial transport as diagnosed from nitrous oxide variability, Atmos. Chem. Phys., 9, 8173–8188, doi:10.5194/acp-9-8173-2009, 2009.
Rosen, J. M. and Kjome, N. T.: The Backscattersonde: a new in-strument for atmospheric aerosol research, Appl. Opt., 30, 1552– 1561, 1991.
Rosenfeld, D., Lohmann, U., Raga, G. B., O’Dowd, C. D., Kul-mala, M., Fuzzi, S., Reissell, A., and Andreae, M. O.: Flood or Drought: How Do Aerosols Affect Precipitation?, Science, 321, 1309–1313, 2008.
Rosenlof, K. H.: Seasonal cycle of the residual mean meridional cir-culation in the stratosphere, J. Geophys. Res., 100, 5173–5191, 1995.
Sassen, K., Wang, Z., and Liu, D.: Cirrus clouds and deep con-vection in the tropics: Insights from CALIPSO and CloudSat, J. Geophys. Res., 114, D00H06, doi:10.1029/2009JD011916, 2009.
Schoeberl, M. R., Duncan, B. N., Douglass, A. R., Waters, J., Livesey, N., Read, W., and Filipiak, M.: The carbon monoxide tape recorder, Geophys. Res. Lett., 33, 12811, doi:10.1029/2006GL026178, 2006.
N. J., Froidevaux, L., Ao, C. O., Bernath, P. F., Boone, C. D., Cofield, R. E., Daffer,W. H., Drouin, B. J., Fetzer, E. J., Fuller, R. A., Jarnot, R. F., Jiang, J. H., Jiang, Y. B., Knosp, B. W., Kruger, K., Li, J.-L. T., Mlynczak, M. G., Pawson, S.,Russell III, J. M., Santee, M. L., Snyder, W. V., Stek, P. C., Thurstans, R. P., Tompkins, A. M., Wagner, P. A., Walker, K. A., Waters, J. W., and Wu, D. L.: Validation of the Aura Microwave Limb Sounder temperature and geopotential height measurements, J. Geophys. Res., 113, D15S11, doi:10.1029/2007JD008783, 2008. Spackman, J. R., Gao, R., Schwarz, J., Watts, L., Fahey, D., Pfister,
L., and Bui, T. P.: Seasonal variability of black carbon mass in the tropical tropopause layer, Geophys. Res. Lett., 38, L09803, doi:10.1029/2010GL046343, 2011.
Steele, H. M. and Hamill, P.: Effects of temperature and humid-ity on the growth and optical properties of sulfuric acid-water droplets in the stratosphere, J. Atmos. Sci., 12, 517–523, 1981. Thomason, L. W., Burton, S. P., Luo, B.-P., and Peter, T.: SAGE II
measurements of stratospheric aerosol properties at non-volcanic levels, Atmos. Chem. Phys., 8, 983–995, doi:10.5194/acp-8-983-2008, 2008.
Trepte, C. R., Vaughan, M., Kato, S., and Young, S.: The Dispersal of Smoke in the UTLS Region Following the Australian PyroCB Event of February 2009 as Observed by CALIPSO, AGU Fall Meeting, San-Francisco, December 2009.
Vernier, J. P., Pommereau, J. P., Garnier, A., Pelon, J., Larsen, N., Nielsen, J., Christensen, T., Cairo, F., Thomason, L. W., Leblanc, T., and McDermid, I. S.: The tropical stratospheric aerosol layer from CALIPSO lidar observations, J. Geophys. Res., 114, D00H10, doi:10.1029/2009JD011946, 2009.
Vernier, J.-P., Thomason, L. W., and Kar, J.: CALIPSO detection of an Asian tropopause aerosol layer, Geophys. Res. Lett., 38, L07804, doi:10.1029/2010GL046614, 2011a.
Vernier, J. P., Thomason, L. W., Pommereau, J. P., Bourassa, A., Pelon, J., Garnier, A., Hauchecorne, A., Blanot, L., Trepte, C., Degenstein, D., and Vargas, F.: Major influ-ence of tropical volcanic eruptions on the stratospheric aerosol layer during the last decade, Geophys. Res. Lett., 38, L12807, doi:10.1029/2011GL047563, 2011b.
Winker, D. M., Pelon, J., Coakley Jr., J. A., Ackerman, S. A., Charl-son, R. J., Colarco, P. R., Flamant, P., Fu, Q., Hoff, R., Kit-taka, C., Kubar, T. L., LeTreut, H., McCormick, M. P., Megie, G., Poole, L., Powell, K., Trepte, C., Vaughan, M. A., and Wielicki, B. A.: The CALIPSO Mission: A Global 3D View Of Aerosols And Clouds, B. Am. Meteorol. Soc., 91, 1211–1229, doi:10.1175/2010BAMS3009.1, 2010.
Yang, Q., Fu, Q., Austin, J., Gettelman, A., Li, F., and V¨omel, H.: Observationally derived and general circulation model simulated tropical stratospheric upward mass fluxes, J. Geophys. Res., 113, D00B07, doi:10.1029/2008JD009945, 2008.
Zipser, E. J., Cecil, D., Liu, C., Nesbitt, S., and Yorty, D.: Where are the most intense thunderstorms on earth?, B. Am. Meteorol. Soc., 87, 1057–1071, 2006.