Effect of Fuel Volatility on Fuel Vaporization, Combustion Quality,
and Hydrocarbon Emissions During Starting and Warm-up in
Spark-Ignition Engines
byKelly Scott Baker
Bachelor of Science in Mechanical Engineering University of Illinois at Urbana-Champaign
College of Engineering (1995)
SUBMITTED TO THE DEPARTMENT OF MECHANICAL ENGINEERING IN PARTIAL FULFILLMENT OF THE REQUIREMENTS FOR THE DEGREE OF
MASTER OF SCIENCE IN MECHANICAL ENGINEERING at the
MASSACHUSETTS INSTITUTE OF TECHNOLOGY February 1997
© 1997 Massachusetts Institute of Technology
Signature of Author
/
Depa ment of Mechanical Engineering 16 January 1997Certified by
Joln B. Heywood Professor, Department of Mechanical Engineering is Supervisor
Accepted by
Ain A. Sonin , Chairman, Department Graduate Committee
JAN 0
6
1998
Effect of Fuel Volatility on Fuel Vaporization, Combustion Quality, and Hydrocarbon Emissions During Starting and Warm-up in Spark-Ignition Engines
by Kelly Scott Baker
Submitted to the Department of Mechanical Engineering on August 7, 1997 in partial
fulfillment of the requirements for the degree of Master of Science in Mechanical Engineering
ABSTRACT
A method which quantifies the contributions of various fuel transport mechanisms to the overall distribution of the injected fuel inside a port-injected spark-ignition engine is described. The results of the application of this method to several sets of simulated start-up data are presented. The fuel accounting analysis consists of measurements of the mass of fuel injected, the mass of fuel burned (via single-zone heat release analysis of cylinder pressure data), the mass of in-cylinder fuel vapor prior to combustion, and the mass of unburned hydrocarbon (HC) emissions in the exhaust. The simulated test procedure attempts to accurately model the engine behavior during a realistic starting and warm-up cycle without incurring the increased difficulty of making fuel accounting measurements under extremely transient conditions. The start-up tests were performed with three different fuels of varying volatility as defined by their drivability index. The volatility variation was intended to generate a data base to quantify the effects of fuel volatility on fuel vaporization rates in the intake system of a port-injected engine and the subsequent effects on combustion quality and exhaust HC emissions under starting and warm-up conditions. Variations in the simplified start-up fuel injection strategy were made to justify the need for enrichment of the initial injected fuel to improve start-up attributes.
Starting on the first cycle was achieved in all cases regardless of the initial enrichment of the fuel; however, the amount of enrichment does significantly affect the combustion character of the next several cycles. In general, the duration of the enrichment effects caused by a large injected fuel mass in the first cycle are extremely short-lived. The duration depends both on the amount of fuel injected and the fuel volatility. Higher initial injected mass and lower volatility extend the duration of the enhancement of combustion due to enrichment. Once the initial enrichment effects dissipate, the fuel volatility plays an important role in establishing stable combustion. As the enrichment is stopped, the fuel-air mixture in the cylinder becomes vary lean due to poor evaporation characteristics in the intake port. The equivalence ratio and vapor concentration build-up rate appear to rely heavily on the T5o point of the fuel. An increase in T50 point of 220 F from that of the average
commercial gasoline leads to a lower initial equivalence ratio once the start-up enrichment effects end. This precludes combustion for a much longer time (-20 to 30 cycles). From an equivalence ratio of 0.6 to 0.7, the engine fires sporadically with extremely low GIMEP values. Misfires are generally not seen once the equivalence ratio reaches 0.7 to 0.75. Substantial cycle-to cycle variations in work output occur until the equivalence ratio reaches 0.9 or above. Finally, the Tgo point of the fuel appears to have the most significant impact on the exhaust HC emissions. The effect is most likely due to the presence of more in-cylinder liquid fuel. The Tgo point does not appear to have significant adverse effects on combustion.
Thesis Advisor
John B. Heywood
Sun Jae Professor of Mechanical Engineering Director, Sloan Automotive Laboratory
ACKNOWLEDGMENTS
Now is my chance to thank all of you who made this possible. Nothing worth having comes easily. This thesis was no exception to that rule for me. Were it not for the support, advice, and friendship of the following people, none of this would have ever made it to print.
I would like to begin by acknowledging Professor John Heywood for allowing me the opportunity to study at the Sloan Laboratory and to have the ability to interact with the many truly outstanding people who are a part of that program. I would also like to thank him for the guidance and infinite patience he showed me throughout. He was an excellent teacher and a true mentor. His enthusiasm for his work both as a teacher and researcher was contagious.
I would also like to acknowledge the hard work of the Sloan Automotive Lab staff. Pete Menard and Brian Corkum were vital in aiding with the logistics required to complete the project (Sorry about the mess, guys.). Nancy Cook also deserves recognition for her excellent efforts to make my job a whole lot easier. My sincerest thanks go out to Professors Wai Cheng and Simone Hochgreb for their valuable insight and approachability.
To all those friends I made while at M.I.T., your friendship will never be forgotten. Mike, Brad, Norm, Denis, Katrina, Natasha, Sangmyoeng, and Haissam- our days of the beer consortium, hockey (both varieties), and kamikaze skiing always bring a smile to my face when I reflect back on them. I would especially like to thank Robert (a.k.a. "The Hammer") Meyer for many insightful conversations we had and for just plain listening to me when I really needed a friend. You helped me out many more times than you might know.
I extend my special thanks to those who helped directly with the work- Mark (a.k.a. Sean from Scotland) Dawson for the many late nights helping me collect the final data, Younggy Shin for taking me under his wing when I was just beginning, Len Graiff of the Shell Corporation for providing the fuels used, Henrik Malberg and Jan-Roger Linna of the Volvo Car Corporation for the equipment, and the members of the Industrial Consortium on Engines-Fuels Interactions for financial support and helpful input.
I would especially like to thank Heather Strock for knowing I had no other choice to make and for sticking with me through the worst of it. I am as proud of your accomplishments as you are of mine. I admire your strength through this all. My family deserves a lot of credit as well for advice along the way and for listening when I needed it most. Erin, Ryan, Crystal, Vic, Greg, Dorothy, and Zach- although I don't see you much, you make all the time we have spend together wonderful. To Brett Miller- you have always been like a brother to me: the same goes for you. To my grandmother, Dorothy Amato, your support along the way has been as strong as anyone's. You are a true inspiration to me.
Finally, I would like to dedicate this work to my parents Carol and Robert. Mom, you gave me the ability to work with my head and the confidence to achieve anything. Dad, you taught me to work with my hands and taught me the determination to never quit. This work was a culmination of both sides of my personality, so you two are as responsible for its ultimate success as I am.
TABLE OF CONTENTS
Abstract 3 Acknowledgments 5 List of Figures 8 List of Tables 11 CHAPTER 1: Introduction 13 1.1 Motivation 13 1.2 Background 141.2.1 Overview of HC Emissions Sources 14
1.2.2 Startup Engine Phenomena in SI Engines 15 1.2.3 Mixture Preparation with Port Fuel Injection (PFI) 16 a. Effect of Injection Strategy and Injector Type 17
b. Fuel Effects 18
c. Ambient Temperature Effects 18
1.3 Possible Causes of Increased HC Emitted Under Cold Start
Conditions 19
1.4 Objectives 20
CHAPTER 2: Description of Fuel-on Transient Starting Experiment 23
2.1 Experimental Apparatus 23
2.1.1 Test Engine 23
2.1.2 Controls and Instrumentation 24
2.1.3 Sensors and Data Acquisition 25
2.2 Experimental Development 26
2.2.1 Objective 26
2.2.2 Test Conditions 27
2.2.3 Test Procedure 28
2.2.4 Engine Preparation for Subsequent Testing 29
2.3 Test Variables 31
2.3.1 Fuel Properties 31
2.3.2 Initial Fuel Enrichment 32
CHAPTER 3: Use of the Fast Response Flame Ionization Detector During
Spark Ignition Engine Cold Start 37
3.1 Overview of the Fast-response Flame Ionization Detector 37
3.1.1 Operating Principle 37
3.1.2 Transit Time 38
3.1.3 Equipment Description 39
3.1.4 Sub-atmospheric vs. Atmospheric CP Sampling 41 3.2 Sampling Engine-out Hydrocarbon Emissions From the Engine
Exhaust 43
3.2.1 Location for Sampling 43
3.2.2 Sample Tube Description 44
3.2.3 Calibration of the Signal 44
3.3 In-cylinder Sampling via Fast FID 46
3.3.1 Description of the In-cylinder FID Trace 46
3.3.2 Common In-cylinder FID Problems 48
3.4 Signal Verification 48
4.1 Mass of Fuel Injected 65
4.2 Mass of Fuel Burned 66
4.2.1 Overview of the Heat Release Equations 66
4.2.2 Heat Transfer Sub-model 68
4.2.3 Crevice Gas Sub-model 70
4.2.4 Initial Mass Estimation 70
4.3 Mass of In-cylinder Fuel Vapor 77
4.4 Mass of Fuel Exhausted as Engine-Out Hydrocarbon Emissions 80
4.5 Cycle-by-Cycle Overall Equivalence Ratio 81
CHAPTER 5: Results and Discussion 85
5.1 Qualitative Analysis 85
5.1.1 Results for Fuel 809-P 86
5.1.2 Results for Fuel 810-P 100
5.1.3 Results for Fuel 811-P 112
5.2 Quantitative Analysis 115
5.2.1 In-Cylinder Equivalence Ratio Measured via
Fast FID 115
5.2.2 Fuel Accounting Results- Baseline Comparison 118 5.2.3 Results of Single Cycle Burn Rate Analysis 122
CHAPTER 6: Conclusions and Recommendations 183
LIST OF FIGURES
Figure 3.1: HFR 400 Fast-response Flame Ionization Detector 55 Figure 3.2 : Internal View of CP Chamber and FID Chamber 56
Figure 3.3: Detail of in-cylinder FID probe 57
Figure 3.4: Detail of Exhaust FID Sampling Probe. 57 Figure 3.5: Detail of CP Chamber Volume Extension for In-Cylinder
Sampling 58
Figure 3.6: Exhaust Calibration Mounting Showing Exhaust Port FID in
sampling mode (top) and calibration mode (bottom) 59 Figure 3.7: In-Cylinder FID Trace at Atmospheric CP Condition (Part-Load) 60 Figure 3.8 : In-Cylinder FID Trace at Sub-Atmospheric CP Condition
(Part-Load) 60
Figure 3.9: Comparison of Normal In-Cylinder FID Trace to Signals Which Exhibit Abnormal Behavior Due to: (a.) Normal Signal Appearance, (b.) Choking of Tee-Top Exit, (c.) Inadequate Response Time Excessive Sample Line Volume, (d.) Varying AP
Due to Excessive Sample Mass Flow Rate 61
Figure 3.10: Simplified Gas Sample Thermodynamic Pathway Showing the Possibility for Liquid Fuel Condensation in In-cylinder
Sampling 62
Figure 3.11: Five Cycles of Gaseous-Fueled In-Cylinder FID Data; Fuel: Propane, Engine Speed: 900 rpm, IMAP: 0,5 bar, CP Pressure:
Atmospheric, Phi: 1.0 63
Figure 3.12 : Five Cycles of Liquid-Fueled In-Cylinder FID Data; Fuel: Indolene, Engine Speed: 900 rpm, IMAP: 0,5 bar, CP Pressure:
Atmospheric, Phi: 1.0 63
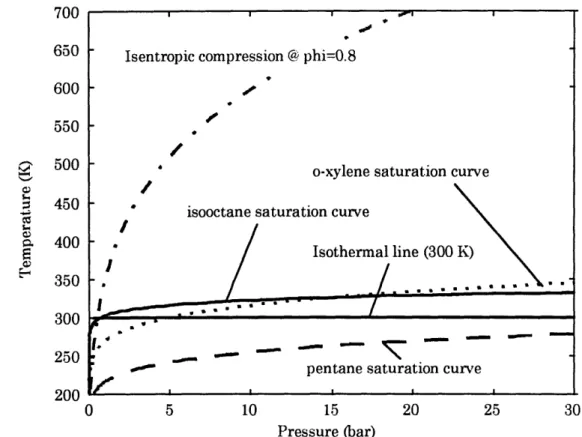
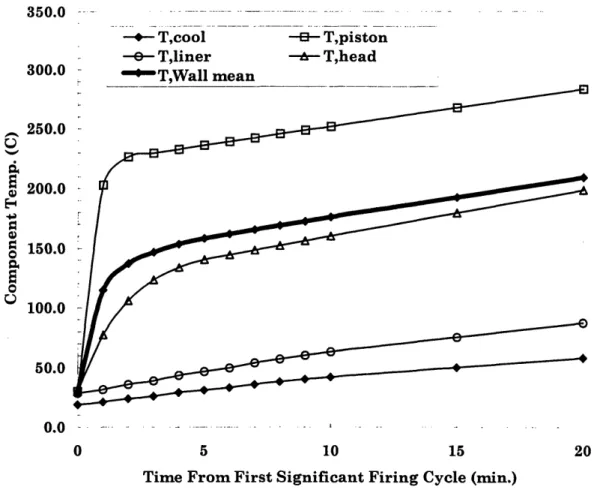
Figure 4.1: Control Volume for the One-Zone Heat Release Analysis 82 Figure 4.2: Transient Wall Temperature Profile Used For Heat-Release
Analysis 83
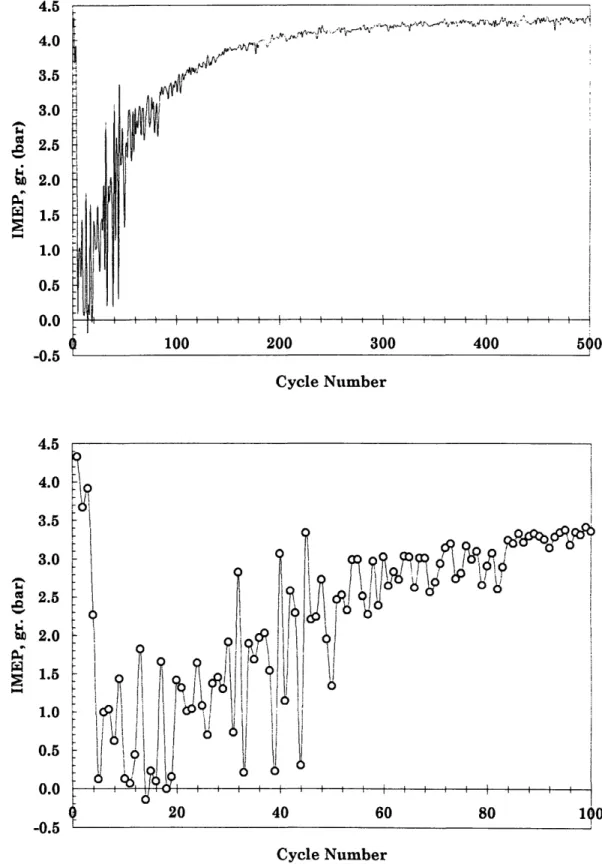
Figure 5.1 : Behavior of gross indicated mean effective pressure for fuel 809-P: 1000 rpm, IMAP = 0.46 bar, spark timing @ 23 o BTC, first
injection = 6 units 126
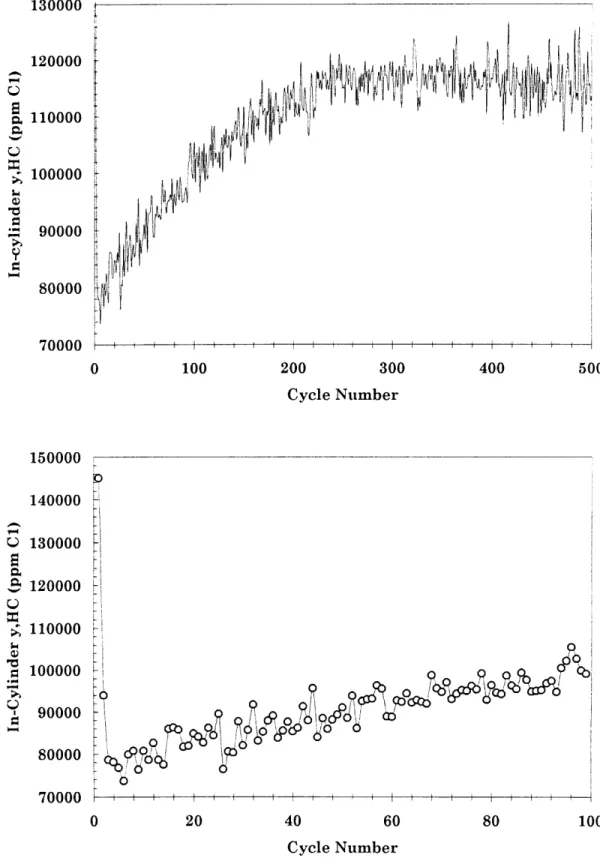
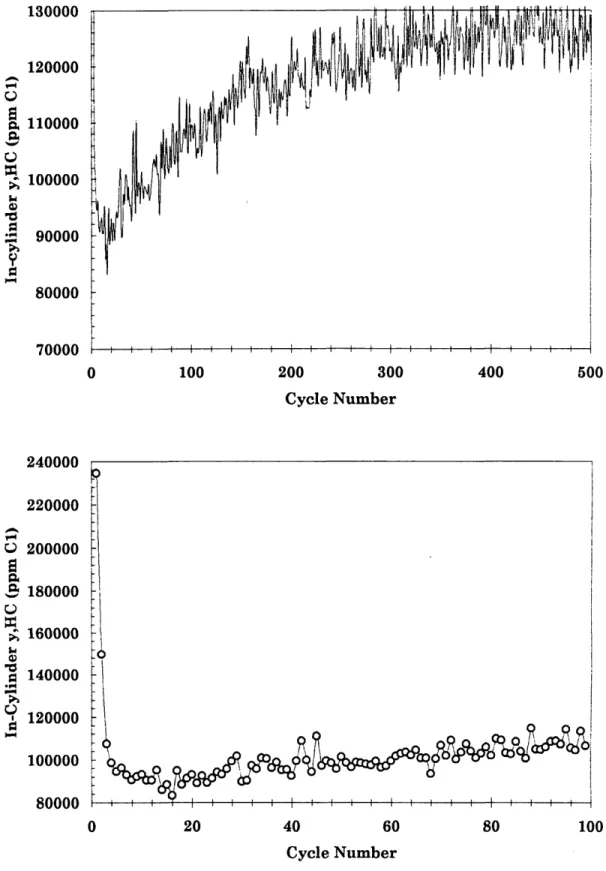
Figure 5.2 : Behavior of in-cylinder y,HC for fuel 809-P: 1000 rpm, IMAP =
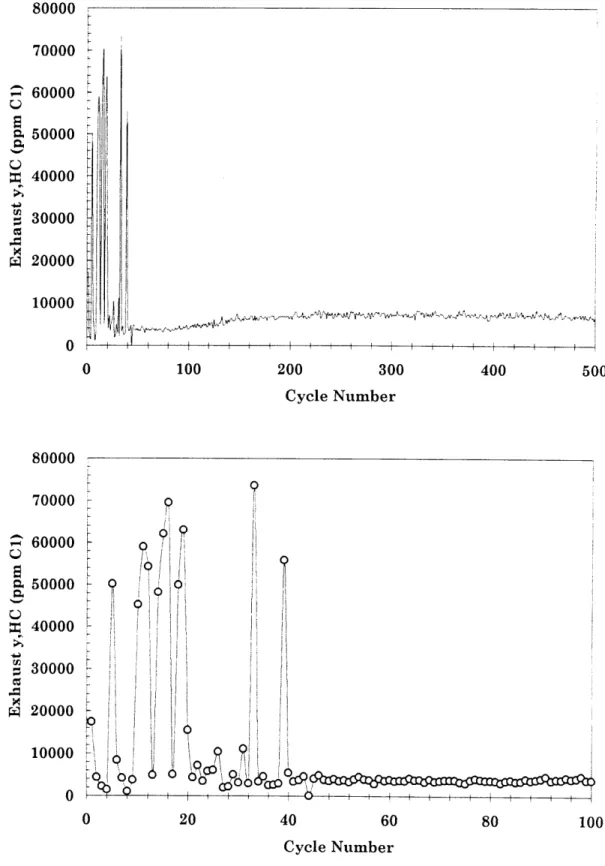
0.46 bar, spark timing @ 23 0 BTC, first injection = 6 units 127 Figure 5.3 : Behavior of exhaust y,HC for fuel 809-P: 1000 rpm, IMAP = 0.46
bar, spark timing @ 23 o BTC, first injection = 6 units 128 Figure 5.4 : Behavior of in-cylinder overall equivalence ratio measured by
UEGO sensor for fuel 809-P: 1000 rpm, IMAP = 0.46 bar,
spark timing @ 23 o BTC, first injection = 6 units 129 Figure 5.5 : Behavior of gross indicated mean effective pressure for fuel
809-P: 1000 rpm, IMAP = 0.46 bar, spark timing @ 23 o BTC, first
injection = 4 units 130
Figure 5.6 : Behavior of in-cylinder y,HC for fuel 809-P: 1000 rpm, IMAP =
0.46 bar, spark timing @ 23 o BTC, first injection = 4 units 131 Figure 5.7 : Behavior of exhaust y,HC for fuel 809-P: 1000 rpm, IMAP = 0.46
bar, spark timing @ 23 o BTC, first injection = 4 units 132 Figure 5.8 : Behavior of in-cylinder overall equivalence ratio measured by
UEGO sensor for fuel 809-P: 1000 rpm, IMAP = 0.46 bar,
Figure 5.9 : Behavior of gross indicated mean effective pressure for fuel 809-P: 1000 rpm, IMAP = 0.46 bar, spark timing @ 23 o BTC, first injection = 8 units
Figure 5.10 : Behavior of in-cylinder y,HC for fuel 809-P: 1000 rpm, IMAP = 0.46 bar, spark timing @ 23 o BTC, first injection = 8 units Figure 5.11 : Behavior of exhaust y,HC for fuel 809-P: 1000 rpm, IMAP =
0.46 bar, spark timing @ 23 o BTC, first injection = 8 units Figure 5.12 : Behavior of in-cylinder overall equivalence ratio measured by
UEGO sensor for fuel 809-P: 1000 rpm, IMAP = 0.46 bar, spark timing @ 23 o BTC, first injection = 8 units
Figure 5.13 : Behavior of gross indicated mean effective pressure for fuel 809-P: 1000 rpm, IMAP = 0.49 bar, spark timing @ 23 o BTC, first injection = 10 units
Figure 5.14 : Behavior of in-cylinder y,HC for fuel 809-P: 1000 rpm, IMAP = 0.49 bar, spark timing @ 230 BTC, first injection = 10 units Figure 5.15 : Behavior of exhaust y,HC for fuel 809-P: 1000 rpm, IMAP =
0.49 bar, spark timing @ 23 o BTC, first injection = 10 units Figure 5.16 : Behavior of in-cylinder overall equivalence ratio measured by
UEGO sensor for fuel 809-P: 1000 rpm, IMAP = 0.49 bar, ark timing @ 23 o BTC, first injection = 10 units
Figure 5.17 : Behavior of gross indicated mean effective pressure for fuel 810-P: 1000 rpm, IMAP = 0.46 bar, spark timing @ 23 o BTC, first injection = 8units
Figure 5.18 : Behavior of in-cylinder y,HC for fuel 810-P: 1000 rpm, IMAP = 0.46 bar, spark timing @ 230 BTC, first injection = 8 units Figure 5.19 : Behavior of exhaust y,HC for fuel 810-P: 1000 rpm, IMAP =
0.46 bar, spark timing @ 23 o BTC, first injection = 8 units Figure 5.20: Behavior of in-cylinder overall equivalence ratio measured by
UEGO sensor for fuel 810-P: 1000 rpm, IMAP = 0.46 bar, spark timing @ 23 o BTC, first injection = 8 units
Figure 5.21 : Behavior of gross indicated mean effective pressure for fuel 810-P: 1000 rpm, IMAP = 0.46 bar, spark timing @ 23 o BTC, first injection = 6 units
Figure 5.22 : Behavior of in-cylinder y,Hc for fuel 810-P: 1000 rpm, IMAP = 0.46 bar, spark timing @ 230 BTC, first injection = 6 units Figure 5.23 : Behavior of exhaust y,HC for fuel 810-P: 1000 rpm, IMAP =
0.46 bar, spark timing @ 23 o BTC, first injection = 6 units Figure 5.24 : Behavior of in-cylinder overall equivalence ratio measured by
UEGO sensor for fuel 810-P: 1000 rpm, IMAP = 0.46 bar, spark timing @ 23 o BTC, first injection = 6 units
Figure 5.25 : Behavior of gross indicated mean effective pressure for fuel 810-P: 1000 rpm, IMAP = 0.48 bar, spark timing @ 23 o BTC, first injection = 10 units
Figure 5.26 : Behavior of in-cylinder y,HC for fuel 810-P: 1000 rpm, IMAP = 0.48 bar, spark timing @ 230 BTC, first injection = 10 units Figure 5.27 : Behavior of exhaust y,Hc for fuel 810-P: 1000 rpm, IMAP =
0.48 bar, spark timing @ 23 o BTC, first injection = 10 units Figure 5.28 : Behavior of in-cylinder overall equivalence ratio measured by
UEGO sensor for fuel 810-P: 1000 rpm, IMAP = 0.48 bar, ark timing @ 23 o BTC, first injection = 10 units
134 135 136 137 138 139 140 141 142 143 144 145 146 147 148 149 150 151 152 153
Figure 5.29 : Behavior of gross indicated mean effective pressure for fuel 810-P: 1000 rpm, IMAP = 0.46 bar, spark timing @ 23 o BTC,
rst injection = 12 units
Figure 5.30 : Behavior of in-cylinder y,Hc for fuel 810-P: 1000 rpm, IMAP = 0.46 bar, spark timing @ 230 BTC, first injection = 12 units Figure 5.31 : Behavior of exhaust y,HC for fuel 810-P: 1000 rpm, IMAP =
0.46 bar, spark timing @ 23 o BTC, first injection = 12 units Figure 5.32 : Behavior of in-cylinder overall equivalence ratio measured by
UEGO sensor for fuel 810-P: 1000 rpm, IMAP = 0.46 bar, park timing @ 23 o BTC, first injection = 12 units
Figure 5.33 : Behavior of gross indicated mean effective pressure for fuel 811-P: 1000 rpm, IMAP = 0.53 bar, spark timing@ 23 o BTC, first injection = 15 units
Figure 5.34 : Behavior of exhaust y,HC for fuel 811-P: 1000 rpm, IMAP = 0.53 bar, spark timing @ 23 o BTC, first injection = 15 units Figure 5.35 : Behavior of in-cylinder overall equivalence ratio measured by
UEGO sensor for fuel 811-P: 1000 rpm, IMAP = 0.53 bar, spark timing @ 23 o BTC, first injection = 15 units
Figure 5.36 : Comparison of Fast FID Calculation of Fuel-Air Equivalence Ratio vs. UEGO Reading for Fuel 809-P, [Top = 6 Unit Baseline Injection, Bottom = 4 Unit Injection]
Figure 5.37 : Comparison of Fast FID Calculation of Fuel-Air Equivalence Ratio vs. UEGO Reading for Fuel 809-P, [Top = 8 Unit Injection, Bottom = 10 Unit Injection]
Figure 5.38 : Comparison of Fast FID Calculation of Fuel-Air Equivalence Ratio vs. UEGO Reading for Fuel 810-P, [Top = 8 Unit Baseline Injection, Bottom = 6 Unit Injection]
Figure 5.39: Comparison of Fast FID Calculation of Fuel-Air Equivalence Ratio vs. UEGO Reading for Fuel 810-P, [Top = 10 Unit Baseline Injection, Bottom = 12 Unit Injection]
Figure 5.40: Fraction of Fuel Injected During Cycle One Appearing as In-cylinder Vapor
Figure 5.41 : Effect of Equivalence Ratio on Gross Indicated Mean Effective Pressure for the Fuel 810-P Baseline Test
Figure 5.42 : Mass of Fuel Uncounted for Fuel 809-P (DI = 1172, IMAP=0.46 bar, Spark Timing @ 230 BTC, 1000 rpm, 8 Unit Injection) Figure 5.43 : Mass of Fuel Uncounted for Fuel 810-P (DI = 1254, IMAP=0.46
bar, Spark Timing @ 230 BTC, 1000 rpm, 8 Unit Injection) Figure 5.44 : Log P-Log V Plot of Measured Cylinder Pressure Six Cycles
From Start.
Figure 5.45 : Mass Fraction Burned and Chemical Energy Release Rate Plots for Cycles 1 to 5 for Fuel 809-P (IMAP=0.46 bar, Spark Timing @ 230 BTC, 1000 rpm, 8 Unit Injection)
Figure 5.46: Pressure Trace and log P- log V Plots for Cycles 1 to 5 for Fuel 809-P (IMAP=0.46 bar, Spark Timing @ 230 BTC, 1000 rpm, 8 Unit Injection)
Figure 5.47 : Mass Fraction Burned and Chemical Energy Release Rate Plots for Cycles 6 to 10 for Fuel 809-P (IMAP=0.46 bar, Spark Timing @ 230 BTC, 1000 rpm, 8 Unit Injection)
154 155 156 157 158 159 160 161 162 163 164 165 165 166 167 168 169 170 171
Figure 5.48 : Mass Fraction Burned and Chemical Energy Release Rate Plots for Cycles 11 to 15 for Fuel 809-P (IMAP=0.46 bar, Spark Timing @ 230 BTC, 1000 rpm, 8 Unit Injection)
Figure 5.49 : Mass Fraction Burned and Chemical Energy Release Rate Plots for Cycles 16 to 20 for Fuel 809-P (IMAP=0.46 bar, Spark Timing @ 230 BTC, 1000 rpm, 8 Unit Injection)
Figure 5.50 : Pressure Trace and log P- log V Plots for Cycles 16 to 20 for Fuel 809-P (IMAP=0.46 bar, Spark Timing @ 23o BTC, 1000 rpm, 8 Unit Injection)
Figure 5.51: Mass Fraction Burned and Chemical Energy Release Rate Plots for Cycles 28 to 32 for Fuel 809-P (IMAP=0.46 bar, Spark Timing @ 230 BTC, 1000 rpm, 8 Unit Injection)
Figure 5.52 : Mass Fraction Burned and Chemical Energy Release Rate Plots for Cycles 33 to 37 for Fuel 809-P (IMAP=0.46 bar, Spark Timing @ 230 BTC, 1000 rpm, 8 Unit Injection)
Figure 5.53 : Mass Fraction Burned and Chemical Energy Release Rate Plots for Cycles 38 to 42 for Fuel 809-P (IMAP=0.46 bar, Spark Timing @ 230 BTC, 1000 rpm, 8 Unit Injection)
Figure 5.54 : Mass Fraction Burned and Chemical Energy Release Rate Plots for Cycles 71 to 75 for Fuel 809-P (IMAP=0.46 bar, Spark Timing @ 230 BTC, 1000 rpm, 8 Unit Injection)
Figure 5.55 : Mass Fraction Burned and Chemical Energy Release Rate Plots for Cycles 301 to 305 for Fuel 809-P (IMAP=0.46 bar, Spark Timing @ 230 BTC, 1000 rpm, 8 Unit Injection)
Figure 5.56 : Pressure Trace and log P- log V Plots for Cycles 301 to 305 for Fuel 809-P (IMAP=0.46 bar, Spark Timing @ 230 BTC, 1000 rpm, 8 Unit Injection)
Figure 5.57 : Comparison of Exhaust FID Traces After 5 Minutes (top) and Approximately Ten Seconds From Start of Test (bottom)
LIST OF TABLES
Table 2.1: Engine Specifications (Volvo B5254 FS Engine) Table 2:2: Properties of the Test Fuels
Table 2.3: Initial Fuel Enrichment Strategies
Table 4.1: Sensitivity of the Final Mass Fraction Burned Results to Model Inputs 172 173 174 175 176 177 178 179 180 181
CHAPTER 1
INTRODUCTION
1.1 Motivation
Government legislation in the United States, Japan, and the European Union regarding pollution caused by automobiles has been steadily driving automotive manufacturers to reduce unburned hydrocarbon (UHC) emissions from spark-ignition engines for the last several decades. The greatest reductions were achieved in the 1970s due to the introduction of three-way exhaust catalyst technology. However, exhaust catalysts require time to heat up to their "light-off' temperature and are typically ineffective during the first minute of engine operation. It is now recognized that over ninety percent of the UHC emissions in federal testing (i.e. the United States' Federal Test Procedure or F.T.P.), occur during this time period when the exhaust catalyst is not operating [1]1. Strict proposed legislation on UHC emissions are prompting the automotive manufacturers to look for ways to decrease the amount of hydrocarbons emitted prior to catalyst light-off. The future U.S. ULEV (Ultra-Low Emissions Vehicle) standards call for under 0.040 grams per mile of non-methane hydrocarbon emissions (NMHC). This number represents a tenfold decrease from the 1991 federal passenger car standard.- In order to meet the future HC emissions standards, it will be necessary for manufacturers to reduce emissions greatly during the transient phase of starting and warm-up.
While the government mandates that auto makers limit vehicle emissions, customers place other demands on the auto makers to provide a vehicle which performs well even during the transient warm-up period. The consumer desires an engine which starts rapidly
and exhibits little combustion variability or drivability problems during warm-up. Large
numbers of misfires and partial burning cycles during warm-up are evident to the driver as reduced power, acceleration, and engine harshness. These performance characteristics, rather than emissions characteristics, usually determine whether or not a consumer will buy the vehicle in question.
Precise control of the in-cylinder equivalence ratio through a better understanding of then mixture preparation process in the intake port and cylinder is seen as the most likely method for reducing UHC emissions in starting and warm-up without sacrificing good drivability characteristics. Mixture preparation is dependent upon many factors including heat transfer in the intake port, injector type and targeting, fuel injection strategy (including amount injected and injection timing), fuel distillation properties and droplet size, and ambient conditions. As a result, the mixture preparation process is very complex to study in depth. This work is limited in scope to studying the effects of fuel volatility on the mixture preparation process and the consequent effects on UHC emissions and combustion quality.
1.2 Background
This section is intended to provide insight into the features of the spark ignition engine starting process and why it is difficult for engine manufacturers to find an economical way to meet emissions standards under start-up conditions. This includes a discussion of typical engine behavior when starting from "cold" conditions. Furthermore, it will delineate the conditions which are believed to be responsible for the high level of UHC emissions during start-up and idling. Finally, this section will attempt to explain what impact fuel volatility may have on the level of UHC emissions and vehicle drivability during cold starts.
1.2.1 Overview of HC Emissions Sources
The sources which contribute to engine-out hydrocarbon emissions in spark-ignition engines under steady-state operating conditions are well-defined [2]. Unburned
hydrocarbons result from fuel which escapes the normal combustion event within the cylinder. These sources consist of both fuel-air and fuel-only varieties. The fuel-air sources consist of crevice mass storage, flame quenching near the cylinder walls, bulk quenching under extremely lean cases, and exhaust valve leakage. Fuel-only sources include absorption-desorption mechanisms in oil layers and combustion chamber deposits and diffusion-controlled combustion of liquid fuel droplets and films within the cylinder. Under normal conditions, about 91.5% of the fuel in the cylinder burns on average. Some of the fuel which escapes the normal combustion process oxidizes late in the cycle as the fuel enters the hot burned gases in the cylinder and exhaust port. Inevitably, a small fraction of the in-cylinder fuel is not oxidized or is only partially-oxidized, leading to UHC emissions in the engine's exhaust gas stream.
1.2.2 Start-up Engine Phenomena in SI Engines
During engine starting, the engine is cranked by a starter motor at low speeds (typically 150 rpm) until combustion begins. As each cylinder fires the engine speed increases dramatically. Most engines operate on a real-time basis early in the start due to the lack of accurate crank position information. As a result, in the early cycles, fuel injection and spark timing are not synchronized with the actual in-cylinder events. As much as a forty percent deviation from the mean amount of fuel injected in the first several cycles was noticed by Schurov and Collings [3 ].
Due to the cold condition of the engine's exhaust gas oxygen (EGO) analyzer and hot-wire airflow sensor, the start-up generally occurs under open-loop control. Engine management systems typically rely on the coolant temperature to determine the amount of fuel injected on each cycle and the spark timing due to the lack of information on airflow and charge composition. Engine events are usually controlled by empirically-calibrated look-up tables for these quantities. The target fuel-air equivalence ratio in most modern engines is
unity due to the use of exhaust catalysis; however, it is difficult to meet this mark during starting due to the lack of feedback control data.
1.2.3 Mixture Preparation with Port Fuel Injection
Due to the cold intake port surfaces, fuel evaporation in the intake port during starting is poor. Spark-ignition engines require fuel to be injected at several times the stoichiometric proportion in the first several cycles to ensure prompt initiation of combustion despite the reduced fuel vaporization. This strategy results in a pool of liquid fuel to be accumulated inside the intake port. Additionally, due to geometric constraints, the fuel spray wets the intake port walls with small droplets of liquid fuel. Eventually, this liquid fuel enters the cylinder. Only a fraction of the fuel that makes its way to the cylinder during the early stages of starting participates in the combustion process, while most is expelled during the exhaust stroke [3]. Liquid fuel both in-cylinder and on the port wall acts as a fuel storage "capacitor", making precise control of air-fuel ratio difficult during transient operation. The build-up of liquid fuel within the engine cylinder is believed to be the most prominent contributor to the increased UHC emissions which occur during the warm-up period.
In a test where the minimum fuel amount to achieve stable combustion was injected every cycle, Takeda et al. found that the liquid fuel film in the intake port increases for the first 300 cycles of the start-up. Furthermore, increased UHC emissions were measured while the liquid fuel pool was increasing in size [4]. It is believed that the liquid fuel may be absorbed in the oil film on the cylinder liner, resulting in increased UHC emissions in the exhaust as the fuel desorbs from the oil late in the expansion stroke. Additionally, liquid fuel may cause in-cylinder mixture inhomogeneity, causing degraded combustion quality.
Liquid fuel accumulated in the intake port during starting makes its way to the cylinder by several methods. Through in-cylinder photography, Shin detailed the processes which appear to transport liquid fuel to the cylinder. They are instant atomization of fuel accumulated on the port and valve surfaces, strip atomization of this fuel by the incoming
airflow, squeezing of the liquid film on the valve seat as the valve impacts at intake valve closing, and liquid film flow during the intake valve open period [5]. Meyer and Heywood found evidence of the instant atomization, strip atomization, and film squeezing by PDPA analysis of the droplet size and velocity profiles near the valve curtain area during the forward intake flow [6].
1.2.3 a. Effect of Injection Strategy and Injector Type
Fuel injected is aimed either on the back of the intake valve after the intake valve closes (closed-valve injection) or at the open intake valve area during the intake stroke (open-valve injection). Typically, engine manufacturers opt for closed-valve injection (CVI); however, increasing interest is being shown in using open-valve injection (OVI) because it reduces the amount of over-fueling required to start the engine. CVI is preferred generally because it allows for the fuel to be evaporated by the hot backflow of the exhaust gases into the intake manifold during the valve overlap period. Additionally, the valve is generally hotter than the rest of the intake port components, providing an excellent surface for fuel evaporation. Lower start-up HC emissions are obtained with closed valve injection [7].
Open-valve injection greatly reduces the amount of intake port wetting, yet it also results in poorer mixture homogeneity due to less time for evaporation and larger amounts of in-cylinder liquid fuel due to direct impingement of incoming fuel droplets on the exposed cylinder liner. Thus, it is hard to reduce start-up HC emissions by changing injection timing alone. Open-valve injection with improved fuel atomization, generally results in less port wall-wetting and in-cylinder wetting. The result is lower UHC emissions during the engine start and warm-up period. Fuel droplet size also affects the engine-out emissions during the starting period. Smaller droplets result in less wall wetting, and therefore, lower HC emissions [4,7]. Finer atomization is usually achieved by more complex injection equipment (e.g. pre-vaporized or air-assisted injectors). These injectors incur a fuel economy penalty in
order to operate them and are expensive. Any subsequent reduction in engine-out HCs should be balanced against these costs.
Injection timing also greatly influences where the liquid fuel is located in the cylinder during starting. Witze and Green visualized liquid fuel films through the piston crown using laser-induced fluorescence (LIF) [8]. They observed liquid fuel accumulation around the valve seat and valve surface for CVI. In the case of OVI, the liquid fuel appeared to be impinging mainly upon the piston crown directly from the fuel spray.
1.2.3 b. Fuel Effects
Fuel distillation properties also play an important role in the liquid fuel dynamics during the starting process of an SI engine. Gasoline is composed of many hydrocarbon components with a wide range of boiling points. Heavier (higher boiling points) components are thought to be retained in the port longer due to port wall temperatures which are insufficient to vaporize these fractions of the fuel. Takeda et al. also found that intake port wetting, in-cylinder liquid fuel, and hydrocarbon emissions all increase drastically as the T50
point of the fuel increased. Therefore, the T5o temperature of the fuel is one of the most
influential factors in reducing UHC emissions during cold starting. Furthermore, Yang et al. noticed that and increase in heavy components in the fuel was always accompanied by a consistent increase in unburned hydrocarbon emissions [9]. Furthermore, Quader et al. Showed that reducing the Tgo point of the fuel from 178oC to 1460C reduced HC emissions by more than thirty percent [10]. An earlier study by Quader found that a high degree of fuel aromaticty led to an increase in engine-out HCs. Finally, the extensive Auto/ Oil Air Quality Research Improvement Program found that the HC emissions increase due to fuel Tg0 was more significant for newer vehicles with PFI, ostensibly because PFI allows shorter times for evaporation of liquid fuel relative to older carbureted systems [11].
1.2.3 c. Ambient Temperature Effects
Alkidas and Drews also studied the effects of engine component temperature on HC emissions. They found that mixture preparation has no significant effect on the level of emissions at warmed-up conditions (900 C); however, as the engine component temperature decreased from 200 C to -6o C, the difference in HC emissions between cases using gaseous fuel and those using liquid fuel (California Phase II gasoline) increased drastically [7]. Quader et al., in a study of T90o effects on start-up emissions reported that the in-cylinder equivalence ratio based on known air and fuel flow rates was significantly higher than the equivalence ratio determined by exhaust gas analysis when the engine component temperature was -70C. Therefore, at cold temperatures, a large portion of the fuel supplied to the engine does not participate in the normal combustion event. This effect was more pronounced for high T9o fuels [13].
1.3 Possible Causes of Increased HC Emitted Under Cold Start Conditions
While the sources of hydrocarbon emissions during warmed-up operation are well-publicized, little experimental evidence exists to explain why the HC emissions levels increase so drastically during the start-up and warm-up period. Typically, the increased HC emissions have been attributed to mixture enrichment used to provide rapid starting and the increased presence of liquid fuel in the cylinder under cold conditions. However, the equivalence ratio in the cylinder is usually lean for many cycles after starting despite the enrichment of the first few injection pulses [14]. Clearly, there must be other factors contributing to the abnormally high UHC levels during this stage of operation. Furthermore, the timescale for the HC peak seen in start-up data of 2 to 10 seconds is far shorter than the timescale for the build-up of liquid fuel in the port which reaches its maximum between 20 to 50 seconds after start [15].
It is believed that the following are possible sources of increased HC during cold-starting: (1.) increased presence of liquid fuel in the cylinder, (2.) increased crevice size due
to low component temperatures, (3.) increased absorption in the lubricating oil due to thicker oil films on the liner, (4.) significant number of misfired cycles, (5.) incomplete combustion, (6.) rich air-fuel ratio excursions, (7.) locally-rich mixture zones in the cylinder near liquid fuel sources, (8.) increased flame quenching due to cold walls, and (9.) lower post-flame oxidation due to lower gas temperatures caused by cold walls and increased charge dilution.
1.4 Objectives
In this section, the main goals of this research are explained, and an overview of how these goals are to be met is described. More detailed descriptions of the experimental procedure will follow in Chapter 2.
The first objective of this work was to develop a robust set of diagnostic tools for measuring the effects of fuel volatility on mixture preparation in a port-injected spark-ignition engine under production ECU (Electronic Control Unit) control. The diagnostics must be able to be used under a wide variety of intake manifold pressures and engine speeds due to the dynamics of the start-up process. Upon completion of this task, an experimental procedure for quantifying cold-start characteristics in a motored engine environment was developed to ensure minimal variability from test to test. For each cycle of the test, the mass of fuel injected, the mass of fuel vapor reaching the cylinder, the mass of fuel burned, and the mass of fuel escaping the combustion process as UHC emissions was measured. Additionally, plans were made to repeat the tests in a cold-start test facility at various ambient temperatures on a production-controlled engine; however, these experiments were not performed due to time constraints.
Several sets of simulated start-up tests performed on a motored engine were performed with three gasolines of varying volatility. To simplify the analysis, the fuel volatility was characterized by the drivability index which is an empirical correlation relating fuel drivability to three important distillation characteristics of the fuel- the To1 , T50, and T90 points. The fuel volatility variations were intended to show
generated. Also, it was hoped that some conclusions could be drawn about how fuel composition affects liquid fuel accumulation inside the intake port. In addition to the fuel variations, the injection strategy based on closed valve injection timing was varied by altering the enrichment of the first injection pulse. The purpose of the different enrichments is to provide experimental evidence for why over-fueling in the first few cycles is necessary to ensure good start-up performance.
CHAPTER 2
DESCRIPTION OF FUEL-ON TRANSIENT STARTING EXPERIMENT
This chapter details the engine used for this work including all sensors used in the collection of the fuel-accounting data. Furthermore, the procedure for a simulated starting experiment applicable to a motored engine is delineated. Finally, the experimental plan is outlined.
2.1 Experimental Apparatus
2.1.1 Test Engine
The engine used for the experiments described in this work was based on a modified Ricardo Hydra Mk. III single-cylinder research engine. The engine was modified however to incorporate a modern engine design with four valves per cylinder, a centrally-located spark plug, and a pent-roof, fast-burning combustion chamber. The engine used for the modifications was the Volvo B5254 FS five-cylinder engine used in the Volvo 850 production automobile. The crankcase for the Ricardo engine was modified to accept the crankshaft, connecting rod, piston, and cylinder liner of the Volvo engine. Throughout this work, the engine will be referred to as the Volvo single-cylinder engine.
The cylinder head consisted of a section of the Volvo cylinder head which was cut so that only one combustion chamber remained. Valve events and other significant geometry for the engine is provided in Table 2.1. The coolant and lubrication loops for this cylinder were not modified, but the channels leading to the other cylinders were sealed to avoid leakage. The cylinder head also contained two '2" / 20 threaded holes located at opposite sides of the combustion chamber, centrally located between the intake and exhaust valve on
the front and back of the engine. These holes allowed access to the cylinder for instrumentation such as pressure transducers and FFID sampling probes and were sealed by copper washers (see Figure 2.2). Additionally, the holes could be plugged by threaded blanks when not in use.
The engine intake system consisted of a customized single straight intake runner with the original injection spray geometry maintained. The engine uses conventional port fuel injection (PFI). Injection is accomplished by a Bosch EV1.3A injector with a nominal 200
cone angle aimed symmetrically at either intake valve. A large aluminum box was placed between the intake port and the throttle plate to simulate the effect of the intake plenum in a production engine. The throttle must be positioned manually, thus making changes in engine load during the middle of an experiment impractical.
2.1.2 Controls and Instrumentation
The engine was coupled to an Eaton Dynamatic AF 6360 dynamometer. The tests were performed with the dynamometer operating in the constant speed configuration. The crankshaft is equipped with a shaft encoder which produces a clock pulse once every degree of crankshaft rotation. A bottom dead center (BDC) pulse generator is used to determine the absolute crankshaft position each cycle. A TTL signal is provided once per cycle when the crankshaft reaches BDC of the compression stroke. Timing of cycle events such as start of injection and spark timing are set using this point as a datum.
The amount of fuel injected was controlled manually by selecting the duration of injection, thus making transient fuel injection prone to operator error. To simulate transient fuel delivery during starting an additional fuel injection driver was implemented. The second injection controller allowed the user to input the steady state injection using the aforementioned control logic; however, on the first cycle, the injection could be enriched by setting a potentiometer in the control circuit to a value corresponding to the injection
pulsewidth duration for that cycle only. After the first cycle, control of fuel injection was returned to the standard controller.
The engine coolant and lubrication oil were cooled by a counter-flow heat exchanger using city water supply at near-ambient temperature. The coolant temperature was instrumented via Type K thermocouples at the inlet to the cylinder head and at the outlet of the head and engine block. All coolant temperatures used in this work were measurements taken at the outlet of the engine block. The lubricating oil temperature was also measured at the engine inlet and outlet by Type K thermocouples.
A laminar flow element and air filter were located at the inlet of the air induction system. The laminar flow element (LFE) was used to measured the steady-state volumetric air flow rate. It also incorporated a Type K thermocouple to measure the temperature of the intake air. A 125 liter surge tank was located between the LFE and the throttle valve to damp out short time-scale pressure fluctuation effects on the airflow reading. In addition, a slow-response vacuum pressure transducer was located on the downsteam side of the throttle plate to monitor the intake manifold absolute pressure (IMAP).
2.1.3 Sensors and Data Acquisition
The Volvo engine was instrumented to acquire cylinder pressure data, in-cylinder and exhaust port hydrocarbon vapor concentrations, and exhaust port oxygen concentration once per crank angle degree. Cylinder pressure was acquired by a Kistler Model 6121 pressure transducer mounted in one of the %" holes in the combustion chamber wall. It was connected to a Kisler Model 5010 charge amplifier. The in-cylinder and exhaust port hydrocarbon vapor concentrations were captured using a two-channel Cambustion HFR-400 fast-response flame ionization detector (FFID, referred to hereafter as FID) with dual hydrocarbon sampling modules. One FID sampling probe was placed in the second Y2" hole in the cylinder head. The other FID probe was located in the exhaust port approximately fifteen centimeters downstream of the exhaust valve. Further details of the FID sampling
equipment is treated in the next chapter. The exhaust manifold was also equipped with an NTK universal exhaust gas oxygen analyzer (UEGO) located approximately 75 centimeters from the exhaust valve. Finally, a fast-response vacuum pressure transducer was located in the intake port to monitor IMAP fluctuations during start-up which could not be detected by the upstream transducer. This sensor was located approximately ten centimeters from the intake valve.
2.2 Experimental Development
2.2.1 Objective
The start-up process in a spark-ignited engine is highly transient. The engine starts from a starter motor at a cranking speed of about 150 rpm. The intake manifold pressure starts near atmospheric, but drops quickly during the first several cycles since the throttle is almost completely closed. The engine remains at its idling load (approximately 0.25-0.40 bar IMAP depending on vehicle and accessory loading) throughout its warm-up. After the first firing cycle, the engine speed rapidly rises, reaching values of around 1500 rpm after several firing events. It then gradually subsides to its idle speed (600-700 rpm typically) where it remains throughout warm-up. In addition, the fuel delivery to each engine cylinder is highly dynamic. It is typical for the cylinder to receive a large injection several times larger than the stoichiometric requirement for the airflow during the first cycle and often during the second cycle. This is done to ensure that the engine fires quickly even though cold intake port walls and inlet valve provide for poor fuel evaporation. After, the engine fires, the injected fuel is cut to slightly less than the stoichiometric requirement and gradually increased to the stoichiometric target level as the engine reaches steady-state..
[16]
Due to the lack of starter motor and the use of manual controls for injection, ignition, and throttle position on the Volvo test engine, design of a considerably simplified experiment
for monitoring fuel volatility effects on start-up behaviors was required. However, it was desired that this simplified test accurately reflected the conditions within the intake port and cylinder during a real start-up in some average sense.
2.2.2 Test Conditions
In order to simulate the engine start-up, fixed values of intake manifold pressure, engine speed, and spark timing were chosen to reflect an average of these dynamic parameters in a real engine start. The speed chosen for the experiments was 1000 rpm. Spark timing was set at a fixed value of 230 BTDC, which is near the spark timing for maximum brake torque (MBT timing) at steady state for the test conditions. The load was set for an approximate air mass flow rate of 1.55 to 1.60 grams of air per second. This airflow corresponded to an IMAP of 0.45 to 0.55 bar depending upon ambient air conditions at the time of the test. This varied considerably since the tests were taken over a period of several days. The engine speed and load chosen were higher than the "mean" values over the starting and idle warm-up period because the most significant liquid fuel behavior is thought to occur relatively close to engine starting, and these conditions were felt to adequately represent the engine phenomena during this period.
Additionally, an injection strategy was adopted using a first cycle injection of several units of fuel, where unit injection is defined as the amount of fuel required for the engine to operate at stoichiometric when the engine is warmed-up (T,coolant= 60 o C). Following this enriched first pulse, each subsequent cycle receives an injection consisting of one unit of fuel. The unit injection was determined by varying the injection pulse width until a UEGO sensor reading of X=1.0 was obtained with the engine operating at steady-state and warmed up. Fuel was injected on the closed inlet valve at 1200 ABDC (64o after intake valve closing). The effect of open-valve injection on start-up HC emissions is well-publicized and was not studied here.
The heat exchanger used for heat rejection from the engine coolant has a much larger thermal capacity than the radiator found in a production automobile. For these experiments it was desired to warm the engine components during the test in a manner similar to the how they would be heated in a real engine start. Therefore, the supply of water to the heat exchanger was turned off once the engine components were cooled to ambient temperature. The only source of component cooling during the experiment was the circulation of the engine coolant by the coolant pump. Due to the large volume of coolant used in the test engine configuration, the engine still warmed up much more slowly than in a typical vehicle start.
2.2.3 Test Procedure
Prior to the experiment, the fast FIDs were lit and allowed to warm up for thirty minutes. This allowed the flames in each unit to reach a steady operating point, and also reduced the drift of the charge amplifier used in the collection electronics. At this time, the sampling line heaters and the air heater for the in-cylinder FID were turned on and allowed to reach steady state temperatures (see Section 3.3.2 c. for further detail).
The stoichiometric unit injection was assumed to remain constant through all of the tests performed with the same fuel. Calculations for the amount of fuel injected in the first cycle for subsequent tests were made by first calculating the fuel volume injected using the unit pulse width by the injector calibration. This volume factor was then multiplied by the number of units which were to be injected on the first cycle, and the injector opening duration corresponding to this fuel volume was calculated from an injector calibration curve. From this required pulse width, the required resistance value for the potentiometer on the start-up injection driver was calculated and this value was set.
At this time, the dynamometer was activated to motor the engine. The engine speed was set to 1000 rpm. Next, the intake air flow rate was adjusted to give approximately the same mass flow rate as that used for the first test in which the unit injection was determined. There was some uncertainty in the air mass flow rate as the ambient conditions
may have changed slightly between tests. This resulted in small (less than five percent) deviations in the steady state equivalence ratio. The early start-up cycles should be fairly comparable despite the small fueling differences between tests.
Once the engine speed and load were set, the exhaust and in-cylinder FIDs were calibrated using mixtures of known concentration. Further details of these calibration procedures are given in Sections 3.2.3 and 3.3.3.d. The fast-response IMAP transducer was also calibrated at this time. It was important that the experiment be performed immediately following calibration as the FID output may drift slowly over time.
Following calibration, the water supply to the coolant heat exchanger was shut off, and the ignition was enabled. Once the data acquisition was prepared, the fuel injection trigger was activated. From this trigger signal, the injection and data acquisition were started on the next BDC compression pulse. Data was acquired from the cylinder and intake manifold pressure transducers, the in-cylinder and exhaust port FIDs, and the heated UEGO sensor in the exhaust. All data was acquired simultaneously at a resolution of one point per degree crank angle for the first two minutes from starting. The coolant outlet temperature, steady-state intake manifold pressure, and volumetric airflow rate were recorded at one minute intervals for the first ten minutes of the test. They were also recorded at fifteen and twenty minutes. Data was also acquired for one hundred cycles at five, ten, fifteen, and twenty minutes from start in order to compare steady-state data to the start-up data.
2.2.4 Engine Preparation for Subsequent Testing
Large amounts of liquid fuel were expected to be present in the cylinder and intake port during the tests. In addition, it is likely that significant amounts of liquid fuel will accumulate in the lubricating oil during a start-up test. This liquid fuel had to be purged between experiments. Purging was achieved by firing the engine on pre-mixed propane for several minutes after fuel injection was shut off. It was important for the liquid fuel to be purged by firing, rather than by motoring the engine and letting the airflow strip the fuel off
the intake port wall. When the engine fires, the backflow of hot gases into the inlet manifold during valve overlap helps to vaporize the accumulated liquid fuel in the intake port. Motoring the engine allows most of this fuel to enter the cylinder as liquid and impinge upon the cylinder liner, mixing with the lubricating oil. This fuel absorbed in the lubricating oil may be desorbed from oil films on the liner as the engine fires in later tests. If this occurs, fuel accounting calculations will be in error. As a precaution, once the liquid fuel was purged, the lubricant was drained and replaced.
To avoid mixing of the various fuels tested, the lubricating oil and fuel lines were purged completely each time a different fuel was used. This purging process consisted of first flushing the fuel in the fuel lines and fuel tank and draining the oil from the sump. Some components in the lubricating oil system and fuel system trap fluids which accumulate in the dead volume inside the part. Therefore, in the normal draining procedure, not all of the fuel or oil is removed. Some of the largest dead volumes are present in the oil and fuel filters, the fuel pump, and the fuel line accumulator. Before a new fuel was added, these parts were removed and drained thoroughly. At this time, a new oil filter was installed. All fuel lines were then purged by high pressure air. The fuel and oil were then refilled, and the engine was run to mix this new fuel and oil with the remnants left in the system. They were subsequently drained again and refilled. It is believed that after this process, any remaining components from the prior experiments would be dilute enough to have negligible effects on the next test run.
After every test, the engine was cooled by re-opening the heat exchanger cooling water valve to its fully open position. The engine was stopped; however, the coolant pump remained on to facilitate rapid cooling. The engine block coolant outlet temperature was monitored until it reached steady-state. Once this temperature was reached, the coolant pump was left on for one hour before the next test was begun to ensure that the engine components were also cooled to this temperature. The intake valves of the engine were instrumented with thermocouples for another project performed on the engine. The valves
were also allowed to reach a steady-state temperature prior to beginning the next experiment.
2.3 Test Variables
A large number of engine variables affect the mixture preparation process during start-up. This research focused primarily on the effects of variations in gasoline volatility. Additionally, the first cycle fuel enrichment was varied to determine what fraction of the injected fuel reaches the cylinder as vapor during the early phase of the starting process. The variation in the amount of fuel injected is very small compared to the overall cumulative fuel mass injected over the entire test, so it is not believed that it would have any significant effect on the long time-scale mixture preparation behavior. The test conditions are given in Table 2.3.
2.3.1 Fuel Properties
The intent of this study was to observe and quantify how the volatility of the gasoline used in the engine influences the mixture preparation in the first several minutes of operation. The parameter chosen to define the gasoline volatility in this work was the fuel drivability index (DI). Fuel drivability is normally determined by trained drivers who rate actual vehicle performance when running on the fuel in question. However, a simpler empirical correlation may be used to estimate the fuel's drivability characteristics. The correlation is given by,
DI = 1.5TIo + 3T5o + T90
. (1.)The term Ti represents the temperature (usually measured in Fahrenheit degrees) at which i percent of the fuel volume vaporizes when heated at atmospheric pressure.
Typical gasolines are composed of thousands of hydrocarbon components encompassing a wide range of boiling points. A fuel which has a large proportion of high boiling point components will have a high DI (low volatility). Past experience dictates that a fuel with a DI of less than 1200 will experience no significant combustion problems when used in an engine at approximately 200 C.
The characteristics of the three test fuels appear in Table 2.2. A fuel with a DI near 1200 was chosen, as well as one significantly above this benchmark and one slightly below it. The fuels were obtained from Shell Corporation, and they were specially blended by Phillips Petroleum for a previous gasoline drivability study. They were stored in sealed containers at all times to avoid evaporative losses of the light-end (low boiling point components). The T5o temperature for fuel 811-P is the maximum currently allowed by government standards.
In addition to choosing the gasolines based on drivability index, the Reid Vapor Pressure (RVP) of the fuels was also considered. RVP is another measure of fuel volatility. Government regulation has put standards on RVP of commercial fuels in recent years in an attempt to reduce evaporative emissions from vehicles which are not in operation. It was desired that the gasolines used have no significant differences in RVP. The value of 7.1 to 7.5 psi is representative of commercial summer-grade gasolines. (RVP is typically not regulated in the winter months because evaporative losses are negligible during cold weather.)
2.3.2 Initial Fuel Enrichment
For each gasoline several different initial fuel-injection strategies were employed. The first injection pulse was varied in order to obtain measurements of what fraction of the injected fuel usually reaches the cylinder as vapor during the first few starting cycles. Fuel enrichment is required to ensure that a combustible mixture is formed early in the start while fuel vaporization is poor due to cold port walls and intake valves. In order to simulate a real engine start, the fuel enrichment was selected in order to assure that the engine fired on the first cycle. For other tests with each fuel, larger and smaller initial injections were
also used to observe fuel behavior during cycles with marginal performance. Due to the volatility differences between fuels, different masses of fuel were injected on the first cycle in the baseline case for each gasoline. The injection strategies investigated are shown in Table 2.3. The term cQ,injected is the multiple of the amount of fuel required for stoichiometric operation at steady-state conditions (hereafter referred to as "unit" injection) which was supplied during cycle 1. All following cycles receive a one unit injection.
Table 2.1 Engine Specifications (Volvo B 5254 FS)
Type In-line 5-cylinder,
Stroke (mm) 90
Bore (mm) 83
Conn. Rod Length(mm) 158 Cylinder Head Volume (cc) 49 Clearance Volume (cc) 53.28*
Displaced Volume (cc) 2.435 L; (487 cc/cyl.)
Compression Ratio 10.1
IVO (deg. BTDC)+ 4
IVC (deg. ABDC) 56
EVO (deg. BTDC) 48
EVC (deg. ATDC) 12
Valve Overlap Factor 0.301 Intake Valve Diam. (mm) 31 Exhaust Valve Diam. (mm) 28
*This is the manufacturer's measurement. It is probably somewhat larger due to material removal for the access holes in the combustion chamber.
Table 2.2: Properties of the Test Fuels
Fuel RVP Specific To1 T5 0 Tgo Drivability
Name (psi) Gravity (o F) (o F) (o F) Index
(measured)
809-P 7.4 0.7515 133 211 339 1172
810-P 7.1 0.7388 134 233 354 1254
811-P 7.5 0.7643 143 250* 350 1314
*Maximum allowed under current government regulations.
Table 2.3: Initial Fuel Enrichment Strategies
Fuel Baseline (I,injected 0I,injected (other cases)
809-P 6 4, 8, 10
810-P 8 6, 10, 12
811-P 15* none
* Tests were not repeated due to poor start-up attributes of the fuel.
HFR 400 Fast FID Controller
To Plenu: Lam. Flow El
Figure 2.1: Volvo B 5254 FS Engine and Sensors
FID Probe
Exh
Figure 2.2: Detail of Volvo Cylinder Head Showing Instrument Placement
~---~- I - - -;--- n~-.--~-~-._. i ~. _~1_~_ ~I~ ~ a I ~- I ~I II~~--.- _ --~---~-~h-~p
Exhaust side
Intake
side
Enlargement
of
sampling
inlet
ril
Sampling
tube
Figure 2.3: Actual Photograph of Volvo Cylinder Head with FID Sampling Probe in Place. Enlargement Shows the Sampling Line Inlet Area.
~_ __
CHAPTER 3
USE OF THE FAST RESPONSE FLAME IONIZATION DETECTOR
DURING SPARK IGNITION ENGINE COLD START
This chapter is intended to provide insight into the use of the fast-response flame ionization detector (hereafter referred to as FID) to monitor both in-cylinder vapor equivalence ratio and engine-out hydrocarbon emissions simultaneously during the engine start-up and warm-up period. First, a brief overview of the FID operating principle is presented. The use of the FID in standard exhaust emission sampling is then explained. Once the reader has been introduced to this normal use of the FID system, the development of a technique which can be used to monitor in-cylinder fuel vapor concentration in a liquid-fueled spark-ignition (SI) engine during cold start is detailed. The requirements for the FID sampling probes for both applications are treated, including a description of the calibration methods for both systems. Finally, common problems encountered in using the FID to make in-cylinder measurements is explained.
3.1 Overview of the Fast-Response Flame Ionization Detector
3.1.1 Operating Principle
The flame ionization detector is the main method used to monitor hydrocarbon concentrations in engine applications. The FID utilizes a chemi-ionization process to produce a voltage which is proportional to the hydrocarbon mole fraction of a sample fed into the detector. The FID consists of a flame fueled by a H2 - air mixture and an ion collector. A sample of gas to be analyzed is introduced at a constant mass flow rate into the flame where the ionization process occurs. The ion collector acts essentially as a carbon atom counter for the sample passing through the flame. As the hydrocarbon-containing sample passes
through the flame, a fixed fraction of the H-C bonds are broken producing ions. These ions migrate to the collector, thus producing a current. This current, in turn, is applied to a resistance which produces a voltage which is measured. The strength of the current (and hence, the voltage) depends upon the number of ions produced. Therefore, the voltage magnitude is directly related to the mole fraction of hydrocarbons present. Calibration is usually performed by monitoring the voltage response to a gas of known concentration supplied at the same conditions as experienced in the experiment.
Conventional FIDs normally have a time resolution on the order of one engine cycle. This poor resolution is unacceptable for sampling from the combustion chamber since the sample analyzed would consist of reactants (fuel and air), residual gas, and products.
Since detailed information concerning the mixture composition prior to combustion is required, a fast-response FID is used. The fast FID has greatly improved time resolution because the sampling line volumes are kept very small relative to the line volumes in a conventional system. Also, the sample is introduced into the flame at the nozzle outlet rather than being premixed prior to transfer to the flame chamber. Thus, the only mixing of the sample occurs by dispersion in the sample tube. As a result, the fast FID has excellent time resolution, capable of providing crank angle-resolved data.
3.1.2 Transit Time
The voltage signal obtained by the data acquisition system from the FID does not provide a real-time representation of in-cylinder events due to the inherent transit time required for the gas sample to travel through the sample tube, tee-top, and FID tube and reach the detector. In exhaust port applications, the transit time can be modeled using a quasi-steady isothermal flow analysis incorporating the tube geometries. This is valid as the driving pressure differential fluctuates very little. The Cambustion HFR-400 system is accompanied by software (SATFLAP) to predict the transit times for a given sampling geometry. Since the transit time is essentially constant throughout the cycle, a constant