HAL Id: hal-00317309
https://hal.archives-ouvertes.fr/hal-00317309
Submitted on 2 Apr 2004
HAL is a multi-disciplinary open access
archive for the deposit and dissemination of
sci-entific research documents, whether they are
pub-lished or not. The documents may come from
teaching and research institutions in France or
abroad, or from public or private research centers.
L’archive ouverte pluridisciplinaire HAL, est
destinée au dépôt et à la diffusion de documents
scientifiques de niveau recherche, publiés ou non,
émanant des établissements d’enseignement et de
recherche français ou étrangers, des laboratoires
publics ou privés.
Acceleration of oxygen ions in the dynamic magnetotail
J. Birn, M. F. Thomsen, M. Hesse
To cite this version:
J. Birn, M. F. Thomsen, M. Hesse. Acceleration of oxygen ions in the dynamic magnetotail. Annales
Geophysicae, European Geosciences Union, 2004, 22 (4), pp.1305-1315. �hal-00317309�
SRef-ID: 1432-0576/ag/2004-22-1305 © European Geosciences Union 2004
Annales
Geophysicae
Acceleration of oxygen ions in the dynamic magnetotail
J. Birn1, M. F. Thomsen1, and M. Hesse2
1Los Alamos National Laboratory, Los Alamos, New Mexico, USA 2NASA Goddard Space Flight Center, Greenbelt, Maryland, USA
Received: 15 May 2003 – Revised: 28 August 2003 – Accepted: 4 September 2003 – Published: 2 April 2004
Abstract. The substorm-related acceleration and flux
in-creases of energetic oxygen ions are studied on the basis of test particle orbits in the fields obtained from an MHD sim-ulation of plasmoid formation and ejection and the collapse (dipolarization) of the inner tail. The simulated fluxes show large anisotropies and nongyrotropic effects, phase bunch-ing, and spatially and temporally localized beams. The en-ergy distribution of O+in the region of an earthward beam in the near tail becomes significantly harder, more pronounced than for protons, in qualitative agreement with observations. The simulation also shows tailward beams of energetic O+ ions closely associated with the passage of a plasmoid, both inside the plasma sheet boundary and inside the central plasma sheet, consistent with observations in the far tail. The acceleration at the near-Earth x-type neutral line produces a narrow duskward beam of energetic O+ in the duskward extension of the x-line, which was not found to be as pro-nounced in proton test particle simulations.
Key words. Magnetospheric physics (energetic particles,
trapped; magnetotail; storms and substorms)
1 Introduction
Large increases in fluxes of energetic ions from a few tens of keV to hundreds of keV are often observed in the tail, commonly in association with substorms. Most of these ob-servations of flux changes in the near and far tail concerned protons or could not distinguish protons from heavier ions. Fritz and Wilken (1976) concluded from ATS-6 observations (with supporting solar wind data from IMP-7 and IMP-8) that heavy ions are energized inside the magnetosphere during substorm type injection events. Ipavich et al. (1984) demon-strated substantial flux increases of 112–157 keV/e O+ions in ISEE-1 observations of the tail plasma sheet, apparently correlated with activity. M¨obius et al. (1987) investigated
Correspondence to: J. Birn
(jbirn@lanl.gov)
heavy energetic ion fluxes before and after substorm onset, using AMPTE/IRM data. They found large earthward di-rected plasma flows concurrent with energetic proton fluxes. The fluxes of ions of ionospheric origin, such as oxygen, were also enhanced and the spectra became considerably harder, more pronounced for oxygen than for protons.
Characteristic features of energetic heavy ions have also been found in the more distant tail. ISEE-3 and, more re-cently, Geotail observations have led to a picture of tail-ward propagating plasmoids that are enveloped by a sheath of tailward streaming energetic ions, presumably mostly pro-tons (e.g. Scholer, 1984). The characteristics of heavier ions have been studied more recently. Investigating plasmoid or flux rope encounters ∼100 REdowntail, Lui et al. (1994) re-ported high variability of the ion composition but did not find a consistent trend in the composition changes. In contrast, several authors found tailward energetic oxygen streams (and other heavy ions) in association with substorms or pseudo breakups and the passage of plasmoids or flux ropes. The oxygen beams tend to be highly collimated in the tailward direction (Wilken et al., 1995; Zong et al., 1998). They can be detected in both the central plasma sheet and the plasma sheet boundary layer (Jacquey et al., 1994), and they are as-sociated with tailward plasma flow and southward magnetic field components (Christon et al., 1994; Jacquey et al., 1994; Wilken et al., 1995; Zong et al., 1998).
Test particle simulations in dynamically changing fields, modeling substorm effects in the inner tail, have been suc-cessfully used to study the acceleration of energetic charged particles in the energy range from tens to hundreds of keV (Delcourt and Sauvaud, 1994; Birn and Hesse, 1994; Birn et al., 1997a, 1998; Li et al., 1998; Zaharia et al., 2000). These simulations have demonstrated that substorm-related injections of energetic particles in the inner tail can be under-stood on the basis of the localized induced electric field asso-ciated with the collapse (dipolarization) of the magnetic field in the inner tail during the expansive phase of substorms. Delcourt and Sauvaud (1994) also studied the acceleration of O+ions and found dramatic spectral changes with energy
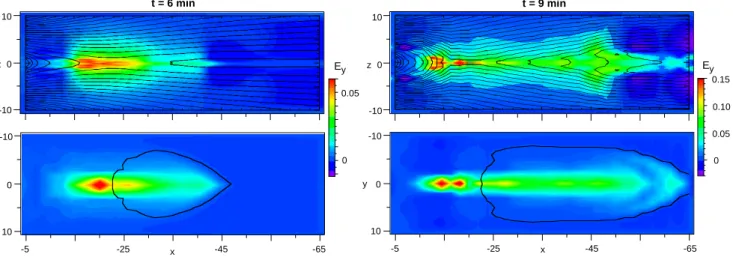
10 0 -10 z 0.15 0.05 t = 6 min 0 0.10 t = 9 min 0.05 0 Ey -10 0 10 y -5 -25 x -45 -65 10 0 -10 z -5 -25 x -45 -65 -10 0 10 y Ey
Fig. 1. Color-coded cross-tail electric field Eyobtained from the MHD simulation (Birn and Hesse, 1996) at two different times, as indicated. The top panels show Ey, at y=0, together with magnetic field lines, the bottom panels show Eyat z=0, together with the magnetic neutral line. The near-Earth part of the neutral line represents the x-line at the reconnection site, whereas the tailward part is the o-line in the center of the plasmoid, propagating tailward with the plasmoid. Note that the color scale for Eyis different for the different times. The electric field unit corresponds to ∼80 mV/m.
increases exceeding those of protons. A combination of test particle orbit integration with a two-dimensional MHD simu-lation of plasmoid formation, and ejection, has also success-fully reproduced energetic proton signatures in the more dis-tant tail (Scholer and Jamitzky, 1987, 1989; Sachsenweger et al., 1989).
Although enhanced oxygen outflow from the ionosphere presumably plays a role in the observed flux increases, addi-tional acceleration appears necessary to achieve the observed high energies of tens or hundreds of keV. In this paper we will extend previous test particle simulations to investigate heavier ions, specifically O+. We will focus on the acceler-ation mechanisms and the corresponding flux increases, tak-ing the presence of some seed population of oxygen ions in the plasma sheet as granted.
2 Background fields and numerical procedure
As in earlier test particle simulations, we use the magnetic and electric fields obtained by an MHD simulation of mag-netotail dynamics (Birn and Hesse, 1996) as the basis for the orbit integration. This simulation covers the region from x=−5 REout to x=−65 RE. The dynamic breakup phase is preceded by a simulated growth phase during which an ex-ternal electric field is applied at the high-latitude boundary of the simulation box. This leads not only to the energy buildup in the tail lobes, but also to the formation of a thin current sheet in the near tail with a half-thickness of ∼1800 km, char-acteristic for the late growth phase and presumably crucial for the onset of an instability that initiates the breakup phase. The breakup of this current sheet is initiated by impos-ing finite resistivity (definimpos-ing the time t =0). A neutral line forms as a closed curve at t ≈2 min. It subsequently expands across and down the tail, corresponding to the tailward
mo-tion of a plasmoid. The near-Earth part of the neutral line, representing the x-line, remains located near x≈−23 (units are in RE). Rapid increases of temperature, flow, and elec-tric field start at t ≈5 min, leading eventually to peak val-ues of Ey of 10-20 mV/m. Figure 1 shows the color-coded cross-tail electric field Eyfrom the MHD simulation for two different times. The two top panels show Ey together with magnetic field lines in the x, z plane (y=0), the bottom pan-els show Ey in the equatorial plane (z=0) together with the magnetic neutral line, consisting of the near-Earth x-line and the o-line inside the departing plasmoid farther tailward. The peak of the electric field is only initially located near the x-line but subsequently moves earthward, while the magnitude increases. The earthward propagation stops near x=−13, where the flow from the x-line is slowed down by the in-creasing magnetic field, leading to a pile-up of magnetic flux from approximately x=−10 tailward. It is noteworthy that the region of enhanced electric field is localized in all three space dimensions.
Using the magnetic and electric fields from the MHD sim-ulation, we integrated the full O+ion orbits backward in time until they reached the boundary of the simulation box or the initial state. At the near-Earth boundary the particles were reflected back into the box, simulating mirroring closer to the Earth, but neglecting the loss cone and the flight time from the boundary to the actual mirror point and back. This boundary condition also disregards the potential new injec-tion of ionospheric particles. The instantaneous local electric and magnetic fields were interpolated from the results of the MHD run, which were stored for time steps of 0.5 Alfv´en times (corresponding to approximately 3 s).
Fluxes of particles at particular locations and times can be estimated by applying Liouville’s theorem and imposing dis-tribution functions at the boundaries of the simulation box
and for the initial state. The conservation of the phase space density f along the particle trajectory then gives the value of the distribution function at the final location. The im-posed initial distributions are kappa distributions (Vasyliu-nas, 1968) f = ˆf " 1 + Win (κ −1.5)Wo #−κ−1 , (1)
where Winis the initial kinetic energy and Wois the average energy. We found that the typical source locations of acceler-ated O+ions were inside the dawn flank plasma sheet. Since observations in the tail indicate similar average energies for plasma sheet protons and oxygen ions (e.g. Frank et al., 1977; Peterson et al., 1981), we used the same temperature for both species and chose parameters typical for protons in the mod-erately active plasma sheet (Christon et al., 1988, 1991), con-sistent with the initial and boundary temperature of the MHD run
κ =5.5 Wo=5 keV. (2)
A spatial variation is now contained only in the factor ˆf . Through phase space mapping, the final values of the dis-tribution function can be derived from the initial disdis-tribution. Using (1) we find f = ˆf " 1 + Wf in−1W (κ −1.5)Wo #−κ−1 , (3)
where Wf in is the final energy of a particle and 1W the energy gain (or loss, for 1W <0). If we neglect the weak variation of ˆf, we find that the major variation of fluxes at a given energy Wf instems from the energy gain 1W . Particles that start out with low energy are more abundant than higher-energy particles. If they gain a lot of higher-energy, their high initial f values map to the final high-energy phase point. There-fore, even without imposing specific initial distribution func-tions, the energy gain can be taken as a measure of flux en-hancement when we compare fluxes at a given energy Wf in for different times and phase space locations. In fact, if we had chosen a Maxwellian instead of a kappa distribution, the logarithm of the phase space density, and hence of the flux, would be a linear function of the energy gain.
Ideally, one phase space trajectory can provide one f value of the final distribution function at a chosen location in space and time. This procedure works very well when the phase space mapping between the initial and final locations is a smooth function of the phase coordinates (cf. Curran and Goertz, 1989). However, in a highly nonlinear system, such as the spatially and temporally variable magnetotail, chaotic effects may dominate in some regions of the phase space, i.e., a slight variation in the final location or velocity can lead to vastly different initial locations and velocities, and vice versa. In this case the mapped value of the distribution function can fluctuate significantly in a small neighborhood of the chosen phase space location. The actual value to be compared with observations then has to be an average of f
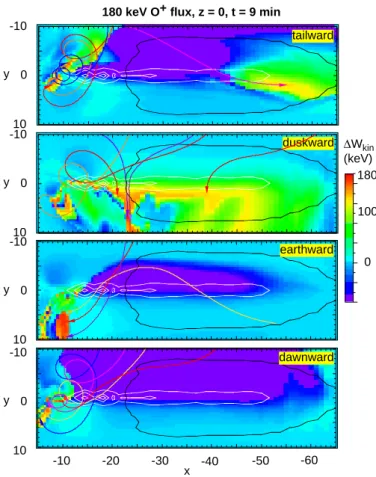
180
0 100
∆Wkin (keV) 180 keV O+ flux, z = 0, t = 9 min
-10 10 0 y -10 10 0 y -10 10 0 y -10 10 0 y -30 -40 -50 -60 x -20 -10 duskward earthward tailward dawnward
Fig. 2. Characteristics of 180 keV O+fluxes in the equatorial plane at t=9 min, viewed from the north. The color represents the en-ergy gain of an ion traced backwards from the given location; this energy gain is also a measure of the flux increase at the given lo-cation. The four panels correspond to four different flux directions. The white contours represent the magnitude of the cross-tail electric field, and the black line shows the magnetic neutral line at t=9 min. The length unit here and in all other simulation figures is 1 RE. The colored individual lines show projections of orbits ending at the point of the arrow at t=9 min, illustrating orbits with high en-ergy gain.
over such a neighborhood, using a sufficient number of phase space trajectories. (This closely resembles the collection of phase space distributions from observed counts of particles.)
3 Overview
Figure 2 provides an overview of the characteristics of O+ fluxes in the equatorial plane at t=9 min at a typical en-ergy of 180 keV. The four panels represent four different flux directions. No phase space averaging has been used. The color coding in this and subsequent figures can hence be interpreted in two ways. The color of each pixel directly represents the energy gain of an ion traced backwards from the given location. As discussed in Sect. 1, this energy gain is also a measure of the flux increase at the given location, since the initial phase space density is higher for lower initial energy. The white contours represent the magnitude of the
-10 -20 -30 -40 -50 -60 4 80 0 4 4 -4 -4 -4 0 0 0 0 160 x z z z ∆Wkin (keV)
Fig. 3. Characteristics of 180 keV protons and O+fluxes in the duskward direction at y=8 and t=9 min. The color-coding again represents the energy gain of an ion traced backwards from the given location, taken as a measure of the flux increase at the given location. The two bottom panels represent the same O+ fluxes shown with different color scales. The one for the middle panel is chosen to be the same as for the protons, while the one for the bottom panel extends to the maximum energy gain, to emphasize the peak values. The red and orange lines represent the separatrices (boundaries between closed and open field lines) at y=0 and y=8, respectively.
cross-tail electric field, and the black line shows the magnetic neutral line at t =9 min. The length unit here and in all other simulation figures is 1 RE. The colored individual lines show projections of selected orbits of accelerated O+ions ending at the point of the arrow at t=9 min. These locations were selected to illustrate orbits with high energy gain. The colors for the trajectories were chosen for maximum contrast only and have no specific meaning.
Figure 2 demonstrates that regions of enhanced energetic O+fluxes are generated in the near tail for all four flux di-rections, primarily in the area earthward and duskward from the region of enhanced cross-tail electric field. However, the spatial extent of these regions differs for the different flux di-rections. Specifically, the third panel of Fig. 2 shows a strong extended earthward beam near x=−10 that does not show up in the other flux directions. (Here we use the term “beam” in a rather general sense to denote particle fluxes with a lim-ited extension in velocity space, regardless of the direction relative to the magnetic field.) We will look at more of the characteristics of that beam in Sect. 4.
The signatures in the more distant tail differ even more for the different flux directions. The top panel of Fig. 2 shows a tailward beam extending slightly duskward and tailward from the region of enhanced electric field (white contour) near midnight. The tailward end of this beam is given by the neutral line (black contour), which represents the o-line in-side the tailward moving plasmoid. Such beams have indeed been observed in the distant tail, associated with the passage of a plasmoid or substorm-related fast tailward flow (Chris-ton et al., 1994; Jacquey et al., 1994; Wilken et al., 1995; Zong et al., 1998; Rouquette et al., 2000). The particle tra-jectory ending in this region shows the typical source region, located on the dawn side of the near tail. Although this parti-cle comes from the vicinity of the location of the near-Earth x-line, its acceleration takes place much farther tailward, be-tween about 40 and 50 REnear midnight, when it crosses the region of enhanced Ey associated with fast tailward plasma flow.
Figure 2 (second panel) also shows a well focused duskward beam extending duskward from the near-Earth x-line. Such a beam was not seen in proton test particle simulations (Birn et al., 1997a). Enhanced duskward fluxes are also seen over most of the extent of the region of en-hanced Ey tailward of the x-line, whereas there are no in-creases of earthward and dawnward fluxes tailward of about x=−15 RE.
While the regions of enhanced fluxes differ considerably for the four panels of Fig. 2, the trajectories of the O+ions that comprise these flux regions in the inner tail are quite similar, so that one might consider the different regions as belonging to different phases of a bunch of particles, acceler-ated in the duskward direction through the localized electric field in the inner tail, then turning subsequently earthward (third panel), dawnward (bottom panel), and tailward (top panel) in distinct spatial regions, as defined by the finite Lar-mor radius.
Figure 3 demonstrates the characteristics of the duskward fluxes in the x, z plane at y=8, duskward of the acceleration region, using again the energy gain as a proxy for the fluxes, for both 180 keV protons and O+ions at t=9 min. The top panel shows proton fluxes and the two bottom panels repre-sent the same O+fluxes but with different color scales. The color scale for the middle panel is chosen to be the same as for the protons, while the one for the bottom panel extends to the maximum energy gain, to emphasize the peak values. The red and orange lines represent the separatrices (bound-aries between closed and open field lines) at y=0 (wider con-tour) and y=8, respectively.
A comparison of the top two panels of Fig. 3 demon-strates that in the inner tail the cross-tail electric field asso-ciated with the earthward flow provides similar acceleration for protons and oxygen ions. The larger oxygen gyroradius leads to a more visible spatial bunching of the regions of en-hanced fluxes, while these regions appear more chaotic for the protons. Even higher spatial resolution could possibly resolve the high-flux regions for protons as well (they are indeed resolved just earthward of the neutral line location).
y -5 -10 -15 -20 -25 x 0 80 160 -80 ∆Wkin (keV) -10 10 0 -10 10 0 -10 10 0 t = 7 min t = 9 min t = 8 min
Fig. 4. Characteristics of earthward 180 keV O+fluxes in the equa-torial plane for t=7, 8, 9 min. The color-coding again represents the energy gain of an ion traced backwards from the given loca-tion, taken as a measure of the flux increase at the given location. The white contours represent the magnitude of the cross-tail electric field, and the red line shows the magnetic neutral line as in Fig. 2. The black line with an arrow at the end represents a typical orbit with substantial energy gain. The bottom panel is identical to the earthward part of the third panel in Fig. 2.
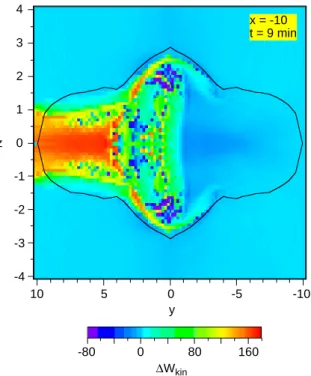
However, integration over finite phase space volumes again would wash out these structures in actual measurements. In the more distant tail, the electric field associated with fast tailward flows tailward of the x-line is much more effective in accelerating oxygen ions than protons. It should hence lead to a relatively more significant flux enhancement for oxygen ions. (For the absolute fluxes, however, we have to take into account that oxygen is much less abundant in the source re-gion.) The bottom panel of Fig. 3 shows more clearly the peak value of accelerated O+. This peak flux is highly local-ized, extending duskward from the near-midnight portion of the near-Earth neutral line, as shown in Fig. 2. (The neutral line bends tailward away from midnight and does not extend to y=8.) 4 3 2 1 0 -1 -2 -3 -4 z 10 5 0 -5 -10 y x = -10 t = 9 min 0 80 160 -80 ∆Wkin
Fig. 5. Characteristics of 180 keV O+fluxes in the earthward direc-tion at x=−10 and t=9 min in a view towards the Earth with dusk to the left. The color coding again represents the energy gain of an ion traced backwards from the given location, taken as a measure of the flux increase at the given location. The black lines represent the separatrices (boundaries between closed and open field lines) at this location.
4 Inner tail
Now we look more closely at the properties of energetic O+ fluxes in the inner tail, earthward of the location of the near-Earth neutral line (Fig. 1) at x≈−23 RE. Specifically, we will further investigate properties of the earthward beam on the dusk side shown in Fig. 2. Figure 4 shows the tempo-ral variation of the earthward fluxes in the same format as in Fig. 2, together with contours of Ey and the near-Earth neutral line at each instant. The figure demonstrates that the earthward beam persists over several minutes at roughly the same location. However, a secondary beam closer to the Earth is more variable in space and time. As illustrated by the superposed orbit in the second panel, this beam is asso-ciated with ions that have completed more than a full gy-ration after passing through the accelegy-ration region of en-hanced Ey, whereas the orbits shown in the third panel of Fig. 2 demonstrate that the major beam consists of ions that have just turned earthward after their cross-tail acceleration. Obviously, because of their dependence on gyroradius and gyroperiod, these features can be expected to vary with en-ergy, space, and time.
Figure 5 shows the spatial characteristics of the earth-ward 180 keV O+fluxes in a tail cross-section at x=−10 for t =9 min. The black lines represent the separatrices (bound-aries between closed and open field lines) at this location.
2 1 -1 -2 2 1 0 -1 -2 vx -5 0 -10 lg f 0 vz
Fig. 6. Phase space density in the vx, vzplane at x=−10, y=5, z=0 and t=9 min. The f values are calculated using initial kappa distri-butions (see text). The black contours represent levels of constant
f for a slightly smoothed distribution.
The region of enhanced earthward flux is centered around the equatorial plane and occupies a significant portion of the duskside plasma sheet. Closer to midnight it extends into two layers just inside the plasma sheet boundary. The boundary here forms a bulge due to the advance of reconnection into the lobes and the corresponding expansion of the closed field line region. There are also some more chaotic occurrences of accelerated O+ions near the equatorial plane in this region.
The velocity space distribution of the earthward beam is investigated more closely at the location x=−10, y=5, z=0. Figure 6 shows the phase space density in the vx, vz plane (with the region of the beam more highly resolved), and Fig. 7 shows the angular distribution of the phase space den-sity on the earthward part of the sphere v=1.5 (180 keV), where φ measures the azimuth against the earthward direc-tion (positive toward dusk), and θ measures the elevadirec-tion an-gle of the velocity vector. To obtain these distributions we assumed the initial kappa distribution defined in (1) and (2). Apart from the only slightly disturbed original distribution centered around v=0, the figures show a focused, nearly mo-noenergetic earthward beam. The energy of the beam di-rectly corresponds to the gain in the duskward electric field shown in Fig. 1 and hence, constitutes a remote signal of the potential drop across this electric field. Figure 7 shows that the beam at this location and energy is slightly offset toward dawn, while there are some weaker fluxes forming a partial ring mainly toward dusk at larger angles from the earthward direction. 0 90 -5 0 -10 lg f 60 30 -30 -60 -90 0 90 60 30 -90 -60 -30 θ φ dawnward duskward
Fig. 7. Directional distribution of the phase space density in the
velocity space φ, θ plane (viewed earthward with dusk to the left) at x=−10, y=5, z=0 and t=9 min for earthward fluxes with v=1.5 (corresponding to 180 keV). The f values are calculated using ini-tial kappa distributions (see text).
Figure 8 shows the temporal variation of earthward O+ fluxes in this region, for various energies, at x=−10, z=0 and three locations in y. The fluxes are now calculated us-ing initial kappa distributions in Eq. (1) with the parameters given in Eq. (2). The absolute magnitude, however, is not calibrated. Figure 8 demonstrates that enhanced earthward fluxes occur at all energies above approximately 20 keV up to more than 300 keV. These fluxes are, however, highly vari-able in time.
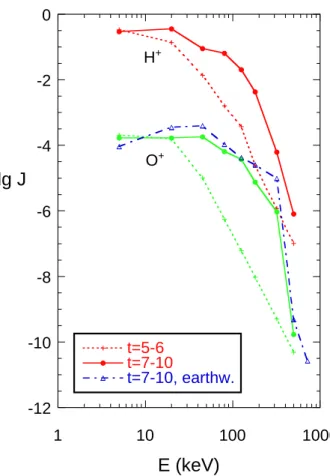
Figure 9 provides a comparison of the energy distributions of proton and oxygen ion fluxes in this region, showing the fluxes as a function of energy at x=−10, y=3, z=0. The particle fluxes are again calculated using the initial kappa distribution (1) with the parameters given in (2). The dot-ted and solid lines represent omnidirectional fluxes averaged over 14 different directions before and after the injection, re-spectively, while the dash-dotted line gives the distribution of the earthward O+fluxes only. Figure 9 demonstrates that the oxygen flux enhancements are more significant than those of the energetic protons in this region, leading to a flatter (harder) distribution up to more than 100 keV. This result is also in qualitative agreement with observations (M¨obius et al., 1987).
-8 -7 -6 -5 -4 -3 -2 -1 0 350 360 370 380 390 400 y = 5 logJ t (min) 5 keV 320 keV 180 keV 80 keV 125 keV 245 keV 45 keV 20 keV -7 -6 -5 -4 -3 -2 -1 0 y = 3 log J 5 keV 320 keV 20 keV 45 keV 80 keV 125 keV 180 keV -8 -7 -6 -5 -4 -3 -2 -1 0 y=0 log J 180 keV 80 keV 320 keV 5 keV 20 keV
Fig. 8. O+fluxes in the earthward direction as a function of time for various energies at x=−10, z=0 and three locations in y. The fluxes are calculated using initial kappa distributions (see text).
5 Outer tail
We now focus on properties in the region of the depart-ing plasmoid in the more distant tail, tailward of ∼25 RE. Specifically, we look at the properties of the tailward oxygen ion beam shown in the top panel of Figure 2, extending ap-proximately from x=−50 to x=−60. Figure 10 shows the spatial characteristics of 180 keV proton and tailward O+ fluxes in a tail cross section (with dusk to the left) at x=−55 and t=9 min. The color-coding again represents the energy gain of ions traced backwards in time from the given location as a proxy of the flux increase. The black lines represent the separatrices (boundaries between closed and open field lines) at this location. The energetic protons (top panel) form two layers just inside the separatrix on the dusk side. The O+ ions also show similar layers. They are located farther inside the separatrix, because the oxygen ions, for a given energy, have lower speed along the magnetic field, which makes the inward displacement from E×B drift more effective, that is, for the same distance traveled along the tail the oxygen ion becomes displaced more than the proton with the same en-ergy. The oxygen ions, however, also show a stronger inten-sification around both the duskward equatorward edge of the boundary layers and the enhanced fluxes near the equatorial plane closer to midnight, which are not seen for the protons.
-12
-10
-8
-6
-4
-2
0
1
10
100
1000
t=5-6
t=7-10
t=7-10, earthw.
lg J
E (keV)
O
+H
+Fig. 9. O+fluxes as a function of energy at x=−10, y=3, z=0. The fluxes are calculated using initial kappa distributions (see text) and are averaged over 14 different directions. The dash-dotted line represents earthward O+flux only.
The close temporal association between the tailward ener-getic O+beam and the passage of the o-line is demonstrated in Fig. 11, which shows vx and Bzfrom the MHD simula-tion, together with the tailward 180 keV O+flux at x=−55, y=2, z=0 as functions of time. At t ≈7.5 min Bzturns neg-ative, showing the passage of the o-line in the center of the plasmoid (see also Fig. 1). Modest tailward plasma flow is present already before the passsage of the o-line but the main increase occurs when Bz turns southward. The increase of the O+flux occurs basically simultaneously.
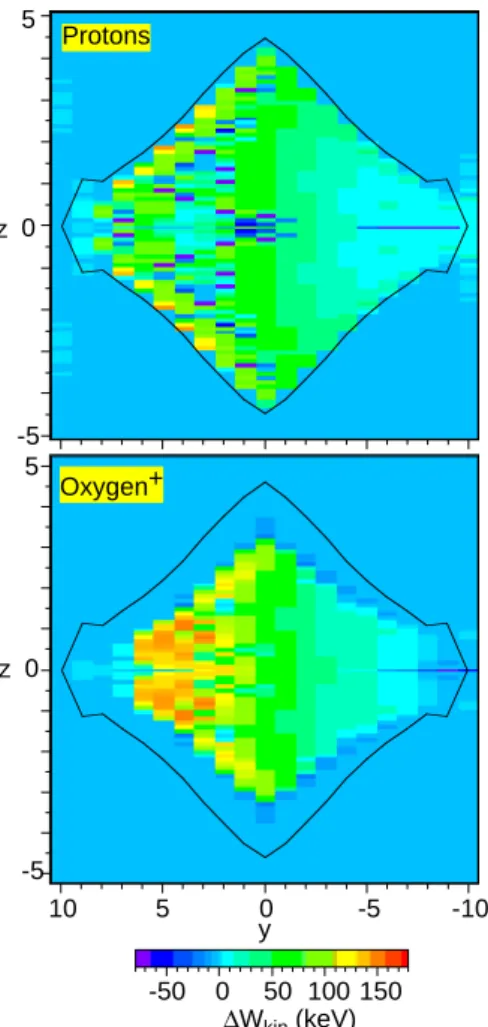
Figure 12 demonstrates the velocity space distributions of the tailward beams, showing 180 keV O+ fluxes as a func-tion of flux direcfunc-tion, at x=−55, y=5 and three locafunc-tions in zfor t =9 min. The angle θ measures the elevation angle of the flux direction against the equatorial plane (with θ =90◦ for northward flux) and φ is the azimuth in the equatorial plane (with φ=0 corresponding to tailward flux and φ=90◦ corresponding to dawnward flux). The color-coding again represents the energy gain as a measure of the flux increase. The black crosses indicate the local magnetic field direction at each location. Figure 12 demonstrates that at each loca-tion in z, the beams are narrowly focused in velocity space with a tailward and slightly duskward direction, independent of the magnetic field direction. Figure 12 also shows ridges
0 50 100150 -50 ∆Wkin (keV) 10 5 0 -5 -10 5 0 -5 5 0 -5 Protons Oxygen+ y z z
Fig. 10. Characteristics of 180 keV proton and O+ fluxes in the tailward direction at x=−55 and t=9 min, as seen from the tail with dusk to the left. The color coding again represents the en-ergy gain of ions traced backwards in time from the given location, taken as a measure of the flux increase at the given location. The black lines represent the separatrices (boundaries between closed and open field lines) at this location.
structures resembling ridges found by Martin and Speiser (1988) in ion test particle investigations of the vicinity of an x-type neutral line. If one did not know the cause of either structure, one might suspect similar origins. However, the ridges discussed by Martin and Speiser are a consequence of the acceleration along the x-line and subsequent dispersion in its vicinity, whereas our structures are found far away. They are also not organized by the local magnetic field. There is a similarity, however, in a more general sense, namely that these structures are related to an abrupt change in the his-tory of the phase space trajectories that connect to the struc-ture. In our case it is a change in the direction of ∇B around midnight in the departing plasmoid, which changes the drift direction and thus, the origin of the particles from dawn to dusk, whereas the neutral line plays the dividing role in the ridge structure of Martin and Speiser.
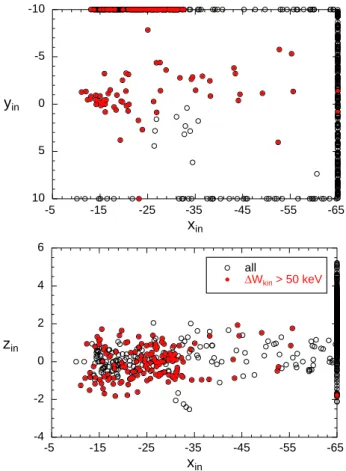
Figure 13 demonstrates the source regions of the tailward beam shown in Fig. 10. The open circles represent the origins
-7 -6 -5 -4 -3 -2 0 2 4 6 8 10 log J t (min) -0.05 -0.04 -0.03 -0.02 -0.01 0.00 0.01 B z -1.0 -0.8 -0.6 -0.4 -0.2 0.0 x = -55, y = 2, z = 0 v x
Fig. 11. Temporal evolution of characteristic parameters at
x=−55, y=2, z=0; (top) plasma velocity component vx, (center) magnetic field component Bz, and (bottom) 180 keV tailward O+ fluxes. The fluxes are calculated using initial kappa distributions (see text). At t≈7.5 Bzturns negative, showing the passage of the o-line in the center of the plasmoid; see also Figure 1. At about the same time the tailward flow speed and the O+flux increase.
of all orbits contributing to Fig. 10, while the circles filled with red correspond to those orbits with an energy gain above 50 keV (that is, an initial energy below 130 keV), indicating the sources of accelerated ions contributing to the regions of enhanced flux. The source locations of particles with high energy gain are widely distributed, although most come from the dawn boundary and the interior tail region −35<x<−15 surrounding the location of the near-Earth x-line (x≈−23). However, as illustrated by the orbit in the top panel of Fig. 2, which ends at x=−55, the acceleration takes place mostly not near the x-line but when the particle crosses the more extended region of enhanced Eytailward from it.
6 Summary and conclusions
We have used the electric and magnetic fields from an MHD simulation of magnetotail dynamics, modeling reconnection, plasmoid ejection, and the collapse (dipolarization) of the near tail, to investigate the effects on heavy ions, specifically, O+. This is an extension of previous work, studying ener-getic protons and electrons as test particles in the same fields
90
o0
o-90
o90
o0
o-90
o90
o0
o-90
o90
o0
o-90
oφ
θ
z = -1.6
z = -0.8
z = 0
180
0
100
∆W
kin(keV)
Fig. 12. Phase space distribution of 180 keV O+fluxes in the tail-ward direction at x=−55, y=5 and three locations in z for t=9 min. The color-coding again represents the energy gain of ions traced backwards in time from the given phase space location, taken as a measure of the flux. The black crosses represent the local magnetic field direction at each location.
(Birn et al., 1997a, 1998). These studies have demonstrated that the electric field associated with the collapse of the inner tail is able to cause the acceleration and the typical injection characteristics of energetic protons and electrons in the inner tail (e.g. Birn et al., 1997).
Oxygen ions in the considered energy range of tens to hun-dreds of keV are highly nonadiabatic. Therefore, as might be expected, the simulated fluxes show large anisotropies and nongyrotropic effects, phase bunching, and spatially and temporally localized beams. Similar effects were found by
-10 -5 0 5 10 yin xin -5 -15 -25 -35 -45 -55 -65 -4 -2 0 2 4 6 all ∆Wkin > 50 keV zin xin -5 -15 -25 -35 -45 -55 -65
Fig. 13. Origins of the O+ions contributing to the tailward fluxes in the distant tail. The open circles represent the origins of all orbits contributing to Fig. 9, while the circles filled with red correspond to orbits with an energy gain above 50 keV, indicating the sources of accelerated ions contributing to the regions of enhanced flux. These particles come primarily from the dawn boundary and the interior tail. The plot boundaries are also the simulation boundaries, where the backward integration of orbits was stopped. This is the reason why many symbols line up along these boundaries.
Delcourt and Sauvaud (1994). The beams may serve as re-mote indicators of the potential drop associated with the in-duced cross-tail electric field resulting from the tail collapse. The energy distribution of O+in the region of an earthward beam in the near tail becomes significantly harder, more pro-nounced than for protons, in qualitative agreement with ob-servations (M¨obius et al., 1987).
The duskward electric field at the near-Earth neutral line has a pronounced, albeit localized, effect on O+, causing a narrow beam of duskward flux in the duskward extension of the near-Earth x-line. This effect was not as pronounced in investigations of proton orbits, so that oxygen ions might provide a better indicator for the presence of the near-Earth neutral line. An alternative remote indicator of an x-type neu-tral line was found by Martin and Speiser (1988) as a ridge structure in ion velocity distributions in the vicinity of the neutral line.
Enhanced duskward fluxes of energetic O+(at a somewhat lower level) were also found for most of the region duskward
of the region of tailward plasma flow. This tailward flow is present primarily in the earthward part of the departing plas-moid, where Bz<0. A corresponding effect of dawnward acceleration was not found in the part of the plasmoid that is tailward of the o-line. (This might change, however, at larger distances than considered here, when the plasmoid moves tailward with more uniform speed.) The flux increase on the dusk side is stronger for energetic O+ions than for protons.
The test particle simulations also show tailward beams of O+in the more distant tail. These beams are found inside the duskside plasma sheet boundary with a somewhat larger off-set away from the boundary than for the protons. This offoff-set can be easily understood because oxygen ions, for a given energy, have lower speed along the magnetic field, which makes the inward displacement from E×B drift more effec-tive. We also found a tailward beam closer to midnight and closer to the equatorial plane, which was not seen in the en-ergetic protons at the same location and time. This beam was found just earthward of the o-type magnetic neutral line in the center of the passing plasmoid, associated with neg-ative Bz. These features are also consistent with observed energetic ion beams in the distant tail (Christon et al., 1994; Jacquey et al., 1994; Wilken et al., 1995; Zong et al., 1998).
The primary source region for all investigated accelerated O+ions is the dawn flank plasma sheet. However, our ap-proach did not account for an ionospheric source, which was excluded by the mirroring condition at the near-Earth bound-ary of the simulation box. We found three major acceleration regions. As mentioned before, acceleration at the near-Earth x-line itself is the cause of a narrow duskward beam in the duskward extension of the x-line. The oxygen ions in the in-ner tail were accelerated in the enhanced cross-tail electric fields earthward of the x-line, associated with the earthward plasma flow from the x-line and the collapse of the inner tail. This is similar to the results for protons and electrons (Birn et al., 1997a, 1998). The energetic O+ions contributing to the tailward beam in the distant tail were accelerated in the cross-tail electric fields associated with the extended tailward plasma flow tailward of the x-line, similar to the duskward fluxes of energized O+found at smaller distances.
In summary, we find that the finite extent of the cross-tail electric field, associated with fast earthward and cross-tailward flows in the dynamic magnetotail, is the crucial element in shaping the distributions and fluxes of energetic particles, for heavy ions as well as for protons and electrons. As to be expected, and consistent with earlier investigations (e.g. Del-court and Sauvaud, 1994), the effects of spatial and tempo-ral non adiabaticity and non gyrotropy are much more pro-nounced in heavy ions than in lighter ions and electrons.
Acknowledgements. This work was supported by the U.S.
Depart-ment of Energy’s Office of Basic Energy Sciences through its Geo-sciences Research Program and by NASA’s Sun Earth Connection Theory Program. Topical editor T. Pulkkinen thanks E. M¨obius and D. Delcourt for their help in evaluating this paper.
References
Birn, J. and Hesse, M., Particle acceleration in the dynamic magne-totail: Orbits in self-consistent three-dimensional MHD fields, J. Geophys. Res., 99, 109, 1994.
Birn, J. and Hesse, M.: Details of current disruption and diversion in simulations of magnetotail dynamics, J. Geophys. Res., 101, 15, 345, 1996.
Birn, J., Thomsen, M. F., Borovsky, J. E., Reeves, G. D., McComas, D. J., Belian, R. D., and Hesse, M., Substorm: Ion injections: Geosynchronous observations and test particle orbits in three-dimensional dynamic mhd fields, J. Geophys. Res., 102, 2325, 1997a.
Birn, J., Thomsen, M. F., Borovsky, J. E., Reeves, G. D., McCo-mas, D. J., and Belian, R. D.: Characteristic plasma properties of dispersionless substorm injections at geosynchronous orbit, J. Geophys. Res., 102, 15 345, 1997b.
Birn, J., Thomsen, M. F., Borovsky, J. E., Reeves, G. D., McCo-mas, D. J., Belian, R. D., and Hesse, M.: Substorm electron injections: Geosynchronous observations and test particle sim-ulations, J. Geophys. Res., 103, 9235, 1998.
Christon, S. P., Mitchell, D. G., Williams, D. J., Huang, C. Y., Frank, L. A., and Eastman, T. E.: Energy spectra of plasma sheet ions and electrons from ∼50 eV/e to ∼1 MeV during plasma sheet temperature transitions, J. Geophys. Res., 93, 2563, 1988. Christon, S. P., Williams, D. J., and Mitchell, D. G.: Spectral
char-acteristics of plasma sheet ion and electron populations during disturbed geomagnetic conditions, J. Geophys. Res., 96, 1, 1991. Christon, S. P., Gloeckler, G., Williams, D. J., Mukai, T., McEntire, R. W., Jacquey, C., Angelopoulos, V., Lui, A. T. Y., Kokubun, S., Fairfield, D. H., Hirahara, M., and Yamamoto, T.: Energetic atomic and molecular ions of ionospheric origin observed in dis-tant magnetotail flow-reversal events, Geophys. Res. Lett., 21, 3023, 1994.
Curran, D. B. and Goertz, C. K., Particle distributions in a two-dimensional reconnection field geometry, J. Geophys. Res., 94, 272, 1989.
Delcourt, D. C. and Sauvaud, J. A.: Plasma sheet ion energization during dipolarization events, J. Geophys. Res., 99, 97, 1994. Frank, L. A., Ackerson, K. L., and Yeager, D. M.: Observations of
atomic oxygen (O+) in the earth’s magnetotail, J. Geophys. Res., 82, 129, 1977.
Fritz, T. A. and Wilken, B.: Substorm generated fluxes of heavy ions at the geostationary orbit, in Magnetospheric Particles and Fields, edited by B. M. McCormac, p. 171, D. Reidel, 1976. Ipavich, F. M., Galvin, A. B., Gloeckler, G., Hovestadt, D., Klecker,
B., and Scholer, M.: Energetic (> 100 keV) O+ ions in the plasma sheet, Geophys. Res. Lett., 11, 504, 1984.
Jacquey, C. D., Williams, D. J., McEntire, R. W., Lui, A. T. Y., Angelopoulos, V., Christon, S. P., Kokubun, S., Yamamoto, T., Reeves, G. D., , and Belian, R. D.: Tailward energetic ion streams observed at ∼100 REby geotail-epic associated with ge-omagnetic activity intensification, Geophys. Res. Lett., 21, 3015, 1994.
Li, X., Baker, D. N., Temerin, M., and Reeves, G. D.: Simulation of dispersionless injections and subsequent drift echoes of ener-getic electrons associated with substorms, Geophys. Res. Lett., 25, 3763, 1998.
Lui, A. T. Y., Williams, D. J., Christon, S. P., McEn-tire, R. W.: Angelopoulos, V., Jacquey, C., Yamamoto, T., and Kokubun, S., A preliminary assessment of ener-getic ion species in flux ropes/plasmoids in the distant tail,
Geophys. Res. Lett., 21, 3019, 1994.
Martin, Jr., R. F. and Speiser, T. W.: A predicted energetic ion sig-nature of a neutral line in the geomagnetic tail, J. Geophys. Res., 93, 11, 521, 1988.
M¨obius, E., Scholer, M., Klecker, B., Hovestadt, D., Gloeckler, G., and Ipavich, F. M.: Acceleration of ions of ionospheric ori-gin in the plasma sheet during substorm activity, in Magnetotail Physics, edited by A. T. Y. Lui, 231, The Johns Hopkins Univer-sity Press, 1987.
Peterson, W. K., Sharp, R. D., Shelley, E. G., and Johnson, R. G.: Energetic ion composition of the plasma sheet, J. Geophys. Res., 86, 761, 1981.
Rouquette, S., Jacquey, C., and LeContel, O.: Fast tailward stream observed in the distant tail associated with substorm: a multi-instrument study, Geophys. Res. Lett., 27, 3571, 2000.
Sachsenweger, D., Scholer, M., and M¨obius, E.: Test particle ac-celeration in a magnetotail reconnection configuration, Geophys. Res. Lett., 16, 1027, 1989.
Scholer, M.: Energetic ions and electrons and their acceleration pro-cesses in the magnetotail, in Magnetic Reconnection in Space and Laboratory Plasmas, edited by E. W. Hones, Jr., 216, Am. Geophys. Union, 1984.
Scholer, M. and Jamitzky, F.: Particle orbits during the development of plasmoids, J. Geophys. Res., 92, 12,181, 1987.
Scholer, M. and Jamitzky, F.: Plasmoid-associated energetic ion bursts in the deep magnetotail: Numerical modeling of the boundary layer, J. Geophys. Res., 94, 2459, 1989.
Vasyliunas, V. M.: A survey of low-energy electrons in the evening sector of the magnetosphere with ogo 1 and ogo 3, J. Geophys. Res., 73, 2839, 1968.
Wilken, B., Zong, Q. G., Daglis, I. A., Doke, T., Livi, S., Maezawa, K., Pu, Z. Y., Ullaland, S., and Yamamoto, T.,: Tailward flowing energetic oxygen ion bursts associated with multiple flux ropes in the distant magnetotail: Geotail observations, Geophys. Res. Lett., 22, 3267, 1995.
Zaharia, S., Cheng, C. Z., and Johnson, J. R.: Particle transport and energization associated with substorms, J. Geophys. Res., 105, 18,741, 2000.
Zong, Q.-G., Wilken, B., Woch, J., Mukai, T., Yamamoto, T., Reeves, G. D., Doke, T., Maezawa, K., Williams, D. J.: Kokubun, S., and Ullaland, S., Energetic oxygen bursts in the distant magnetotail as a product of intense substorms: Three case studies, J. Geophys. Res., 103, 20,339, 1998.