Dynamics of Supply Chain Sustainability
by Jason Y. Pang
Bachelor of Arts, Economics, University of Oregon, 2011
SUBMITTED TO THE PROGRAM IN SUPPLY CHAIN MANAGEMENT IN PARTIAL FULFILLMENT OF THE REQUIREMENTS FOR THE DEGREE OF
MASTER OF APPLIED SCIENCE IN SUPPLY CHAIN MANAGEMENT AT THE
MASSACHUSETTS INSTITUTE OF TECHNOLOGY
June 2021
© 2021 Jason Y. Pang. All rights reserved.
The authors hereby grant to MIT permission to reproduce and to distribute publicly paper and electronic copies of this capstone document in whole or in part in any medium now known or hereafter created.
Signature of Author: ____________________________________________________________ Jason Y. Pang Department of Supply Chain Management
May 14, 2021 Certified by: ___________________________________________________________________
Alexis H. Bateman Director, MIT Sustainable Supply Chains Lab
Research Scientist MIT Center for Transportation & Logistics Capstone Advisor
Accepted by: _________________________________________________________________ Prof. Yossi Sheffi Director, Center for Transportation and Logistics
Elisha Gray II Professor of Engineering Systems Professor, Civil and Environmental Engineering
2
Dynamics of Supply Chain Sustainability by
Jason Y. Pang
Submitted to the Program in Supply Chain Management on May 14, 2021 in Partial Fulfillment of the
Requirements for the Degree of Master of Applied Science in Supply Chain Management
ABSTRACT
Supply chain sustainability has grown steadily in the last half century. Companies today are setting more ambitious goals and investing greater resources. With this accelerated pace come new questions regarding the transparency of sustainability on an aggregate level. How and why have sustainability practices changed from 2020 to 2021? How has the COVID-19 pandemic impacted sustainability commitments by industry? Are there industry characteristics that can explain the differences in sustainability practices? To address these questions, our analysis used a combination of quantitative survey data and qualitative interviews with sustainability executives.
We used non-parametric Mann Whitney U tests of Likert scale data to quantify the change in supply chain sustainability initiatives. To understand the COVID-19 impact, we visualized summary statistics with Tableau dashboards. Then we ran non-parametric Kruskal-Wallis ANOVA tests to determine if industries differed in their sustainability commitment due to COVID-19. Lastly, we ran unlabeled k-means clustering on the Likert scale data to establish new profiles of companies based on their unique levels of sustainability behaviors.
We determined that supply chain sustainability on an aggregate level has continued to grow in 2021. Businesses doubled down on the issues most impacted by COVID-19: significant growth was seen in employee welfare and safety, human rights protection, and renewable energies. The fear of a sustainability retraction due to COVID-19 was unjustified. Both our executive interviews and empirical research showed that there was either no impact or an acceleration in sustainability promises. Our clustering identified six classes of industries based on their varying levels of sustainability commitment: Leaders, High Effort, Standard, Compliant, Dreamers, and Low Effort. The largest differentiators between the leaders in sustainability and those that lagged were company size and type. These clusters could be used in future research to understand the motivations for a company to adopt high standards in sustainability commitments.
Capstone Advisor: Alexis H. Bateman
3
ACKNOWLEDGMENTS
I would like to thank Dr. Alexis Bateman for being both a phenomenal advisor and an always enthusiastic supporter of this research. It was refreshing to have an open, encouraging dialog throughout this process and I am very grateful for the opportunity. Thank you, MIT Center of Transportation and Logistics team for providing the great resources and support throughout this program.
To my parents Dasheng and Shumin, thank you for the constant encouragement and know that this journey would not have been possible without your support and sacrifice. To my uncle Weidong, thank you laying the foundation for my journey. For my partner, Margo thank you for enduring the restless days in working through this program. It has been a strange and sunny ride these few years and I honestly could not have done this without your positive spirit. Lastly, I would be remiss if I did not mention my dog Schnubby. For staying by my side whether for love or for food, you have helped a lot in your own stubborn way.
Jason Y. Pang
4 TABLE OF CONTENTS List of Figures ... 6 List of Tables ... 7 1. Introduction ... 8 1.1 Motivation ... 8 1.2 Problem Statement ... 9 2. Literature Review ... 11
2.1 Origin and Growth of Supply Chain Sustainability ... 11
2.2 Modern Sustainability Research ... 12
2.3 Supply Chain Sustainability and COVID-19 ... 13
2.4 Literature Summary ... 14
3. Methodology ... 16
3.1 Survey Data Framework ... 16
3.1.1 Data Matching and Headers ... 18
3.1.2 Survey Data Segmentation ... 19
3.1.3 Data Imputation ... 21
3.2 Clustering ... 23
3.3 Content Analysis ... 24
3.4 COVID-19 (Non-Parametric Analysis) ... 25
3.5 Year over year Change (Non-Parametric) ... 26
3.6 Executive Interviews ... 27
4. Results ... 28
4.1 Respondent Summary ... 28
4.2 Year over year changes ... 30
4.2.1 Goals ... 30 4.2.2 Investments ... 31 4.2.3 Pressure ... 32 4.2.4 Disclosure ... 33 4.2.5 Practices ... 34 4.3 Clustering Results ... 34 4.4 COVID – 19 ... 38 4.5 Executive Interviews ... 41 5. Discussion ... 44
Key Inferences from Research ... 44
5 5.1.2 Clustering ... 45 5.1.3 COVID – 19 impact ... 50 5.2 Limitations ... 50 5.2.1 Survey representation... 51 5.2.2 Missing data ... 51 5.2.3 Manual entries ... 51
5.3 Recommendations to Inform Future Work ... 51
5.3.1 Header matching ... 51
5.3.2 Quality Cutoff ... 51
5.3.3 Direct Imputation ... 52
5.3.4 Manual Entries ... 52
5.3.5 COVID-19 ... 52
6. Conclusion and Future Directions for Research ... 53
References ... 55
APPENDIX A – 2021 Survey ... 58
APPENDIX B – Industry / Department Imputation ... 72
APPENDIX C – Executive Interview Questions ... 73
APPENDIX D – Test Results ... 74
Goals ... 74
Investment ... 75
Pressure ... 76
Disclosure ... 77
COVID-19 - Pairwise Analysis ... 77
APPENDIX E – Executive Interview Results ... 80
6
List of Figures
Figure 1: Skip logic flow diagram ... 18
Figure 2: Number of Parent SL Questions and Categorical questions missed. Total number questions missed (categorical + parent SL questions) on the x-axis and the number of responders on the y-axis. ... 20
Figure 3: Elbow Test – Phase 1 Clustering ... 23
Figure 4: Dendrogram – Phase 1 Clustering ... 23
Figure 5: Imputation for Tableau ... 25
Figure 6: ANOVA COVID Table ... 26
Figure 7: Heat map showing number of respondents by HQ location continent ... 28
Figure 8: Number of respondents by – Industry and Department Employed (2020 and 2021) ... 29
Figure 9: Gender and Age ... 29
Figure 10: SCS goal changes ... 30
Figure 11: SCS Investment changes ... 31
Figure 12: SCS pressure changes ... 32
Figure 13: SCS Disclosure changes ... 33
Figure 14: Supply chain practices ... 34
Figure 15: Cluster correlation matrix, colors reflect the different types of clusters identified in the k-means clustering analysis ... 36
Figure 16: Average Cluster score heatmap ... 37
Figure 17: COVID - Pressure and Commitment ... 38
Figure 18: Pressure and Commitment by Continent ... 39
Figure 19: SCS commitment by subject ... 39
Figure 20: Pressure and Commitment, increase vs decrease by industry ... 40
Figure 21: ANOVA Hypothesis Test Summary ... 41
Figure 22: Cluster Analysis ... 46
Figure 23: Cluster by Size and Private ... 49
7
List of Tables
Table 1: Survey Parent Topic ... 17
Table 2: Combining Survey Headers ... 19
Table 3: Parent and Child SL imputation (After Data Segregation) ... 22
Table 4: T-Test by Year ... 26
Table 5: Significant p-value for goals. ... 30
Table 6: Significant p-value for Investments. ... 31
Table 7: Significant p-value for pressures. ... 32
Table 8: Significant p-value for disclosures. ... 33
8
1. Introduction
The concept of supply chain sustainability (SCS) has grown steadily in the last half century, driven in part by a mix of social and political factors stemming from a diversity of impacts on the supply chain. Issues range from excess carbon emissions increasing global warming to child labor practices infringing on human rights. These concerns have begun to educate consumers to the larger environmental and social impact companies have on the planet: “Citizens in almost all countries not only know the issues, but tend to feel that the quality of the environment is important both to their own wellbeing and to the common good” (Adams, 2006, p. 2). Combined, these forces have gradually shifted the social zeitgeist to a more environmentally conscious one.
Some companies have begun embracing the concept of corporate sustainability, an idea of directing business decision by emphasizing social, environmental, and economic concerns (Ashrafi et al., 2018). Supply chains, then, play an integral role in the implementation of these sustainability practices across industries and countries. From Starbucks pledging to make their coffee cups fully recyclable to General Electric (GE) transitioning into more sustainable green energy, each action requires careful supply chain design and collaboration. These decisions demonstrate a growing trend of businesses pivoting towards a more renewable, sustainable future (Purkayastha, 2019). However, in this forward expansion, there still exists a level of uncertainty as to what SCS means for each industry. How can sustainability be measured? What benchmarks are available to track its progress? This idea of SCS helps brings people together to understand what the change is over time, what is happening in the industry, and to what extent they can be a part of that momentum. However, the clarity on what is being done is still hard to track. As more business pivots towards supply chain sustainability, more resources are needed to unmask the complexity of actions and intentions. This capstone provides a map for business leaders to better understand the SCS initiatives on a macro scale.
1.1 Motivation
The first annual State of Supply Chain Sustainability report 2020 published by MIT helped address this concern about sustainable development by providing a glimpse into the opaque world of SCS initiatives. This report offered a new level of transparency on how industries are investing their resources, publishing goals and managing pressures both internal and external to their organization. Through a collection of surveys sent to industry experts and interviews of SCS executives, this report revealed that companies view SCS commitment as a top priority. However, investment levels in those companies do not always correspond to the same level of intent. Companies faced with SCS pressures from a variety of sources often employ higher levels of investment (MIT Center for Transportation &
9
Logistics and Council of Supply Chain Management Professionals, 2020). In essence, the first-year research provided a foundation to begin deciphering the trends, relationships, and behaviors of SCS on a macro scale. The research offered a snapshot not only of sustainability practices, but also of discoveries that may help business professionals in shaping future policy decisions and initiatives. With that in mind, many insights are still left to be discovered regarding the growth of SCS practices year-over-year and the deeper relationship that exists between industries and SCS efforts. In addition, with the onset of the COVID-19 pandemic and its devastation of supply chains across the world, new questions have risen regarding the importance of SCS and the role it will play in the global recovery process.
1.2 Problem Statement
This capstone will address three key questions:
1. How and why have sustainability practices changed from 2020 to 2021?
2. How has the COVID-19 pandemic impacted sustainability commitments by industry? 3. Are there industry characteristics that can explain the differences in sustainability
practices?
To answers these questions, we used both quantitative data from surveys sent to industry professionals and qualitative data of executive interviews with sustainability leaders. Together, we provided details into the SCS initiative changes in 2021, the impact of COVID-19 on future SCS commitments and the behaviors of SCS practices by industries.
Given the impact COVID-19 has had on global supply chains so far, we expect to see many shifts in sustainability strategy when considering the uneven disruption the pandemic has inflicted on differing industries and markets. A McKinsey report on impacted industries noted that: “in a muted recovery, it could take more than five years for the most affected sectors to get back to 2019-level contributions to GDP” (Dua et al., 2020, para. 1). Knowing that some industries will have a tougher road back to recovery, sustainability goals may be put on the backburner in terms of prioritization and resources. Reinforcing this idea, a BSR survey confirmed that roughly 47% of sustainability professionals expected some form of budget cuts in their respective departments (Morris, 2020). Given the diverse nature of the pandemic’s impact on different sectors of the economy, this research will test the hypothesis that industries hit hardest financially by COVID-19 such as travel, dining, shopping and entertainment, may forgo certain sustainability goals by way of budget cuts to maintain solvency. Complementarily, this research assumes that industries that have been positively impacted by sustainability practices during COVID-19, may champion greater sustainable efforts and goals.
10
For example, social distancing requirements during the global shutdown necessitated the use of remote work in many industries that were previously hesitant to conduct business outside of the office. Being forced to embrace this new way of working allowed these companies not only to sustain operations but also to boost employee health and morale. All these indirect response factors could contribute to a growing emphasis on the importance of social sustainability practices.
Data was pulled from two industry surveys designed and collected by MIT Center of Transportation (CTL) during October 2020. Data cleaning and validation was then applied to both the 2021 survey and 2020 survey to match formats for analysis and comparison. The research team explored the survey data and performed an initial review and identified key parameters for analysis. Machine learning algorithms (unsupervised) and statistical analysis was applied on the survey data using a variety of techniques (k -means clustering, T-Test, ANOVA) to map out year to year changes, industry responses in relation to COVID-19 and other contributing factors related to sustainability practices. The research team then consolidated the analytical findings, conducted content analysis, and then revealed the underlying relationships, trends and behaviors captured in the data. In addition, executive interviews were conducted towards the end of the research schedule to compare and contrast our analysis with real world findings from sustainability leaders.
Given the unprecedented time where COVID-19 has disrupted much of the global economy, a shadow of uncertainty has been cast over the growing trajectory of supply chain sustainably commitments. While similar research initiatives have polled sustainability experts on their opinions of COVID-19’s impact (Dua et al., 2020; Morris, 2020), they did not provide a comprehensive large-scale analysis that aggregated expert opinions year-over-year, across multiple functions, industries and regions. This capstone revealed that although COVID-19 has negatively impacted business on a financial scale, the effect on supply chain sustainability has been positive. The findings from both our analysis of year-over-year changes and interviews with executives have shown that supply chain sustainability commitments and initiatives have in fact been accelerated.
11
2. Literature Review
At the intersection between the historic rise of SCS efforts and the uncertain constraints of the COVID-19 pandemic, there exists a new set of questions regarding the future SCS and its impact on industries across the world. To answer these questions, this chapter presents the most relevant research on the overarching field of SCS. It reviews studies on the background and growth of SCS as a field, the aggregated research of modern-day SCS practices, and the impact of COVID-19 on the future direction of SCS movements.
2.1 Origin and Growth of Supply Chain Sustainability
As the world economy grew in the 20th century, many corporations made investments and strategic decisions in pursuit of profit that jeopardized the wellness of the climate and society. One result of these actions was a greater public need for accountability and sustainable decision making (Rajeev et al., 2017). This concept of sustainability is described by the 1987 Brundtland Report as: “development that meets the needs of the present without compromising the ability of future generations to meet their own needs.” (Adams, 2006, pp. 1-2).
In recognizing the sizable impact supply chains have for many businesses, applying the idea of sustainability to a business model required a more refined moniker. Businesses today often focus on the concept of corporate sustainability and more importantly supply chain sustainability. The origin of corporate sustainability has been covered by a multitude of researchers and academics. Many credit “The Triple Bottom Line” by Elkington (1998) as one of the first fundamental frameworks for how companies should approach sustainable practices. In contrast to the traditional bottom-line approach of focusing on profit, Elkington argued that companies need to also incorporate social and environmental concerns to address the growing political and public needs of the modern world. This concept of emphasizing “Profit”, “People” and the “Planet” would eventually be coined as the three pillars of corporate sustainability (Allegue Lara & Barrington, 2020; Carter & Easton, 2011; Elkington, 1998; Purkayastha, 2019; Rajeev et al., 2017). As a result of this framework, the execution of these pillars then led to development of “supply chain sustainability” (SCS) also called sustainable supply chain management (SSCM). This is defined as: “the management of supply chain operations, resources, information, and funds in order to maximize the supply chain profitability while at the same time minimizing the environmental impacts and maximizing the social well-being.” (Hassini et al., 2012). Correspondingly, research of oil and gas companies has shown that negative forces such as external pressures had a direct impact on a company’s commitments to sustainable initiatives (Bansal, 2005). In the same vein, another study of global organizations revealed that sustainability
12
programs can also be motivated by positive forces such as better publicity and legitimacy (Wolf, 2014). Other motivating factors for adopting sustainable initiatives, as seen by Ameer and Othman (2012) revealed companies with superior sustainability practices also tended to have higher sales growth and better return on investment, demonstrating that there may be more economic advantages to incorporating sustainability than previously known.
With the motivation of a more sustainable future and a framework for corporate adoption of SCS practices, many researchers focused on quantifying and measuring the growth of sustainable activities. Carter and Easton (2011) analyzed 20 years (1990-2010) of sustainable supply chain literature showcasing that sustainability reviews evolved from an investigative nature to a more practical application of the “Triple Bottom Line”. Rajeev et al. (2017) contributed to this analysis by analyzing 1000+ sustainability journal articles from 2000-2015, spotting a surge in published works in 2011 corresponding with the growing maturity of corporate sustainability practices.
These papers have shown that corporate sustainability and by extension SCS was created to address the social and political pressures for a more balanced way of doing business. Though adoption and execution of sustainability initiatives, companies then began to realize new benefits in terms of social good will and supply chain resilience. As more companies commit to sustainability practices (Carter & Easton, 2011) more complexity is added in understanding the global state of sustainability. Which industries are leaders in SCS practices, which are lagging? Answering these questions could help business leaders better develop their sustainably practices for the future.
2.2 Modern Sustainability Research
Few studies aggregate modern-day status of supply chain sustainability efforts across industries and countries. To address this lack of research, (MIT Center for Transportation & Logistics and Council of Supply Chain Management Professionals, 2020) surveyed 1000+ industry professionals and interviewed corporate executives to better understand the state of global sustainability efforts in 2019. Their findings indicated that internal and external pressures correlated with higher levels of SCS investments, confirming previous research by (Bansal, 2005). In addition, they revealed investment levels do not always correspond with the same level of reported intent. This capstone incorporates the data used by Allegue Lara & Barrington (2020) and provides additional analysis into the sustainability relationships first captured in their research.
Other studies have summarize the main themes and trends of sustainability commitments with a focus on Fortune 500 (F-500) companies. Wu et al. (2012) investigated business reports of F-500 companies published in 2009 to better understand the overall SCS practices of the most influential
13
corporations. They determined that although 66% of companies reported on SCS initiatives, there was a noticeable lack of depth in terms of actual applications. A complementary analysis of 2013 F-500 company reports on sustainability themes confirmed that that the concepts of the “Triple Bottom Line” was still a central focus of most top companies, reinforcing the strong adoption of Elkington framework in guiding modern SCS priactices (Amini et al., 2018). Some studies have summarized sustainability efforts limited to certain businesses. Research on the food, textile and wood-products industries revealed that roughly half of these companies conducted at least one sustainable sourcing practice (Thorlakson et al., 2018).
Outside of journal resources, the report “Green Bonds Global State of the Market 2019” from Almeida (2020) could be examined as a proxy for corporate sustainability investments and growth. This report detailed global investments of green energy bonds segmented by countries and industries. This review revealed an annual bonds issuance growth of 51% from 2018 to 2019, reinforcing previous research by Carter and Easton (2011) on the exponential the growth of sustainability interest and initiatives. These green bonds offer companies the opportunity to invest in new sustainability projects that they may otherwise be unable to achieve due to capital budgetary concerns. For example, in 2016 Starbucks issued 500-million-dollar bonds targeted at enhancing their supply chain sustainability programs focused on ethical sourcing and verifications. Overall, there is still very little research that directly addresses the current trends and statuses of SCS sustainability efforts.
2.3 Supply Chain Sustainability and COVID-19
Given the recent COVID-19 pandemic and its disruptions across varying industries and countries, new studies are focused on better understanding how sustainability efforts are affected and what that could mean for the underlying supply chains powering these changes.
In 2015 the UN established the sustainable development goals (SDG) which was a call to action for governments, companies and organizations around the world to come together and tackle 17 sustainability issues by 2030. A key factor in meeting these challenges was through leveraging supply chains across the world: “As the SDGs form the global agenda for the development of our societies, they will allow leading companies to demonstrate how their business helps to advance sustainable development, both by minimizing negative impacts and maximizing positive impacts on people and the planet” (The Guide for Business Action on the SDGs, n.d.). However, the 2020 UN update on SGD (United Nations Department of Economic and Social Affairs, 2020) revealed that COVID-19 has negatively impacted some of the 17 Sustainable Development Goals (SGD) targeted
14
for 2030. Given that supply chains play a vital role in the success of these programs, the impact on SGD’s could be potential signs of a drawback on SCS initiatives and commitments.
In relation to the uneven impact of COVID-19 on markets across the world, Amankwah-Amoah (2020) researched the airline industry and revealed that carriers were more likely to adjust their sustainability initiatives due to the economic setback. However, they also noted that the pandemic disruptions are likely a temporary issue and there needs to be government support for airlines to not de-invest in sustainability commitments. Similar research regarding the textile industry in SE Asia showed that the devastating impact of COVID-19 could have been lessened had companies focused on better sustainability practices including ethical sub-contracting and better sourcing models, emphasizing the need of transparency and supplier code of conducts (Majumdar et al., 2020). Aside from industry-specific research, there still exists great uncertainty on how most industries will respond to the uneven impact of COVID-19. Jia and Li (2020) provided some answers to this dilemma as their study determined that global uncertainty in terms of climate change, economic policy and political instability negatively affected a firm’s sustainability commitments, potentially shedding light on how many industries may pull back on prior green commitments.
Outside of journal research, there were supplemental reports that provided some clues into the direction of sustainable investments post COVID-19. A survey by Malmqvist et al. (2020) of 700+ sustainability experts in 71 countries revealed that industry experts expected a decrease in sustainability efforts as economic concerns would likely take primacy. The 2020 mid-year summary of Green bonds Investments revealed a drop of 26% in bond insurances as compared to 2019, indicating the likely retraction of sustainable funding as a consequence of the pandemic (Tukiainen, 2020). All sources considered, there are indications of a decline in global sustainability efforts when faced with the COVID-19 pandemic. The question then becomes how will these signals impact the supply chains that are powering these green initiatives from the ground up? Will there be slack given to previous sustainability commitments such as the SDG’s now that there are uncertainties on how businesses will thrive? Conversely, given the benefits of resilient sustainably supply chains in combating the negative effects of the pandemic, there could also exists a growing need for greater adoption of greener solutions.
2.4 Literature Summary
The concept of SCS sustainability is broad and varied. There is some research that this review did not include. We did not examine the varying issue areas under the supply chain sustainability umbrella such as climate change mitigation or human rights protection. We instead focused on the
15
topic of SCS as a whole. This review centered on the aggregate growth of SCS sustainability and its adoption by industries, modern day research and COVID-19 disruptions. The COVID-19 pandemic is still ongoing as of this writing; therefore, new research regarding this subject will likely be released in the coming months and years.
Overall, the growth of corporate sustainability is undeniable, both in its necessity and application to the modern world. Research has shown that external pressures have pushed companies to reassess their business strategy and consider factors outside of profit. In changing business structures and focusing on greener solutions, studies have revealed additional benefits such as boosting brand reputation and developing resistance against disruptions. However, very few studies addressed SCS sustainability efforts on a macro scale. In addition, with the onset of COVID-19 and its potential to undo sustainability investments, there is now a greater need for clarity on how companies are responding. This research will help fill in this gap and provide transparency at this crucial turning point, offering answers as to why and how companies are shifting their sustainable strategy.
16
3. Methodology
This section details the background and makeup of the two-year survey data set centered on industry professionals and describes the steps taken to transcribe these responses into an analytical framework for analysis of the capstone. This analytical framework answers a three-part question; are there groupings that can explain differences in SCS practices, how have SCS practices changed from 2020 to 2021 and what is the impact of COVID-19 on future SCS commitments. This section will include the following: First, we will describe the background and state of our survey data. Then an overview of data cleaning and segmentation processes. Next the imputation techniques for managing missing data. Then an introduction to clustering and ANOVA analysis and finally an overview of executive interviews with top supply chain sustainability leaders.
3.1 Survey Data Framework
In 2019, the MIT Center of Transportation and Logistics (MIT CTL) initiated an annual research project with the intent to detail the growth of SCS efforts across multiple functions, industries, and countries. The source of the report would be centered on a set of yearly anonymous surveys sent out industry professionals asking them to describe their firms’ level of engagement on a variety of key SCS topics and issues. These questions addressed a wide range of SCS subjects with a primary focus on goals and commitments, investments, pressure sources and disclosure practices. In addition, there were supplemental questions that asked characteristic details that could later be used to analyze the makeup of the respondents. Table 1 summarizes the survey by question type, (see APPENDIX A – 2021 Survey) for the 2021 survey questions.
17
Table 1: Survey Parent Topic
2020 Survey 2021 Survey
1. Level of commitment in sustainability (Likert)
2. Level of investment in sustainability (Likert)
3. Level of pressure and pressure sources for sustainability (Likert)
4. Level disclosure frequency & disclosure type for sustainability (Likert)
5. Types of practices in place for sustainability (Categorical) 6. Type of company (Categorical) 7. Respondent characteristics
(Categorical)
1. Level of commitment in sustainability (Likert)
2. Level of investment in sustainability (Likert)
3. Level of pressure and pressure sources for sustainability (Likert)
4. Level disclosure frequency & disclosure type for sustainability (Likert)
5. Types of practices in place for sustainability (Categorical)
6. Level of commitment change due to COVID-19 (Likert)
7. Direction of pressure change due to COVID-19 (Likert)
8. Type of company (Categorical) 9. Respondent characteristics
(Categorical)
Both surveys used Qualtrics as the platform for data collection and as part of the survey design, included the option to implement skip logic (SL) questions in the survey design. SL questions automatically skips the survey path to a different question depending on how the initial parent SL question was answered (see Figure 1). This process eliminates redundancies and helps retain quality response as individuals are not forced to re-enter previously known information.
18
Figure 1: Skip logic flow diagram
The choice of which questions to include was determined after careful considerations of the current academic research on supply chain sustainability, inputs from the leading supply chain professionals at MIT CTL and externally and the growing publications of corporate sustainability reports. These questions were then tested and validated by supply chain professionals to gauge both the effectiveness and usefulness for the real-world setting. In drafting the 2021 survey, modifications in the form of question format and arrangement were made based on the advice of Allegue Lara and Barrington (2020) research, team experience, and feedback from external partners. Both the 2020 and 2021 survey were launched from of October to November of the previous year. They were advertised though multiple media outlets with a primary focus on LinkedIn outreach.
3.1.1 Data Matching and Headers
Given that the 2021 survey is a direct evolution of the 2020 survey, there are similarities and differences that needed to be identified to properly assess both year’s results. We first extracted and analyzed the 2020 survey and detailed the changes against the 2021 survey. The layouts of both are similar and include questions evaluated using a Likert scale (1-5 with greater intensity) and questions that are categorical in nature. Through comparison of the survey format, we noted questions that were
19
modified, added, and removed. For the answer choices, noted slight wording modifications in the 2020 survey. (see Table 1).
Questions in the 2020 survey that had similar intent to those in the 2021 survey were converted using the average of the Likert responses (see Table 2). Questions that were not available in both survey years, such as the addition of the COVID-19, would not be used in the comparison and were reserved for topic-specific analysis.
Table 2: Combining Survey Headers
Question 2020 (Combined /AVG) 2021 Q5_2_1
Q5_2_2
o Air pollution mitigation
o Natural resources and biodiversity conservation
o Natural resource and biodiversity conservation
Q5_1 o Carbon emissions reduction o Climate change mitigation o
Q5_3 o Energy management o Energy savings/renewable energy Q5_4 o Water management o Water conservation
Q5_5 o Waste and end of life management
o End of life management/Supply chain circularity
Q5_6 o Worker welfare & employment quality
o Employee welfare & safety Q5_7_1
Q5_7_2
o No forced or slave labor o No child labor
o Human rights protection Q5_8 o Impact on local Communities o Local community impact
Q5_9 o Supplier diversity & inclusion o Supplier diversity, equity & inclusion Q5_10 o Fair trade/fair pay o Fair pay/fair trade
Q5_other o Other o Other
The 2020 survey asked respondents to provide their HQ location by country; whereas the 2021 survey changed to continent. Imputation was applied to the 2020 data to convert country to continent. The 2021 survey allowed individuals to select multiple HQ locations. for comparative analysis a single HQ location was decided based on survey size by country i.e. preference of NA>Europe>Asia.
3.1.2 Survey Data Segmentation
In analyzing the makeup of the answers for both survey years, we noted significant batches of missing data due to non-complete responses. The SL format allowed each survey respondent to select “yes”, “no”, “not sure” or “skip”, with only the “yes” response leading to the follow-up child questions. The other responses would directly bypass the child question providing multiple combination of choices and adding additional complexity to our analysis.
20
To address this concern, we first analyzed the structure of our survey data and quantified the type of groupings by evaluating the number of answers to the parent SL questions. For respondents that selected “yes” or “no” to our parent SL question, we definitively know their stance on that issue. For respondents that selected “not sure” or “skip”, it becomes much harder to understand which direction they stand. In terms of usefulness, both answers choices were considered missing data for our research.
Figure 2 summarizes the results of our quality analysis for both survey years. This graph shows that the total number questions missed (categorical + parent SL questions) on the x-axis and the number of responders on the y-axis. The color provides the ratio of the misses based on selecting “not sure” and “skip”. Most responders are grouped on both ends of the x-axis. The left represents more questions answered and right more questions missed. In an ideal environment, we would keep all the responses including the right cluster and run analysis on traits or groupings to better understand this population. However, since most of the “skip” responders also chose to not answer any of the categorical questions, we have no way gathering or grouping any additional details if they did not provide them themselves.
Figure 2: Number of Parent SL Questions and Categorical questions missed. Total number questions missed (categorical + parent SL questions) on the x-axis and the number of responders on the y-axis.
21
The distribution of questions missed is similar in both surveys, reinforcing the idea that this behavior is unlikely due outside issues. The number of responders is skewed towards either ends of x- axis and as we head towards the center, we see there are very few responders indicating that the number of questions missed is not uniform. With the examination of the miss type “not sure” and “skip”, we noted a linear relationship: as more questions were missed, the higher the likelihood the responder would select “skip”. Given the stark contract in these results, we chose to segment our data based on a quality cutoff point. This slice was decided based on the turning point where the ratio of the questions missed favored “not sure” vs. “skipped”. The 2020 high quality cutoff had a total question missed of five or fewer and the 2021 seven or fewer.
3.1.3 Data Imputation
Although the cutoff of survey responses contained more earnest responders, missing data was still present in a small batch of the responses. Not all responders definitively answered all the parent SL questions and missing data was present by way of selecting “skip”, “not sure” or “no” to the parent SL questions. Depending on the type of analysis, some algorithms will require no missing data present. As a result, data imputation was used when necessary for analysis and categorized in the following classes based on certainty:
22
• Class 1: For parent SL Questions who answered “yes” then left blanks in the child SL we can reasonably conclude they intended to select “no” to the missing topics. Likert scale choice of (1)
• Class 2: For parent SL Questions with a definitive answer “no”, we directly imputed their corresponding child SL answers to “no” which corresponds to the lowest available Likert scale choice of (1). The generally skewed a large portion of our response.
• Class 3: For parent SL Questions who answered, “not sure” or “skip”, it is much harder to input the missing data as we cannot know which direction they were intended.
For the Class 3 questions where we have no indication of preference, we examined alternative imputation techniques. Kang (2013) reviewed the common types of missing data and discussed some of the various techniques available for combating this issue in research analysis. He concluded listwise deletion, meaning the removal of all missing data, is the most common approach. There are however complications with this method if the sample size is too small. Jadhav et al., (2019) analyzed performances of multiple imputation techniques and concluded that K-Nearest-Neighbors (KNN) imputation generally outperformed mean, median and linear regression for addressing missing information. For clustering we initially used both listwise deletion and KNN for our Class 3 question. Once we examined the similarity in results, we decided to use the conservative approach of listwise deletion given our sample size was adequate for the research. Table 3 details the adjusted imputations made depending on how individuals answered the parent SL questions and the type of analysis used.
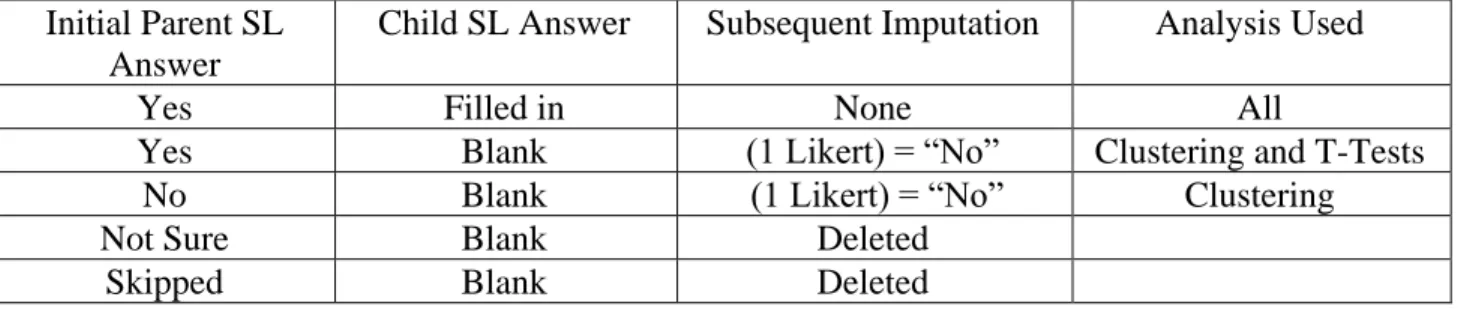
Table 3: Parent and Child SL imputation (After Data Segregation)
Initial Parent SL Answer
Child SL Answer Subsequent Imputation Analysis Used
Yes Filled in None All
Yes Blank (1 Likert) = “No” Clustering and T-Tests
No Blank (1 Likert) = “No” Clustering
Not Sure Blank Deleted
Skipped Blank Deleted
Both surveys asked respondents to select their industry and department employed, in some instances responders chose to manually input their responses rather than select a pre-defined category. For analysis we examined the manual entries and imputed a category that fit the description (see APPENDIX B – Industry / Department Imputation)
23
3.2 Clustering
In evaluating the cleaned dataset, we noted that four major parent skip-logic question groups comprised the bulk of the useful sustainability information (present in both 2020 and 2021 survey). These skip-logic questions asked respondents to gauge sustainability initiatives in terms of Goals, Investment, Pressure and Disclosures. If the responded selected yes, then they would be given a range of Likert scale child questions asking for specific topic issues. Therefore, as a first step we ran an unlabeled clustering algorithm on these answer choices to determine whether there were underlying patterns and groupings of our respondents without looking at the categorical labels.
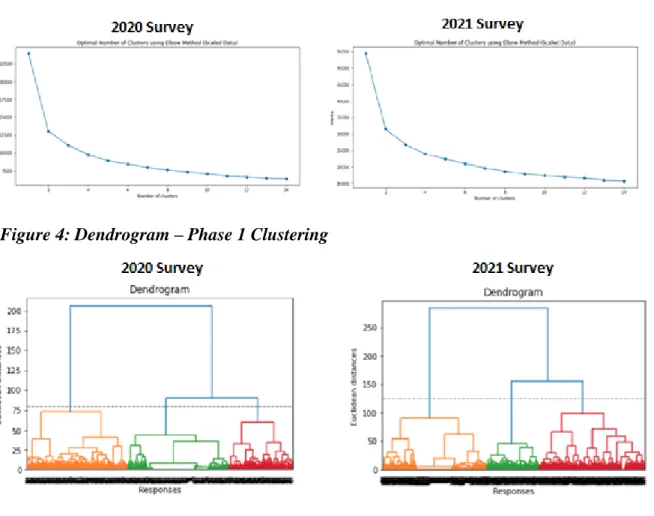
To determine the correct number of clusters / groupings, Bholowalia and Kumar (2014) noted the common use of the elbow method, a heuristic that calculates the sum of squared error as a function of the number of clusters, providing a visual diagram to determine an appropriate cutoff point for cluster size. This visualization is shown in Figure 3 for the 2020 and 2021 dataset. In addition, a hierarchical clustering analysis, shown in Figure 4, in the form of the dendrogram, can also be used to visually determine the cluster size (Schonlau, 2002).
Figure 3: Elbow Test – Phase 1 Clustering
24
Given the experimental nature of unlabeled clustering, we ran multiple scenarios using different sizes of clusters and imputation methods to determine an optimal solution to our research. The summary below provides the outline of types of scenarios run:
1) Phase 1: KNN imputation for missing parameters, k-Means clustering (k =3 and 4) each dataset separately.
2) Phase 2: KNN imputation for missing parameters, trained k-Means (k =5) on 2021 survey data and predicted cluster class of 2020 data.
3) Phase 3 – Listwise deletion of missing parameters, k-Means (k =6) clustering on the combined 2020 and 2021 survey data.
In phase 1, a k-Means (k = 3) clustering was conducted on the child SL answers using the Likert scaled data on both the 2020 and 2021 surveys separately. After evaluation and analysis, we then re-ran clustering with a (k = 4) on the data set excluding the outlier cluster identified in phase 1. In phase 2 we trained k-means clustering with a (k = 5) on the 2021 dataset (excluding the phase 1 outlier class) and then predicted cluster class for the 2020 dataset (excluding phase 1 outlier class). Lastly in Phase 3 we used listwise deletion, removing the missing data and only clustering on valid responses provided by the respondents, although the sample size for phase 3 was smaller, the results were very similar with the Phase 2 approach. Given the similarity in results, we decided to proceed with the conservative approach, given the similarity in outcomes.
3.3 Content Analysis
To understand the current state of supply chain sustainability and help quantify what has changed from last year, we conducted a broad scale content analysis and summary of the survey result using Tableau visualizations. This approach allowed us to use datasets with missing parameters. We generated the dashboards using the high-quality data cutoff without the need for listwise deletion. We experimented with keeping Class 1 and Class 2 imputations in our visualizations. Given the skewed nature of our Class 2 results and a desire to match last year’s sustainability report we ultimately settled on hybrid approach (see Figure 5). The dashboard kept the Class 1 imputation which imputed the blank parameters of child responses to “No” if the parent response was initially yes and left the remaining answers blank matching last year’s visualizations.
25
Figure 5: Imputation for Tableau
Initial Parent SL Answer
Child SL Answer Subsequent Imputation
Yes Filled in None
Yes Blank (1 Likert) = “No”
No Blank Blank
Not Sure Blank Blank
Skipped Blank Blank
With the cleaned dataset we summarized the respondents by their categorical entries (HQ location, industry, private vs public, department employed, company size, age and gender) and contrasted the difference by survey year. An interactive dashboard was developed for each of the major SCS question topics (Goals, Investments, Disclosures and Pressures, Practices) and aggregated the average user response for each of the child SCS topics for both survey years highlighting growths or declines. For each dashboard, interactive filters were also implemented to allow user to change characteristic parameters and add granularity to research.
3.4 COVID-19 (Non-Parametric Analysis)
In the 2021 survey, a new group of COVID-19 related questions were added, including a section asking respondents whether their firm’s commitments to supply chain sustainably has changed due to pandemic. Given that our hypothesis proposed that some industries will back down from sustainability commitments, we chose to test this with an analysis of variance (ANOVA) like model. we chose to test this with an analysis of variance (ANOVA) like model.
In evaluating the use of Likert scale data with parametric analysis Norman (2010) confirmed that although ordinal, Likert scales can be used with regression and analysis of variance (ANOVA) without concern. Mircioiu and Atkinson (2017) evaluated the use of parametric and non-parametric analysis with Likert data and found that both approaches led to similar results. Given that both approaches are feasible, we decided to test our hypothesis with the more conservative non-parametric approach that better suited the limited scale of some of our data.
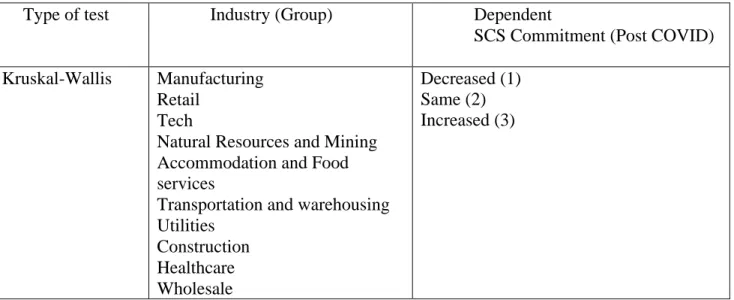
With the industry groups set as the independent variable, we used Kruskal-Wallis test (one-way ANOVA on ranks) to identify whether there are significant differences among these industry groups when compared to their COVID-19 commitment changes (see Figure 6).
26
Figure 6: ANOVA COVID Table
Type of test Industry (Group) Dependent
SCS Commitment (Post COVID) Kruskal-Wallis Manufacturing
Retail Tech
Natural Resources and Mining Accommodation and Food services
Transportation and warehousing Utilities Construction Healthcare Wholesale Decreased (1) Same (2) Increased (3)
3.5 Year over year Change (Non-Parametric)
To quantify the changes of sustainability initiatives from 2020 to 2021 we wanted to look beyond summary statistics of both year’s survey data. For example, if the average Likert response of Climate goals shifted by a .2 value, is this a significant change or explainable by the random variability of the data? To determine whether the Likert response changes were statistically significant, we ran multiple non-parametric independent samples T-Test called the Man-Whitney U-Test. Similar to the comparison of parametric and non-parametric usage of ANOVA, De Winter and Dodou (2010) concluded that T-Tests and the Man-Whitney resulted in similar outputs and power. As a result, we decided to use the more conservative option of the non-parametric analysis better fitting with the Likert data. These tests used the two years of data (2020 and 2021) as the groups and measure their differences on surveyed categories of (Goals, Disclosures, Pressure, and Investments) and quantifies of the differences are statistically significant (see Table 4)
Table 4: T-Test by Year
Mann-Whitney U Test (independent t Test) 2020 to 2021 topics for comparison
Disclosure Practices Goals Investments Pressures
Website Climate change
mitigation
Climate change mitigation
End consumers Press releases Energy
savings/renewable energy Energy savings/renewable energy Corporate buyers
27
Reporting organization
Water conservation Water conservation Investors Company Sustainability/CSR report End of life management/supply chain circularity End of life management/supply chain circularity Current and prospective employees Third-party case study
Natural resource & biodiversity
conservation
Natural resource & biodiversity
conservation
Company executives
Other Employee welfare & safety
Employee welfare & safety
NGOs and other third parties Human rights protection Human rights protection Industry associations Local community impact Local community impact Governments & international governing bodies Supplier diversity, equity & inclusion
Supplier diversity, equity & inclusion
Mass media
Fair pay/fair trade Fair pay/fair trade Local communities 3.6 Executive Interviews
Interviews with SCS executives took place in early 2021. The purpose was to both verify our analysis and gain insights into the future of SCS from an executive vantage point. Initially the interviews were planned to be conducted live on Zoom however this format was later changed to a hybrid model where most executives would be sent a survey with only a few sessions taking place live. The questions were determined based on a mix of last year’s executive question bank and new findings and trends identified in our analysis. These structured interviews were carefully selected based on industries, locations, impact and many other considerations to represent a well-rounded sample of global supply chain sustainability leaders. APPENDIX C – Executive Interview Questions details the list of questions asked.
28
4. Results
This chapter presents the results of our analysis. First, we will summarize the respondent details and the results of the changes in sustainability initiatives from 2020 to 2021. Second, we will detail the results of our k-Means clustering and the unique business profiles identified in our unlabeled analysis. Then we will cover the sustainability commitments from COVID-19 and the impact on industries across multiple sectors. Lastly, we will summarize the results of our executive interviews and how they line up with our research findings.
4.1 Respondent Summary
An interactive dashboard was created using Tableau to visualize the survey statistics for both the 2020 and 2021 survey year. This display allowed our stakeholders and sponsors to easily understand key finding from of our sustainability survey. In the combined dataset, responses from all continents were captured. Figure 7 provides a continent heatmap of the respondents. In both survey year results, we had heavy representation in North America, Europe, and Asia.
Figure 7: Heat map showing number of respondents by HQ location continent
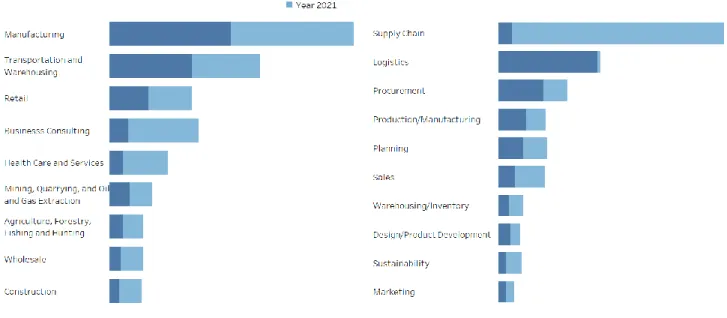
Over 17 industry types were captured in the combined data set. The highest representation is seen in Manufacturing, Transportation and Retail. Over 19 business departments were recorded with the highest representation seen in Supply Chain, Logistics and Procurement. Figure 8 diagrams the number of respondents for the top 10 industries and departments employed for both the 2020 and 2021 year. “Technology” and “Supply Chain” were not selectable options in the 2020
29
survey. Any representation of these two topics in 2020 was created manually. Direct comparison of changes for both topics may not be meaningful.
Figure 8: Number of respondents by – Industry and Department Employed (2020 and 2021)
As shown in Figure 9, roughly 74.3% of 2020 survey respondents were male, a minimal decrease from the 2020 survey sample. Most of the respondents for both survey years were in the 25-34 age bracket, with a noticeable bump in younger audiences of 18-24 when compared to the 2020 dataset. New industry and department options were included in the 2021 survey.
30
4.2 Year over year changes
Multiple non-parametric T-tests were conducted to evaluate the significance of the two-year changes in supply chain sustainability. These tests focused on the subcategories the 4 broad domains of SCS goals, investments, pressures, and disclosure practices. The statistical results of these tests are shown in APPENDIX D – Test Results.
4.2.1 Goals
On the surface, the average scores of supply chain sustainability goals were generally higher in 2021 than 2020 (Figure 10). The largest increases are seen in employee welfare and safety 9.7%, energy savings/renewable energy 7.17% and natural resources and biodiversity conservation 9.84%. In contrast, SCS goals dropped in 2020 in the field of end-of-life management/supply chain circularity -5.3%, and climate change mitigation -3.0%. The remaining subject areas had marginal increases.
Figure 10: SCS goal changes
The results of our non-parametric T-test revealed the following goal changes were statistically significant with a p-value < .05 (see Table 5).
Table 5: Significant p-value for goals.
Significant SCS Goals changes Significance value - (reject null)
Energy savings/renewable energy .001
31
Natural Resources & Biodiversity Conservation .028
Employee welfare and safety .000
The changes in SCS goals for the remaining subject areas were not statistically significant enough to be considered drastically different.
4.2.2 Investments
The average scores of supply chain sustainability investments were also higher in 2021 than 2020 (Figure 11). The largest increases are seen in human rights protection 10.46%, supplier diversity, equity and inclusion 9.73%, employee welfare and safety 7.22% and energy savings/renewable energy 6.47%. In contrast the largest drop is seen in climate change mitigation -5.78%.
Figure 11: SCS Investment changes
The results of our non-parametric T-test revealed the following investments changes were statistically significant with a p-value < .05 (see Table 6).
Table 6: Significant p-value for Investments.
SCS Investment Significance (reject null)
Energy savings/renewable energy .008
32
Climate change mitigation .026
Employee welfare and safety .004
Supplier diversity, equity & inclusion .001
The changes in SCS investments for the remaining subject areas are not statistically significant enough to be considered drastically different
4.2.3 Pressure
The average scores of supply chain sustainability pressures were also higher in 2021 than 2020. The largest increases in pressure are from government and international governing bodies 7.85% .and investors 7.62% (Figure 12).
Figure 12: SCS pressure changes
The results of our non-parametric T-test revealed the following pressure changes were statistically significant with a p-value < .05 (see Table 7).
Table 7: Significant p-value for pressures.
SCS Goals Significance (reject null)
Investors .038
33
Although most pressure sources are higher in 2021, the most significant jumps are in the areas of Investors and Government Bodies.
4.2.4 Disclosure
The average scores of supply chain sustainability disclosure practices were mixed in 2021 when compared to 2020. There were marginal increases and decreases for most practices. The most notable drop was in Third-Party case studies of -17.64% (Figure 13).
Figure 13: SCS Disclosure changes
The results of our non-parametric T-test revealed the following disclosures changes were statistically significant with a p-value < .05 (see Table 8).
Table 8: Significant p-value for disclosures.
SCS Goals Significance (reject null)
Third-party case study * .001
The wording “Third-party case study” was changed from “Case study” in the 2021 survey. Given this change, direct comparison of responses regarding this question may not be as significant given the potential bias for error.
34
4.2.5 Practices
The implementation of supply chain sustainability practices increased by 2.6% in 2021. The percent of individuals who said no practices were in place dropped by 3.58%. The largest practice increase was seen in visibility and traceability which jumped by 3% while supplier audits dropped by -4.2% (see Figure 14). The increase in sustainably practices in 2021 was small but positive. Certain decreases such as supplier audits makes sense given the context of COVID-19 the impact on business operations. In our executive interview with Intel, they confirmed that their supplier audits for 2020 failed to meet annual targets given the factory shutdowns in China. Overall, this positive result confirms the growth of supply chain practices globally and indicates a positive trend for more business adoption.
Figure 14: Supply chain practices
4.3 Clustering Results
In running unlabeled clustering analysis of our SL Child responses with a Likert scale data, we experimented with multiple type of cluster sizes (k) given that this value must first be determined
35
by the user. We ultimately settled on a k -means clustering of k = 6 using Listwise deletion of the rows with missing data parameters.
Our clustering results revealed 6 unique classes of sustainability behaviors based on their responses to the 4 major questions of goals, investments, pressures, and disclosure practices. Figure 15 presents a correlation matrix of the average Likert scale response for the 4 main parent SL questions. The embedded colors reflect the different types of clusters identified in the k-means clustering analysis (excludes low effort class for visualization as this group predominantly selected “no” to most subject). This chart confirms research previously conducted by Allegue Lara and Barrington (2020) which identified the positive correlation of sustainability goals and the amount of investment. Through evaluation of the clustered groupings, our analysis revealed that there are distinctive groups that can be determined through the evaluation of survey responses on certain key sustainability subjects. Each of the cluster groups has a distinct pattern in sustainability choices with a varying scale of sustainability goals investments, pressure, and disclosures choices. In evaluating the patterns of these responses, we have given the clusters unique monikers based on their level of effort reported on the surveyed subjects. Figure 16 presents summary statistics of the average responses of the key sustainability categories grouped by their cluster names.
36
Figure 15: Cluster correlation matrix, colors reflect the different types of clusters identified in the k-means clustering analysis
37
Figure 16: Average Cluster score heatmap
A definition and characteristics of these industries are highlighted below.
• Leader: High levels of sustainability effort across 4 categories. Represents industries that are sustainability leaders with high levels of goals, pressures commitments and disclosure practices.
• High Effort: High levels of goals and investments however has very low pressure. Unique group that is making investments and commitments without the pressure to motivate these industries.
• Standard: Average levels of sustainability effort in all 4 categories of sustainability involvement.
• Compliant: Low levels of sustainability goals, moderate levels of investment and pressures. Represents industries that are meeting the legal sustainability pressures and needs however not proactively setting goals.
• Dreamer: Moderate level of goals however has fails to follow through with low level of investment.
38
• Low Effort: Low levels of sustainability across all 4 categories, most responses in this group selected “no” for the parent SL parent questions.
With these sustainability initiatives identified we then investigated the characteristic traits of these clustered classes to better understand what type of industries these groups are made from.
4.4 COVID – 19
In the 2021 survey, close to 80% of the responders indicated that their firm’s SCS commitments and pressures either stayed the same or increased because of COVID-19. Only 9.4% stated that their firms’ commitments decreased and 6% for pressure (Figure 17).
Figure 17: COVID - Pressure and Commitment
In examining the COVID-impact on a continent level, Asia and the Mediterranean faced the highest levels of post SCS pressure at 40%. North America, EU and Latin America had the highest percentage of no impact on SCS pressures at 51% to 57%. In terms of SCS commitments post COVID, Asia and Africa had the highest proportion of increases at roughly 41% (Figure 18).
39
Figure 18: Pressure and Commitment by Continent
In examining which SCS area had the largest commitment increase, our analyses revealed that employee welfare was the number one priority. Roughly 34% indicated renewed commitment in supporting employee welfare and safety post COVID-19 (Figure 19).
40
From an industry perspective we noted Agriculture, Forestry, Fishing and Hunting saw the largest decrease in SCS pressure at -16%. Wholesale had the largest proportional increase at 44.9%. In terms of commitments, Construction had the largest bump at 53% whereas the decreases were similar spread among all the other industries. Overall, these figures were not too different from the aggregated summary and the distinction among the industries were not readily apparent. Therefore, to test whether industries SCS commitments were significantly different due to COVID-19, we needed to run an ANOVA like analysis on these results. Figure displays the percentage of increase vs decreases (See Figure 20).
41
The non-parametric ANOVA analysis evaluated whether there were significant differences among the reported industry groups when compared to the level of supply chain sustainability commitments post COVID-19. The NULL hypothesis assumes the distribution of scores are similar across industries. The results revealed a significant P value of .045 rejecting the null hypothesis and implying that, given our dataset, industries did differ in their commitment response post COVID-19 (see Figure 21).
Figure 21: ANOVA Hypothesis Test Summary
Hypothesis Test Summary
Null Hypothesis Test Sig.a,b Decision
1 The distribution of Score is the
same across categories of Industry.
Independent-Samples Kruskal-Wallis Test
.045 Reject the null hypothesis.
a. The significance level is .050. b. Asymptotic significance is displayed.
The ANOVA test does not reveal where the difference is among the industry categories but just confirms that some difference exists. To determine where these industry groups are different, additional follow-up tests were conducted using pairwise comparisons. The results of the multiple comparisons test were inconclusive when looking at the adjusted p-values using a Bonferroni
correction. Given the large number of industry groups, 45 separate t-tests were conducted comparing each possible paring. The Bonferroni correction was applied to account for the random variability of these tests. Industry parings that were significant in the normal pairwise test was leveled out during the correction process. See APPENDIX D – Test Results.
4.5 Executive Interviews
A total of 16 executive interviews were collected from SCS leaders. 69% come from industries based in North America, 19% in Asia and 13% in Europe. A majority are based on Manufacturing 38%, Technology 25% and Transportation and Warehousing 19%. The distribution of location and industry are very similar to the makeup of our survey data. The interviews asked executives to give their insights into the current state of SCS for their industry, impact of COVID-19 and implications for the future of this field. APPENDIX E – Executive Interview Results summarizes the key responses and learnings from these interviews in a condensed format. In evaluating the overall sentiment of these responses, a few general concepts and ideas were consistently brought up in these interviews:
42
I. SCS Importance: All executives viewed SCS as both a vital component for their organization
and see this as a growing field that is becoming more significant.
o “[Supply Chain Sustainability] More important than ever – backed up by quickly evolving regulation in Europe driving step-change in customer expectations on performance and assurance, leading to new.” – Dell.
II. SCS Pressures: 50% of the executives viewed customers as the main driver for change, while
20% indicated government, investors, and NGO’s levied pressures to their company.
o
“Regulations and mandates have increased globally, and there is an ever-increasing consumer pressure on corporations to take action to fight climate change and its impacts.” – Starbucks.III. Progressive Programs: Setting goals, getting buy-in from other organizations and making bold
declarations were viewed as the most progressive SCS practices for 58% of the executives.
o “When it [SCS program] is aligned with the purpose of the company and feel authentic
+ when the companies dare to sign up for challenging, ambitious goals even when the solutions do not exist. They then commit to be a part of the solution through innovation.” – Ralph Laruen.
IV. SCS Priority: Social issues such as human rights protection, labor and diversity were the top
SCS subjects for 50% of the executives this year.
o “For the transportation industry, I’m going to say its going to be emission number 1. labor number 2, waste and water three and four.” – UPS
V. SCS Barriers: Collaboration with suppliers and sharing of information were the biggest barriers
to SCS success for 75% of the executives in this year.
o “Many of our suppliers are manufacturers of specialized materials, and they tend to be smaller companies or private firms that that may not themselves have mature sustainability programs. With these suppliers we seek to set reasonable expectations, to educate them about requirements, and to provide straightforward ways for them to assist us in our efforts.” – Waters Corporation
VI. SCS Technology: Internet of Things (IOT), Electric Vehicles (EV), Blockchain and
transparency mapping were the most important technology for SCS.